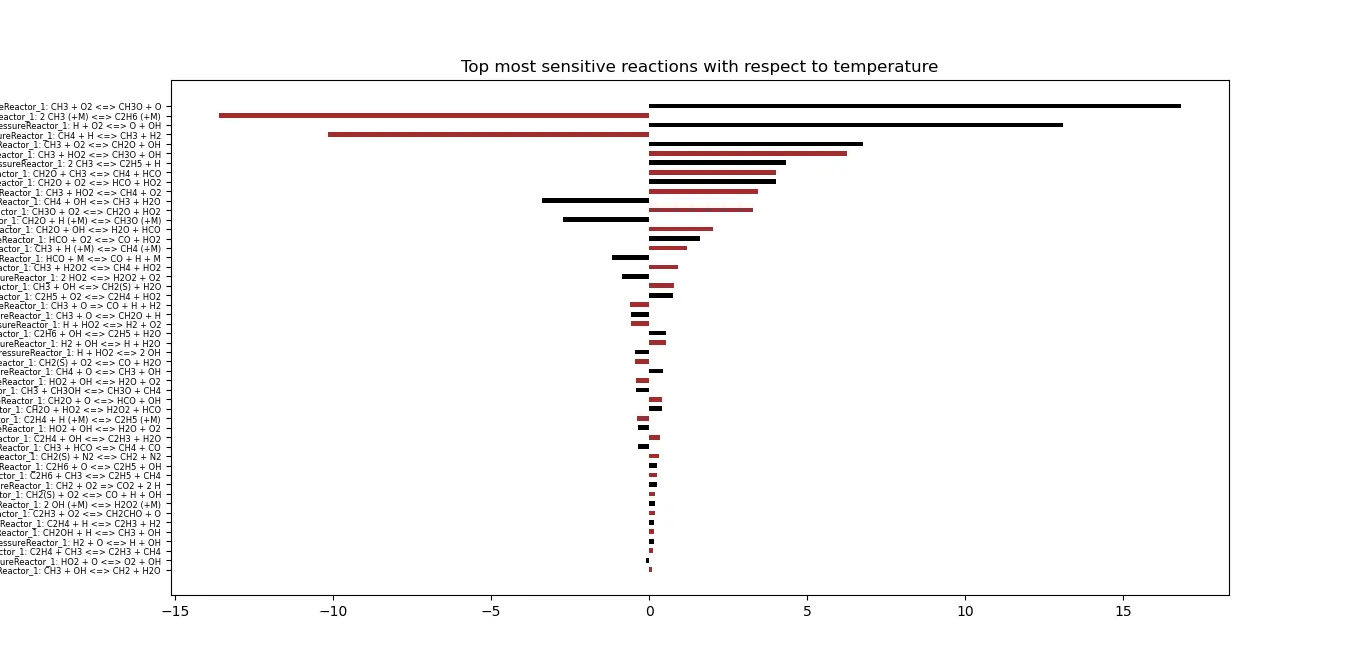
Sensitivity analysis of temperature in a GRI30 mechanism file
Objective:
- To write a code that calculates ten top most sensitivity values of temperature, and plot the results with respect to corresponding reactions, of a GRI30 mechanism file
Theory:
Sensitivity analysis in general is the study of change of dependent variable with respect to the independent variable i.e. the slope of the curve.
In a reaction mechanism, the change of value of parameters is different for different reactions, which means that the parameters are sensitive to some reactions and insensitive (relatively) to some other reactions. There are several reasons for which this happens, as the products and the energy liberated with each reaction are different.
The sensitive analysis is done by finding the slope at each time step, for each reaction. In this project sensitivity analysis is done for temperature, which means that the study is aimed at finding out the reactions which affects the temperature the most.
Senstivity value can be negative too, which simply means that the slope is negative, which implies that with increase in independent variable, there is a decrease in dependent variable.
Introduction:
In this project, the simulation is done for two milli seconds, with a step size of five micro seconds. Initial conditions are temperature - 1500 K, pressure - 1 atm. Fuel considered is methane and the mixture is stoichiometric.
- The logic here is that, at certain time step, sensitivity value of each reaction is compared with the corresponding value of previous time step. If the absolute value of the latter is bigger, it replaces the former
- After finding out maximum sensitivity values of all reactions, they are then sorted in descending order
- Then the top ten values of the maximum sensitive values of each reaction are stored in a seperate list and are plotted
Simulation:
Python code to conduct sensitivity analysis for temperature is,
import cantera as ct
import numpy as np
import matplotlib.pyplot as plt

gas = ct.Solution('gri30.xml')
temp = 1500
press = ct.one_atm

gas.TPX = temp,press,'CH4:1,O2:2,N2:7.52'
r = ct.IdealGasConstPressureReactor(gas)
sim = ct.ReactorNet([r])

N = 10
n = gas.n_reactions

for i in range(n):
	r.add_sensitivity_reaction(i)

sim.rtol = 1e-6
sim.atol = 1e-15

sim.rtol_sensitivity = 1e-6
sim.atol_sensitivity = 1e-6

sen = np.zeros(n)
names = []

T = np.arange(0,2e-3,5e-6)
states = ct.SolutionArray(gas, extra = ['time_in_ms','t'])

for j in T:
	sim.advance(j)

	for k in range(n):
		states.append(r.thermo.state, time_in_ms = j*1e3, t = j)
		s = sim.sensitivity('temperature',k)
		names.append(sim.sensitivity_parameter_name(k))
		if np.abs(s) >= np.abs(sen[k]):
			sen[k] = s #Storing maximum values


#Sorting in descending order
for l in range(n):
	for m in range(l+1,n):
		if np.abs(sen[l]) < np.abs(sen[m]):

			temporary_1 = sen[l]
			sen[l] = sen[m]
			sen[m] = temporary_1

			temporary_2 = names[l]
			names[l] = names[m]
			names[m] = temporary_2

sen_new = []
names_new = []
for o in range(N):
	sen_new.append(sen[o])
	names_new.append(names[o])

for p in range(N):
	print('%s = %f' %(names_new[p],sen_new[p]))
#min_val = np.min(sen_new)
#max_val = np.max(sen_new)
#leng = len(sen_new)

#abscissa = sorted(list(np.linspace(min_val-1,max_val+1,leng)),reverse=True)
ordinate=list(np.arange(N,0,-1))

plt.figure(figsize=(20,5))
plt.barh(y=ordinate,width=sen_new,tick_label=names_new,color=['black','brown'],height=0.5)
plt.yticks(fontsize=6)
plt.ylabel('Sensitivity value')
plt.title('Top ten sensitivity values for temperature')
plt.show()
When the above code is executed, the resultant plot is,
Results:
IdealGasConstPressureReactor_1: CH3 + O2 <=> CH3O + O = 16.847497
IdealGasConstPressureReactor_1: 2 CH3 (+M) <=> C2H6 (+M) = -13.618281
IdealGasConstPressureReactor_1: H + O2 <=> O + OH = 13.103708
IdealGasConstPressureReactor_1: CH4 + H <=> CH3 + H2 = -10.157244
IdealGasConstPressureReactor_1: CH3 + O2 <=> CH2O + OH = 6.779897
IdealGasConstPressureReactor_1: CH3 + HO2 <=> CH3O + OH = 6.270456
IdealGasConstPressureReactor_1: 2 CH3 <=> C2H5 + H = 4.345311
IdealGasConstPressureReactor_1: CH2O + CH3 <=> CH4 + HCO = 4.028984
IdealGasConstPressureReactor_1: CH2O + O2 <=> HCO + HO2 = 4.026264
IdealGasConstPressureReactor_1: CH3 + HO2 <=> CH4 + O2 = 3.437058
Above are the top ten most sensitive values for temperature and the corresponding reactions. And the plotted result of above values is,
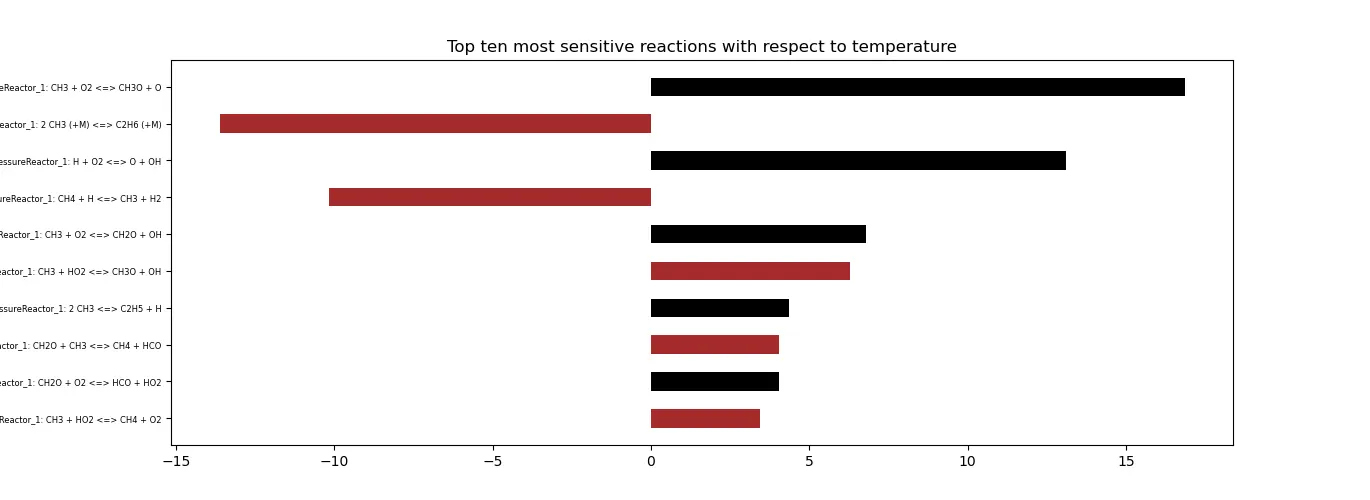
- The reason for large sensitivity values of temperature with respect to certain reactions is due to many reasons, but the primary cause of high sensitivity is the energy liberated with the occurrence of reaction. The other factors include mass of species (number of moles*molecular weight), internal energy (molecular kinetic energy - lattice vibrations, both translational and rotational and potential energy) etcetera.
Conclusions:
- The parametric code to find the top ten sensitivity values of temperature and plot them with respect to corresponding reactions is written and executed
Appendix:
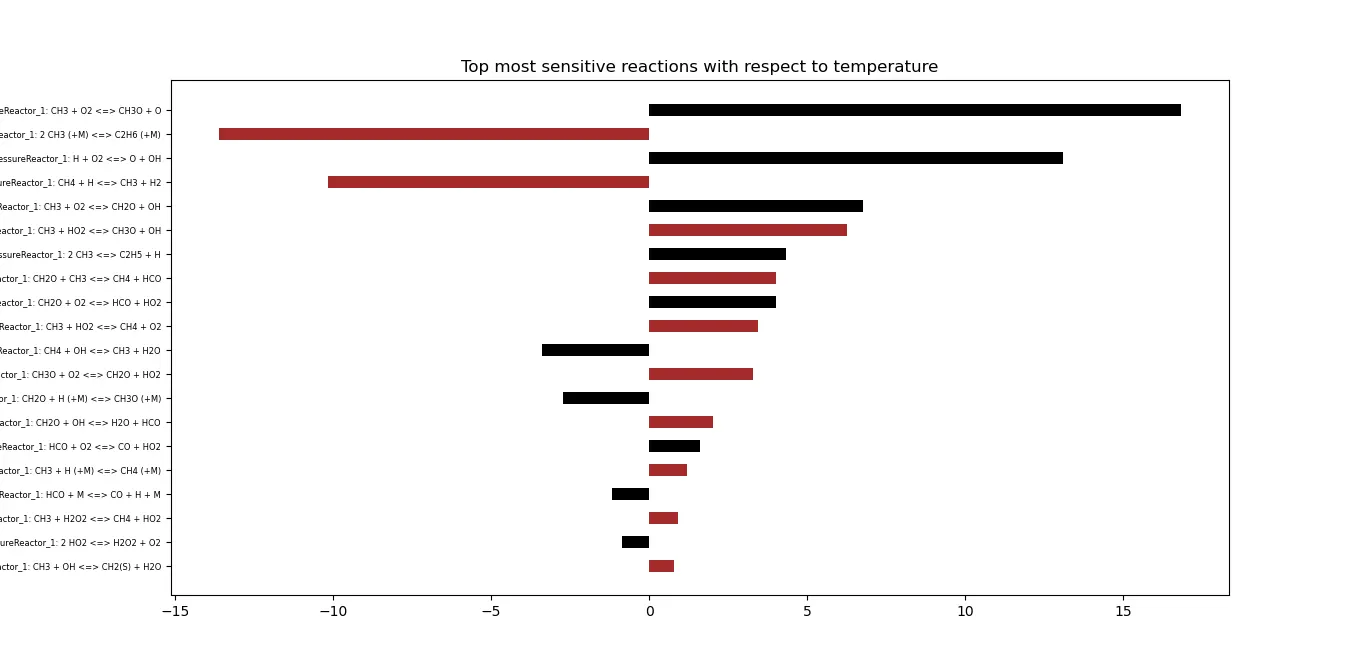
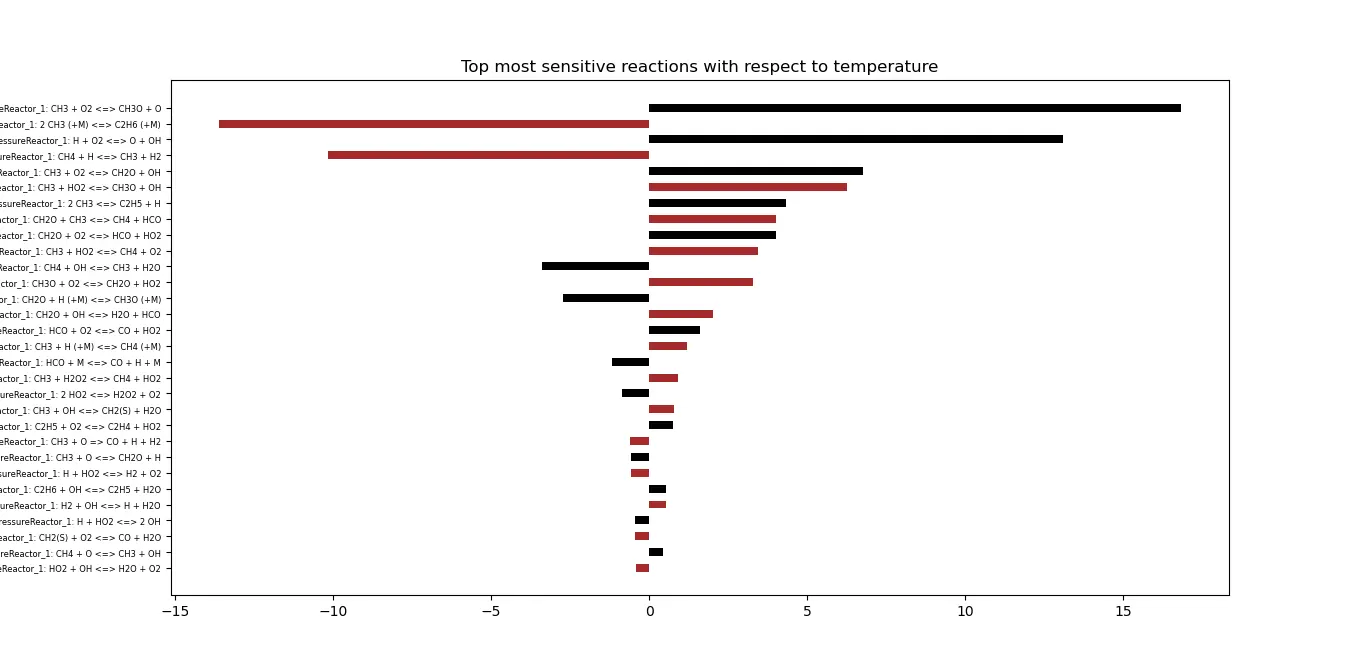
When the desired number of top most sensitivity values of temperature is altered (as the code is parametric, changing the N value to desired number of reactions should do the work). the plots obtained are,
A. When N=20:
B. When N=30:
C. When N=50: