Week 9 - Senstivity Analysis Assignment
AIM:
To write a code and find the 10 most senstive reaction
Theory:
In combustion reaction lots of reaction takes place each having their own rate constants and a chemical mechanis, nessiate all the details of all the reaction that effect the rate of the mechanism.These reactions are held at different operating condition and can be controlled to change the mechanism to own convenience to get the desired state.The observable parameter like temperature,pressure,species concentration ,mole fraction impacts on the rate of particular reaction.
Their relationship is defined by Sensitive analysis.The greater the sensitivity the so results in the amount of impact on the output's properties and parameter.Sensitivity analysis helps in determinig the ignition delay and predicts those reactions that are causes the sensitive ignition delay.In addition to that sensitive analysis also discloses particular parameter that have impact on the output and therefore provides the informtion of structure of the model.
In this project Cantera is used in python to perform sensitivity analysis.A gas object is created at istance of "Solution" Class.An ideal gas constant pressure "r" is created from "gas" and added into into reactor network.The reactor network advances and SolutionArray store the states at each time steps.
The reactions are extracted and from "r" and are added to sensitivity analysis.Sensltivity analysis is carried out for temperature and the most sensitive reaction are found.
Python Code
import cantera as ct
import numpy as np
import matplotlib.pyplot as plt

gas=ct.Solution('gri30.xml')

#Applying the initial variables  to gas mechanism
Temp=1500
Press=ct.one_atm


gas.TPX=Temp,Press,{'CH4':1,'O2':2,'N2':7.52}
r= ct.IdealGasConstPressureReactor(gas)
sim=ct.ReactorNet([r])

#Extracting the reaction equations and their numbers
reactions=gas.reaction_equations()
n=gas.n_reactions

r_id=np.linspace(1,n,n)

N=10 # value to be latered using to get the 10 most sensitive reaction

 # no of sens:itive reactions to be displayed
ST_max=[0]*n

#Adding all the reaction from the mechanism file to sensitivity analysis
for i in range(n):
	r.add_sensitivity_reaction(i)

#Absolute and relative tolerance
sim.rtol=1e-6
sim.atol=1e-15

sim.rtol_sensitivity=1e-6
sim.atol_sensitivity=1e-6

#Solution array that stores the reaction propteries at each time step
states=ct.SolutionArray(gas,extra=['t'])
t=np.arange(0,2e-3,5e-6)

#Outer time loop
for t in np.arange(0,2e-3,5e-6):
	sim.advance(t)
	states.append(r.thermo.state,t=t*1e3)

	for j in range(n):
		s=sim.sensitivity('temperature',j)

		if np.abs(s)>np.abs(ST_max[j]):
			ST_max[j] = s

#Sorting the reaction,reaction ids and maximum sentivity using for loop in list comprehension
#zip function is used to join the two values ie
react = [a for b,a in sorted(zip(np.abs(ST_max),reactions),reverse=True)]
rid_1=[a for b,a in sorted(zip(np.abs(ST_max),r_id),reverse=True)]
sT_max_1=[a for b,a in sorted(zip(np.abs(ST_max),ST_max),reverse=True)]

#Assiging the 10 senstive value of reactions,ids and sensitivity
ten_r=react[0:N]
ten_rid = rid_1[0:N]
ten_sens = sT_max_1[0:N]

#Extracting the mole fractions
Conc_H  =states('H').X
Conc_OH =states('OH').X
Conc_CH4=states('CH4').X


#Making a table of 10 most sensitive  Reactions,its IDS and Sensitivity
print("The top %d temperature senitive reaction are :"% (N))
print("-------------------------------------------------------------")
print("%8s %4s %18s %12s %12s" %('Reaction ID','|','Reaction','|','Sensitivity'))
print("-------------------------------------------------------------")
for k in range(N):
	print("%7s %8s %26s %4s %10.4f" % (ten_rid[k],'|',ten_r[k],'|',ten_sens[k]))
print("-------------------------------------------------------------")

#Ploting a bar graph to view the ten most sensitive reactions
plt.figure(1)
plt.grid('ON')
plt.barh(ten_r,ten_sens,color='red')
plt.gca().invert_yaxis()
plt.xlabel("Sensitivity")
plt.ylabel("Reactions")
plt.tight_layout()
plt.title("Highest Temperature Sensitivity of Gri 3.0")
plt.show()

#Plot for molar concentration
plt.figure(2)
plt.subplot(2,2,1)
plt.plot(states.t,states.T)
plt.xlabel('Time(sec)',fontsize=12)
plt.ylabel('Temperature',fontsize=12)

plt.subplot(2,2,2)
plt.plot(states.t,Conc_H)
plt.xlabel('Time(sec)',fontsize=12)
plt.ylabel('OH Mole Fraction',fontsize=12)

plt.subplot(2,2,3)
plt.plot(states.t,Conc_H)
plt.xlabel('Time(sec)',fontsize=12)
plt.ylabel('H Mole Fraction',fontsize=12)

plt.subplot(2,2,4)
plt.plot(states.t,Conc_CH4)
plt.xlabel('Time(sec)',fontsize=12)
plt.ylabel('CH4 Mole Fraction',fontsize=12)
plt.tight_layout()
plt.show()
Results
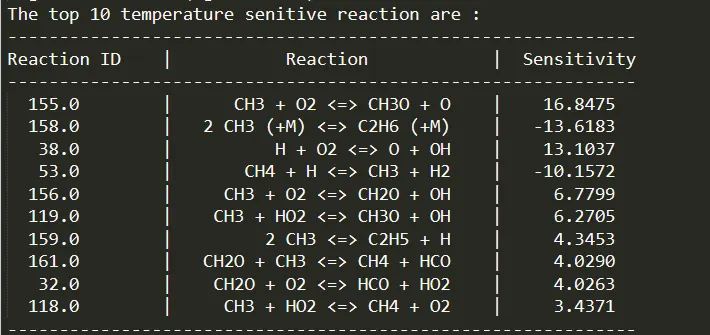
FIG.1
Plots
Bar graph for 10 most sensitive reactions
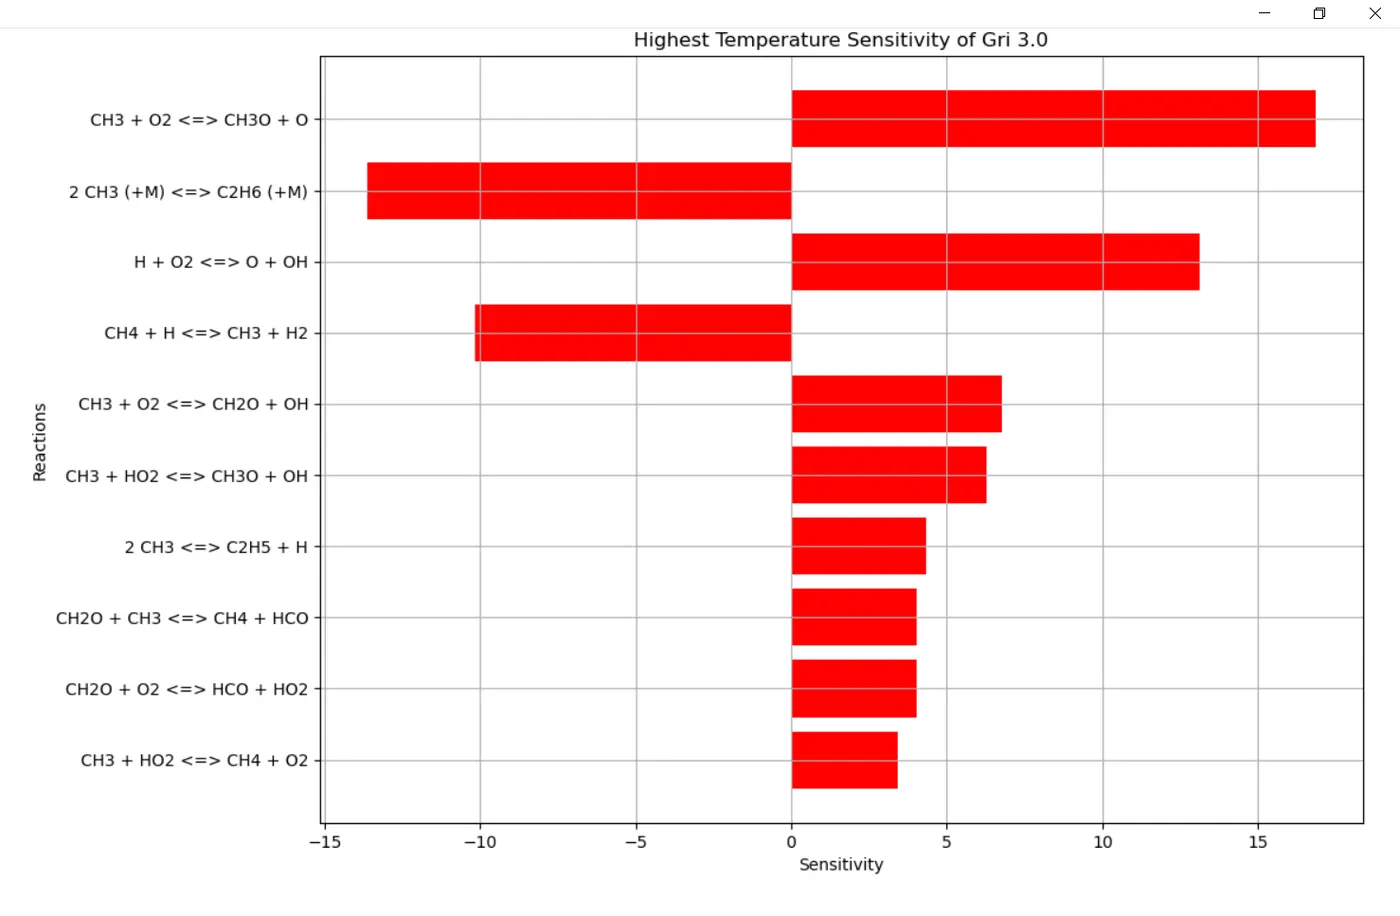
Here in this graph a positive sensitivity indicates that with increase in temperature results in incraease in rate of that reaction while in negative sensitivitty an increase in temperture implies a reduction in rate of that reaction
FIG.2
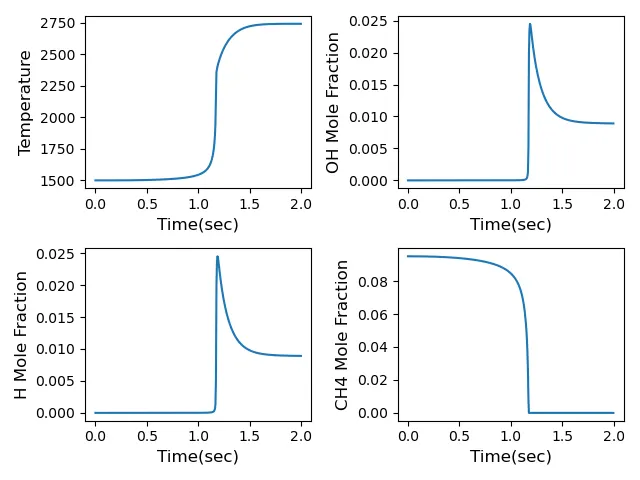
Temperaure and molar concentration VS Time in a ractor