Week - 9 Material Modeling from Raw Data
Week - 9 Material Modeling from Raw Data
OBJECTIVE :
Model material using MAT_024 or MAT_018 and then validate it.
- Extract the data from the diagram
- Clean the data and visually confirm that it matches the original data and the elastic modulus is 20.9E+06 psi.
- Convert the data to (kg-mm-ms) unit system
- Process the data and create the material as demonstrated
- Use the material model with a dogbone specimen and validate the same.
PROCEDURE:
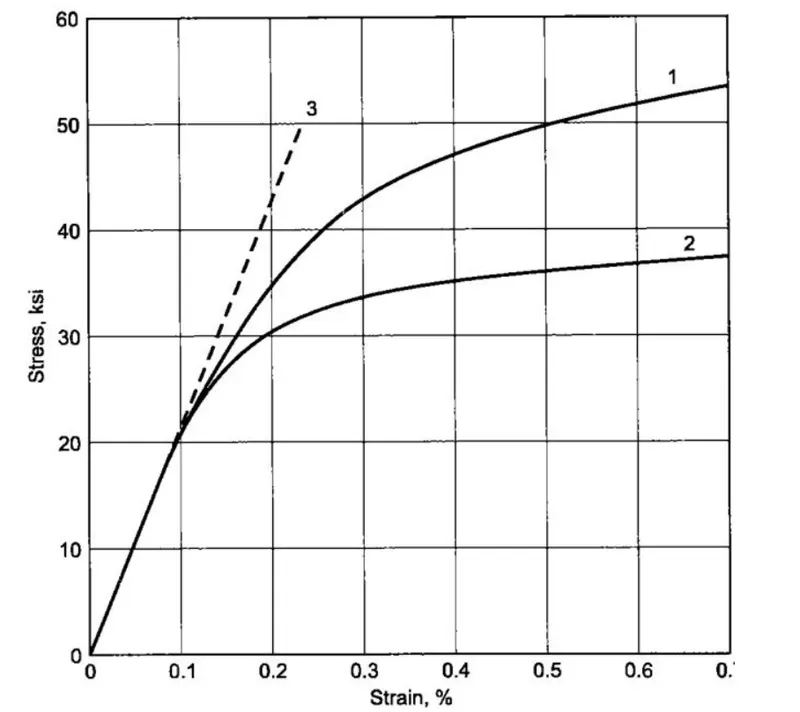
The Laboratory tested data of Graphite Iron Casting result is given, from which data are to be sourced.
- Download Data digitizer >> Digitize graphs and plots - GetData Graph Digitizer - graph digitizing software - download (getdata-graph-digitizer.com)
- Scale the X axis (0,0.7)
- Scale the Y axis (0,60)
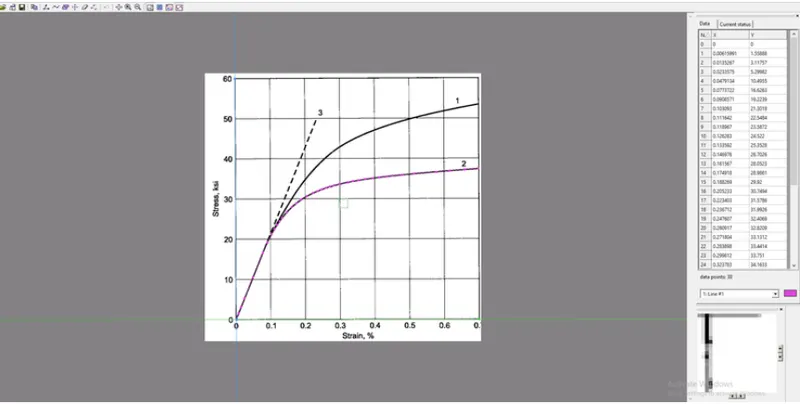
- The points are to be exported to excel as .csv format
| Strain % | Stress (ksi) |
| 0.00E+00 | 0.00E+00 |
| 2.06E-02 | 4.16E+00 |
| 4.25E-02 | 8.53E+00 |
| 6.68E-02 | 1.40E+01 |
| 8.63E-02 | 1.82E+01 |
| 9.23E-02 | 1.93E+01 |
| 9.84E-02 | 2.10E+01 |
| 1.06E-01 | 2.17E+01 |
| 1.11E-01 | 2.27E+01 |
| 1.19E-01 | 2.37E+01 |
| 1.23E-01 | 2.48E+01 |
| 1.31E-01 | 2.57E+01 |
| 1.38E-01 | 2.68E+01 |
| 1.52E-01 | 2.86E+01 |
| 1.64E-01 | 3.06E+01 |
| 1.82E-01 | 3.23E+01 |
| 1.94E-01 | 3.40E+01 |
| 2.07E-01 | 3.55E+01 |
| 2.20E-01 | 3.67E+01 |
| 2.35E-01 | 3.81E+01 |
| 2.49E-01 | 3.94E+01 |
| 2.68E-01 | 4.06E+01 |
| 2.79E-01 | 4.19E+01 |
| 2.99E-01 | 4.28E+01 |
| 3.19E-01 | 4.41E+01 |
| 3.45E-01 | 4.51E+01 |
| 3.71E-01 | 4.60E+01 |
| 4.01E-01 | 4.70E+01 |
| 4.33E-01 | 4.81E+01 |
| 4.61E-01 | 4.88E+01 |
| 4.94E-01 | 4.96E+01 |
| 5.31E-01 | 5.07E+01 |
| 5.67E-01 | 5.13E+01 |
| 5.98E-01 | 5.19E+01 |
| 6.25E-01 | 5.24E+01 |
| 6.44E-01 | 5.27E+01 |
| 6.73E-01 | 5.30E+01 |
| 6.99E-01 | 5.35E+01 |
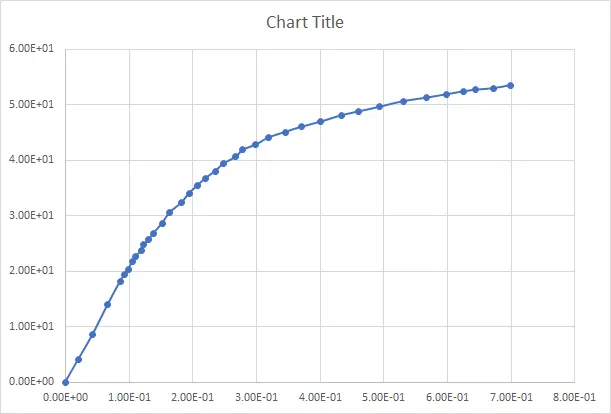
The Graph depicts Stress Vs Strain Curve, with data points from the lab results.since taken from digitizer we now need to clean the data received.
The data received is of True stress & True Strain, so to convert
- strain is to be divided by 100
- Stress is converted from KSI to Pascal (multiply by 6.895e+6)
- The Unit followed is kg/mm/ms
- By converting above data we get,
| True Strain | Stress (pa) |
| 0.00E+00 | 0.00E+00 |
| 2.06E-04 | 2.87E+07 |
| 4.25E-04 | 5.88E+07 |
| 6.68E-04 | 9.65E+07 |
| 8.63E-04 | 1.25E+08 |
| 9.23E-04 | 1.33E+08 |
| 9.84E-04 | 1.41E+08 |
| 1.06E-03 | 1.50E+08 |
| 1.11E-03 | 1.57E+08 |
| 1.19E-03 | 1.63E+08 |
| 1.23E-03 | 1.71E+08 |
| 1.31E-03 | 1.77E+08 |
| 1.38E-03 | 1.85E+08 |
| 1.52E-03 | 1.97E+08 |
| 1.64E-03 | 2.10E+08 |
| 1.82E-03 | 2.23E+08 |
| 1.94E-03 | 2.34E+08 |
| 2.07E-03 | 2.45E+08 |
| 2.20E-03 | 2.53E+08 |
| 2.35E-03 | 2.63E+08 |
| 2.49E-03 | 2.72E+08 |
| 2.68E-03 | 2.80E+08 |
| 2.79E-03 | 2.89E+08 |
| 2.99E-03 | 2.95E+08 |
| 3.19E-03 | 3.04E+08 |
| 3.45E-03 | 3.11E+08 |
| 3.71E-03 | 3.17E+08 |
| 4.01E-03 | 3.24E+08 |
| 4.33E-03 | 3.32E+08 |
| 4.61E-03 | 3.36E+08 |
| 4.94E-03 | 3.42E+08 |
| 5.31E-03 | 3.50E+08 |
| 5.67E-03 | 3.54E+08 |
| 5.98E-03 | 3.58E+08 |
| 6.25E-03 | 3.61E+08 |
| 6.44E-03 | 3.63E+08 |
| 6.73E-03 | 3.65E+08 |
| 6.99E-03 | 3.69E+08 |
To convert stress (pa) into Gpa , Divide the value by 1e+9
| True Strain | Stress (Gpa) |
| 0.00E+00 | 0.00E+00 |
| 2.06E-04 | 2.87E-02 |
| 4.25E-04 | 5.88E-02 |
| 6.68E-04 | 9.65E-02 |
| 8.63E-04 | 1.25E-01 |
| 9.23E-04 | 1.33E-01 |
| 9.84E-04 | 1.41E-01 |
| 1.06E-03 | 1.50E-01 |
| 1.11E-03 | 1.57E-01 |
| 1.19E-03 | 1.63E-01 |
| 1.23E-03 | 1.71E-01 |
| 1.31E-03 | 1.77E-01 |
| 1.38E-03 | 1.85E-01 |
| 1.52E-03 | 1.97E-01 |
| 1.64E-03 | 2.10E-01 |
| 1.82E-03 | 2.23E-01 |
| 1.94E-03 | 2.34E-01 |
| 2.07E-03 | 2.45E-01 |
| 2.20E-03 | 2.53E-01 |
| 2.35E-03 | 2.63E-01 |
| 2.49E-03 | 2.72E-01 |
| 2.68E-03 | 2.80E-01 |
| 2.79E-03 | 2.89E-01 |
| 2.99E-03 | 2.95E-01 |
| 3.19E-03 | 3.04E-01 |
| 3.45E-03 | 3.11E-01 |
| 3.71E-03 | 3.17E-01 |
| 4.01E-03 | 3.24E-01 |
| 4.33E-03 | 3.32E-01 |
| 4.61E-03 | 3.36E-01 |
| 4.94E-03 | 3.42E-01 |
| 5.31E-03 | 3.50E-01 |
| 5.67E-03 | 3.54E-01 |
| 5.98E-03 | 3.58E-01 |
| 6.25E-03 | 3.61E-01 |
| 6.44E-03 | 3.63E-01 |
| 6.73E-03 | 3.65E-01 |
| 6.99E-03 | 3.69E-01 |
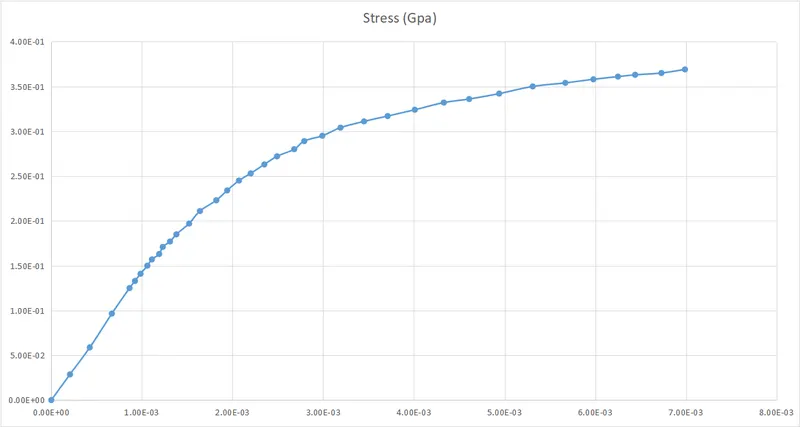
- As given. the elastic modulus is 20.9E+06 psi.
- Converting psi to pascal we get, 1.4410E+11 pa
- Multiplied with 10^-9 to change it into Kg, mm, ms = 144.1
- Youngs modulus = 144.1
Mat_24 accepts the data of plastic area.The elastic region contains data of density, Young's modulus and poissons ratio. The plastic data is needed, so neglecting the elastic data from the yield point.
Elastic Strain = True Stress / Elastic Modulus
Total true Strain = Platic Strain - Recoverable strain
Effective Plastic Strain = Total True Strain - Total True Stress/E
| True Strain | Stress (Gpa) | Effective Plastic Strain | Effective Stress |
| 0.00E+00 | 0.00E+00 | 0.00E+00 | 0.00E+00 |
| 2.06E-04 | 2.87E-02 | 6.83E-06 | 2.87E-02 |
| 4.25E-04 | 5.88E-02 | 1.70E-05 | 5.88E-02 |
| 6.68E-04 | 9.65E-02 | -1.67E-06 | 9.65E-02 |
| 8.63E-04 | 1.25E-01 | -4.45E-06 | 1.25E-01 |
| 9.23E-04 | 1.33E-01 | 2.98E-08 | 1.33E-01 |
| 9.84E-04 | 1.41E-01 | 5.51E-06 | 1.41E-01 |
| 1.06E-03 | 1.50E-01 | 1.91E-05 | 1.50E-01 |
| 1.11E-03 | 1.57E-01 | 2.05E-05 | 1.57E-01 |
| 1.19E-03 | 1.63E-01 | 5.88E-05 | 1.63E-01 |
| 1.23E-03 | 1.71E-01 | 4.33E-05 | 1.71E-01 |
| 1.31E-03 | 1.77E-01 | 8.17E-05 | 1.77E-01 |
| 1.38E-03 | 1.85E-01 | 9.62E-05 | 1.85E-01 |
| 1.52E-03 | 1.97E-01 | 1.53E-04 | 1.97E-01 |
| 1.64E-03 | 2.10E-01 | 1.76E-04 | 2.10E-01 |
| 1.82E-03 | 2.23E-01 | 2.72E-04 | 2.23E-01 |
| 1.94E-03 | 2.34E-01 | 3.16E-04 | 2.34E-01 |
| 2.07E-03 | 2.45E-01 | 3.70E-04 | 2.45E-01 |
| 2.20E-03 | 2.53E-01 | 4.44E-04 | 2.53E-01 |
| 2.35E-03 | 2.63E-01 | 5.25E-04 | 2.63E-01 |
| 2.49E-03 | 2.72E-01 | 6.02E-04 | 2.72E-01 |
| 2.68E-03 | 2.80E-01 | 7.37E-04 | 2.80E-01 |
| 2.79E-03 | 2.89E-01 | 7.84E-04 | 2.89E-01 |
| 2.99E-03 | 2.95E-01 | 9.43E-04 | 2.95E-01 |
| 3.19E-03 | 3.04E-01 | 1.08E-03 | 3.04E-01 |
| 3.45E-03 | 3.11E-01 | 1.29E-03 | 3.11E-01 |
| 3.71E-03 | 3.17E-01 | 1.51E-03 | 3.17E-01 |
| 4.01E-03 | 3.24E-01 | 1.76E-03 | 3.24E-01 |
| 4.33E-03 | 3.32E-01 | 2.03E-03 | 3.32E-01 |
| 4.61E-03 | 3.36E-01 | 2.28E-03 | 3.36E-01 |
| 4.94E-03 | 3.42E-01 | 2.57E-03 | 3.42E-01 |
| 5.31E-03 | 3.50E-01 | 2.88E-03 | 3.50E-01 |
| 5.67E-03 | 3.54E-01 | 3.21E-03 | 3.54E-01 |
| 5.98E-03 | 3.58E-01 | 3.50E-03 | 3.58E-01 |
| 6.25E-03 | 3.61E-01 | 3.74E-03 | 3.61E-01 |
| 6.44E-03 | 3.63E-01 | 3.92E-03 | 3.63E-01 |
| 6.73E-03 | 3.65E-01 | 4.20E-03 | 3.65E-01 |
| 6.99E-03 | 3.69E-01 | 4.43E-03 | 3.69E-01 |
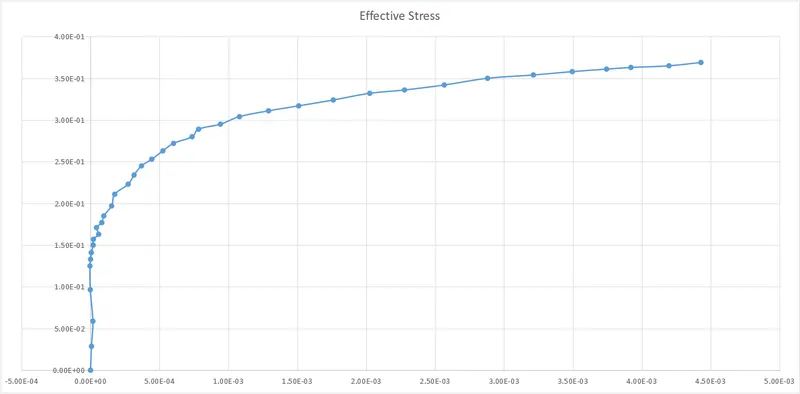
From the graph, we can see that stress value of 1.41E-01 Gpa has greater non linearlity. It is the yield point and ehere deformation occurs. The curve data is considered after yield point format_24.
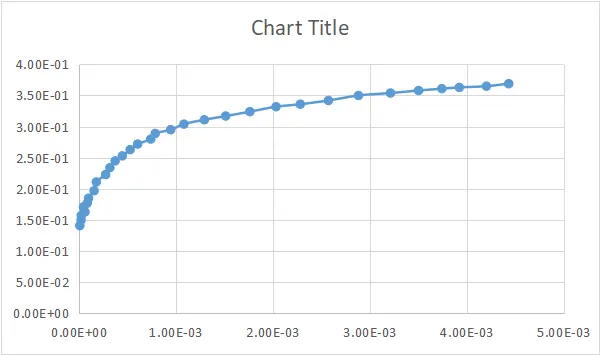
The data is to be fed into LCID,for Dog Bone Specimen.
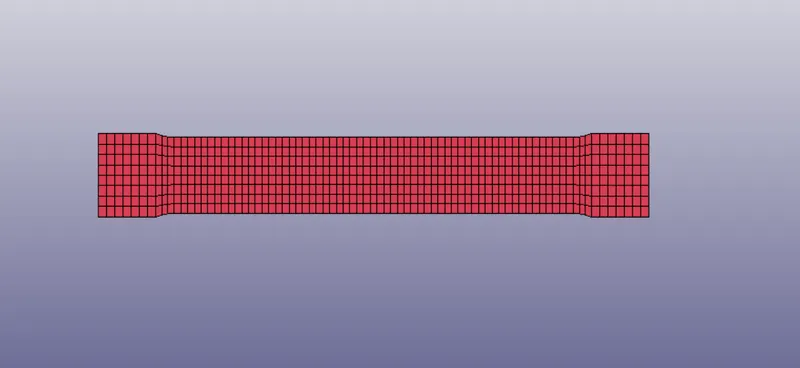
- Import the model
- Save the Output plastic curve data as .csv format, in which the LS DYNA accepts.
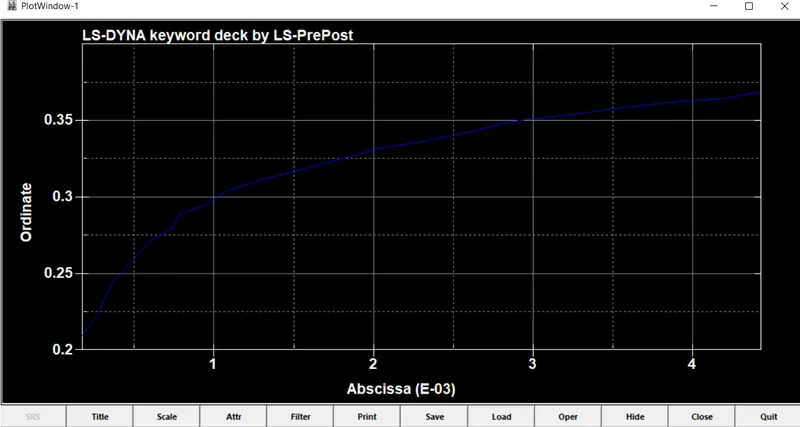
- Load XY Data >> Browse to data >> Accept >> Plot
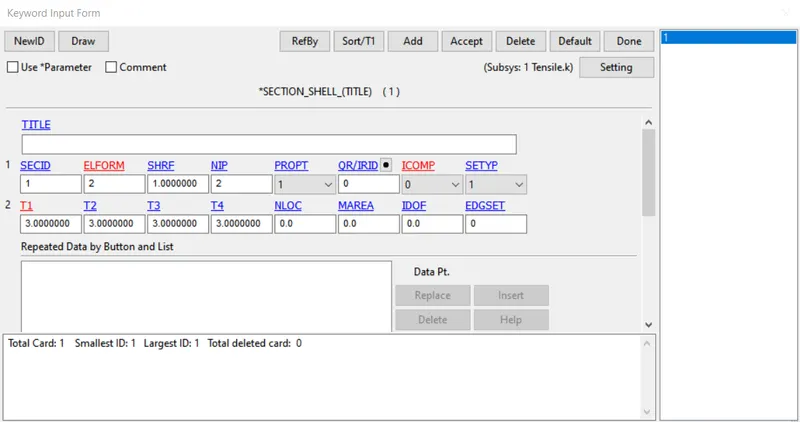
Part >> Section
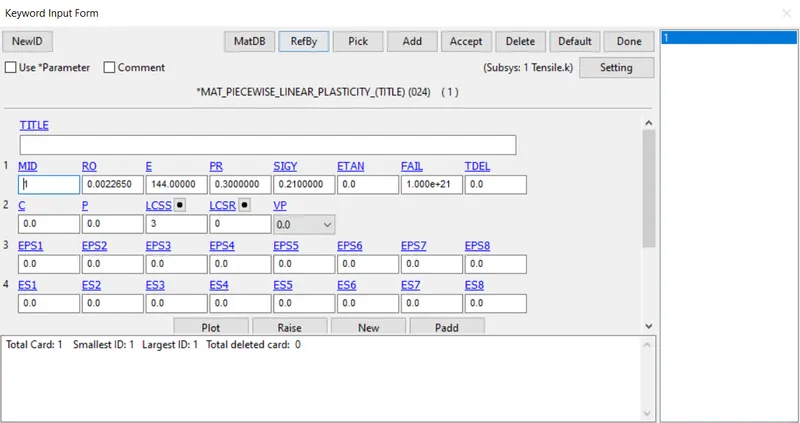
Material >>
Density = 7.800e-6
Young's Modulus = 144
Poisson's Ratio = 0.30
Yield Stress = 0.165
Material ID is specified
Boundary Conditions:
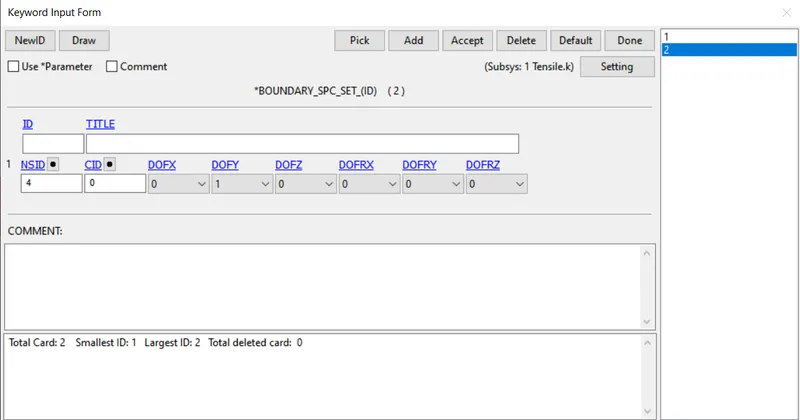
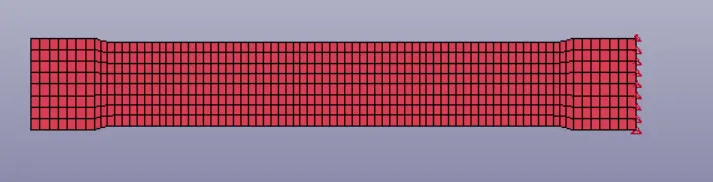
- To perform tensile test on dog bone specimen, One end is fixed at all directions except y.
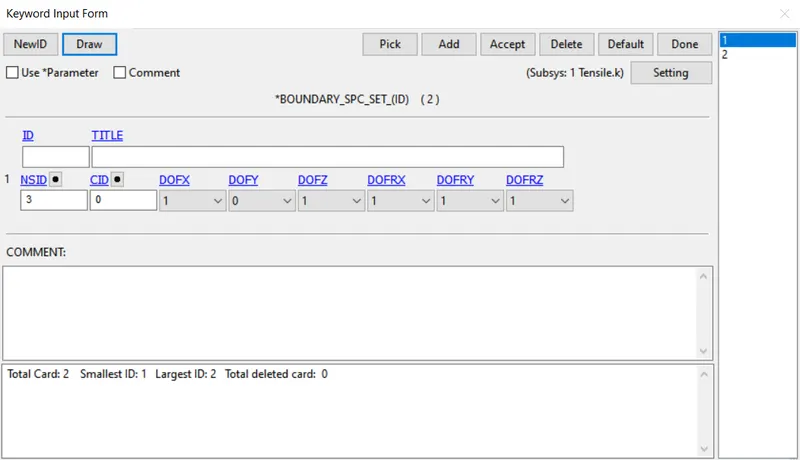
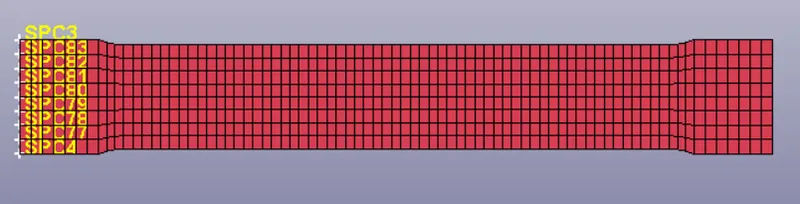
Two mid nodes at direction of x are fixed, locked in y direction.
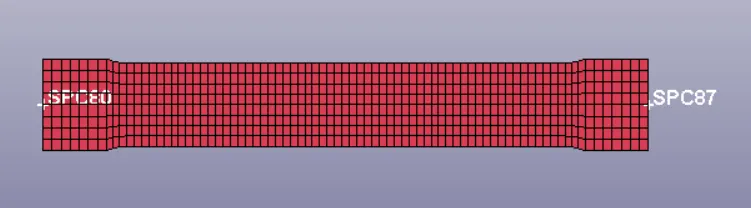
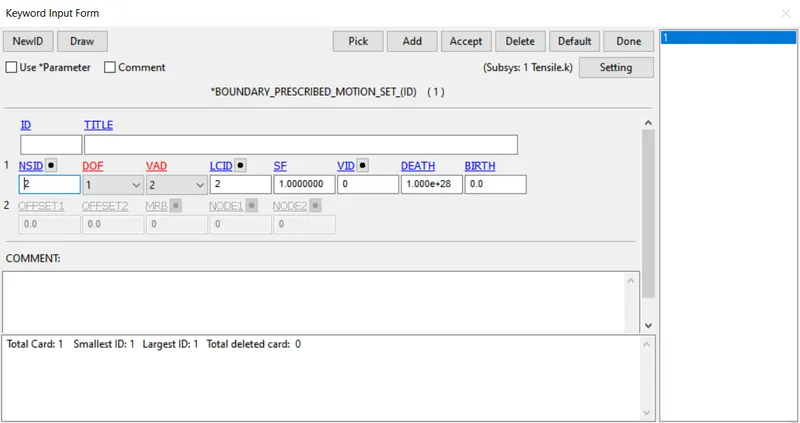
Prescribed Boundary Conditions :
- X direction Translation is specified
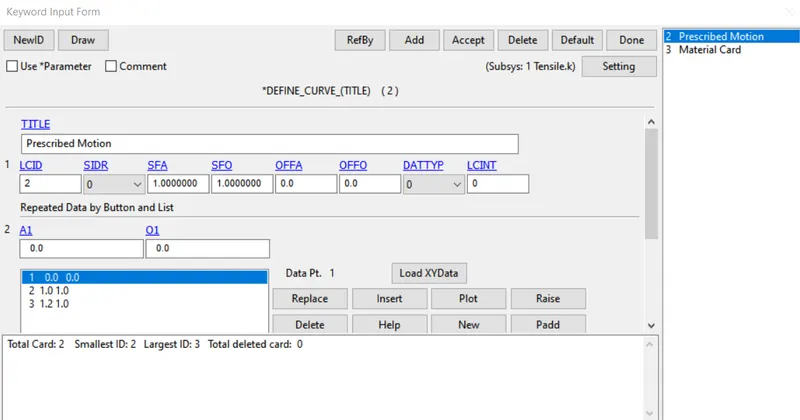
- Displacement motion is chosen.
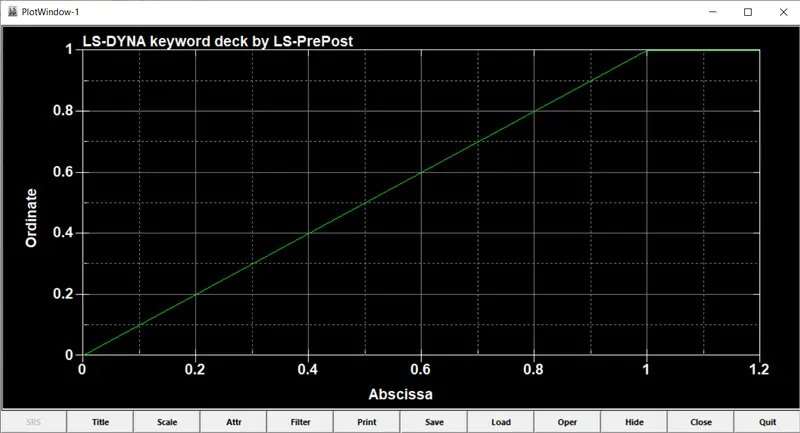
- Displacement curve is defined in LCID.
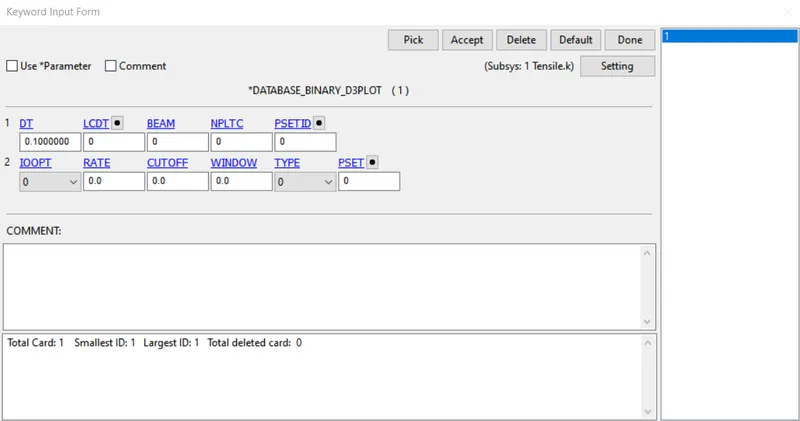
DATABASE CARD:
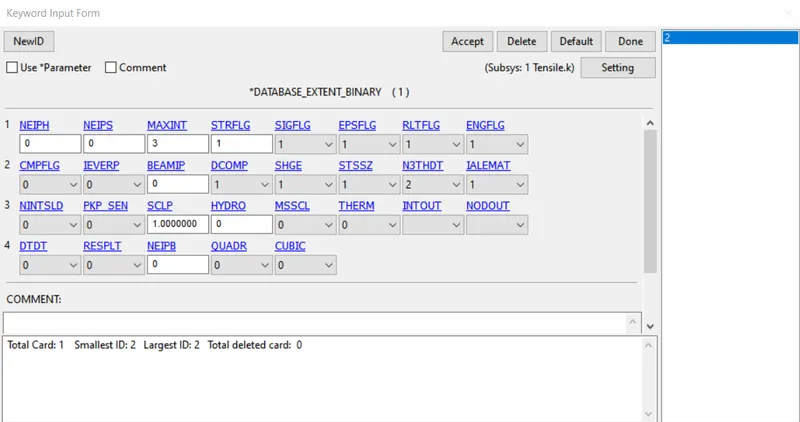
dt, Time interval between output is given as 0.10
STRFLG is given as 1, activate the strain output.
ASCII:
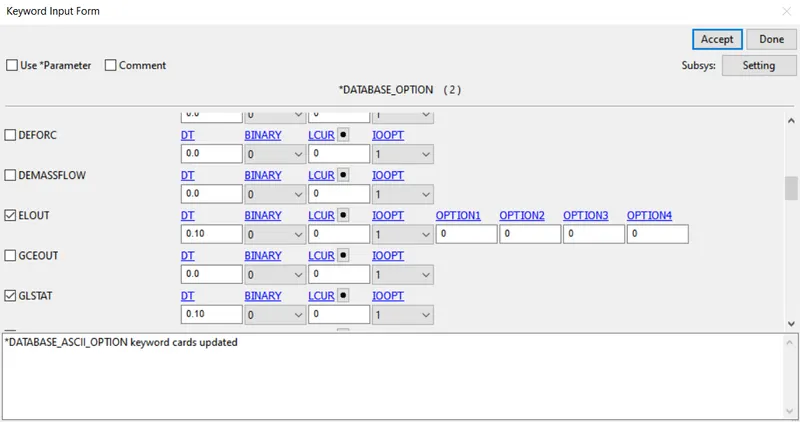
ELOUT, GLSTAT are specified with 0.10 time interval.
CONTROL CARDS :
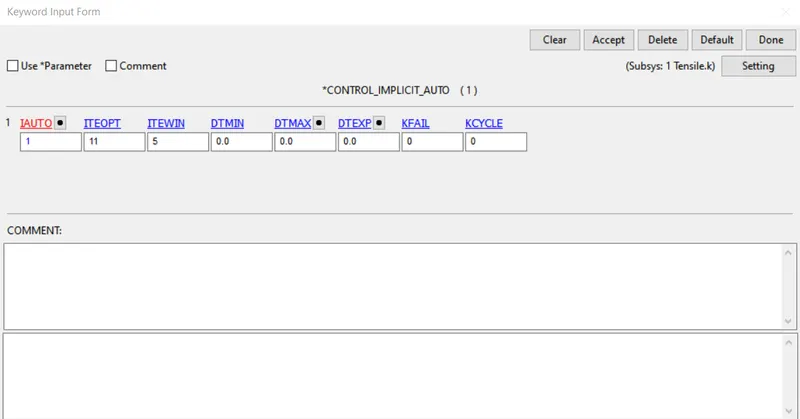
IAUTO 1 activates automatic time step
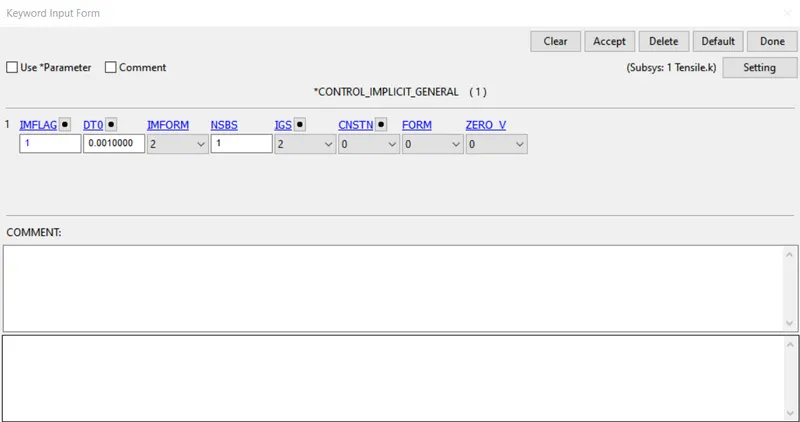
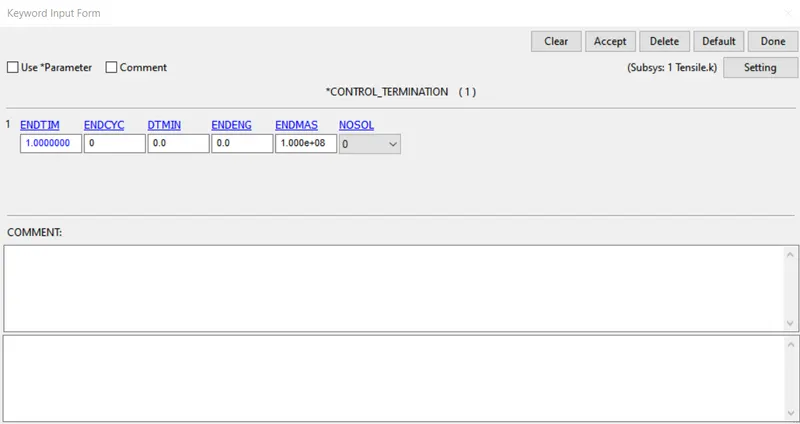
End time is given as 1ms
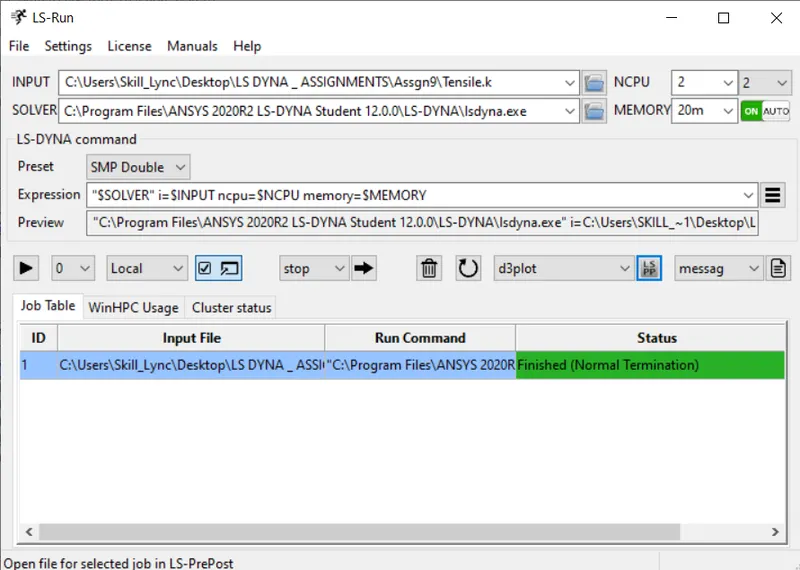
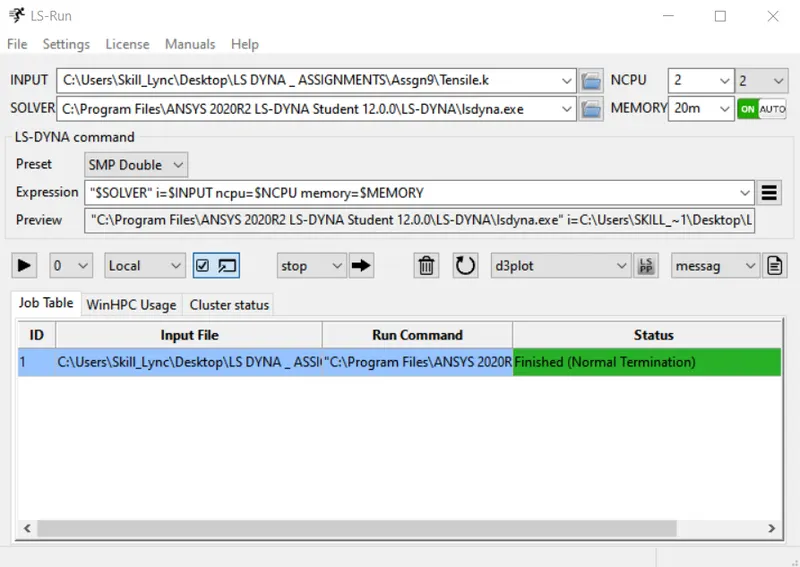
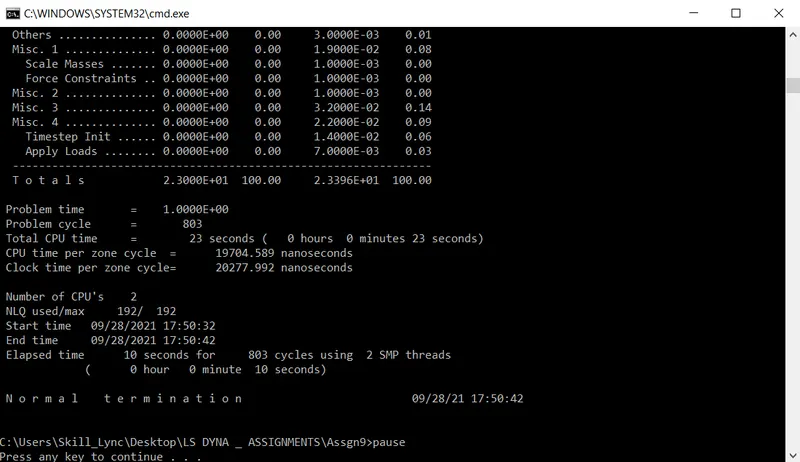
LS RUN >> RUN THE SIMULATION
 +
+
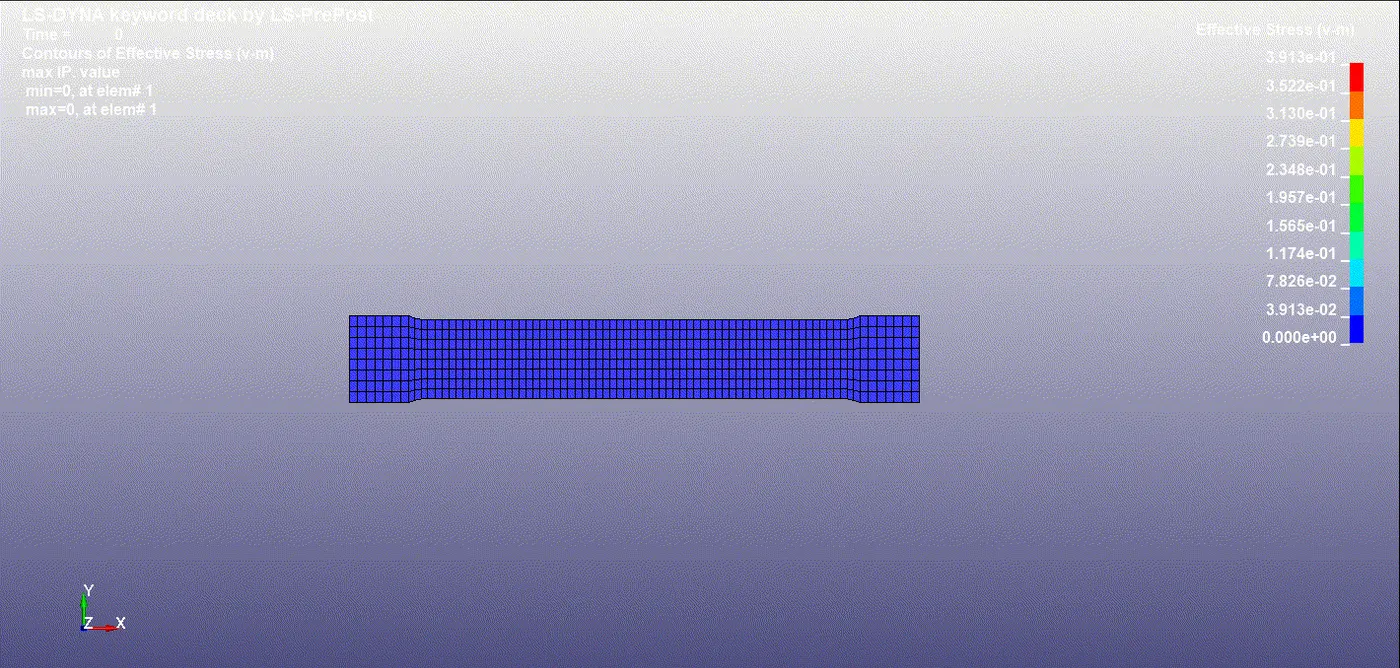
SIMULATED RESULT
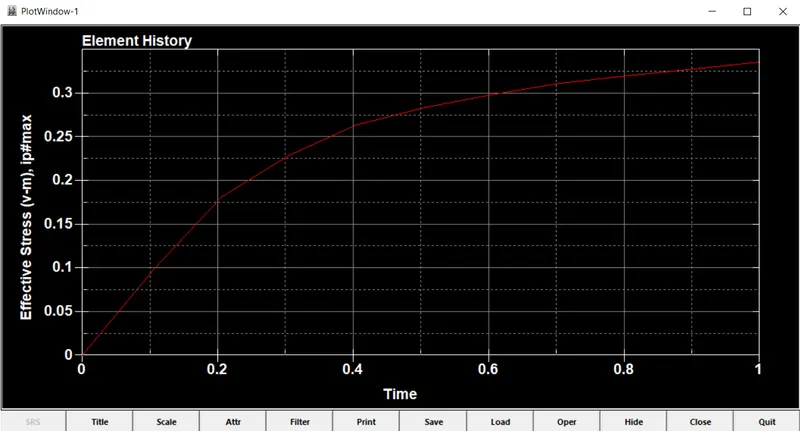
- EFFECTIVE STRESS
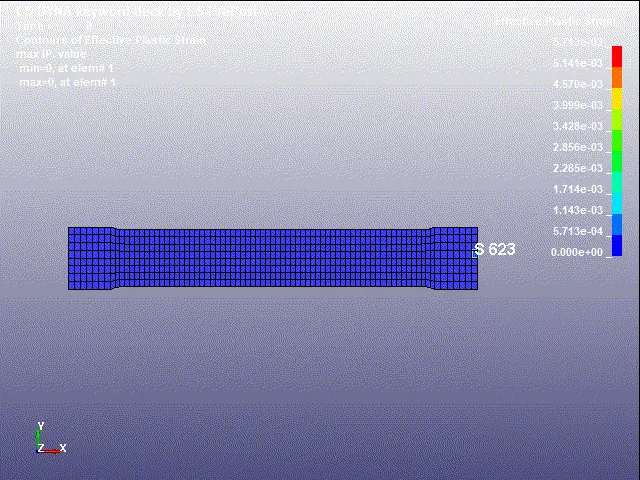
- EFFECTIVE STRAIN
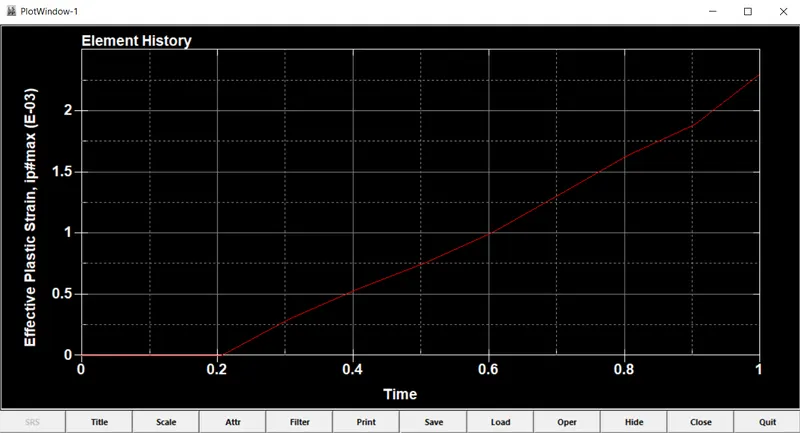
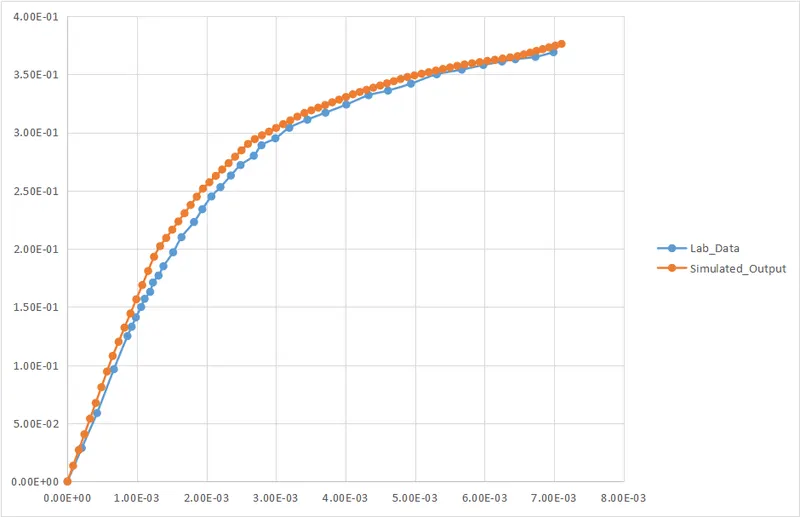
Stress Vs Strain Curve:
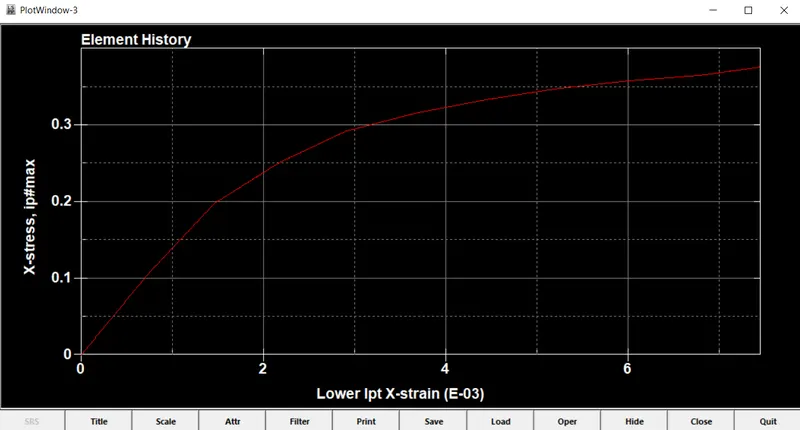
Comparison of true stress-strain curve of graphite iron casting with the simulated output.
Conclusion :
The material is modelled compared to the original data, in which the above graph shows that the data points must be precisely chosen to exactly simulated the model and validated!!