Week - 9 Material Modeling from Raw Data
Aim:
To Use the diagram of the true stress-strain curve of graphite iron casting. Two curves are there for different material structures. Students need to pick any one of them and use the data to create either a MAT_024 or MAT_018 material model and then validate it.
Objective:
- Extract the data from the diagram
- Clean the data and visually confirm that it matches the original data and the elastic modulus is 20.9E+06 psi
- Convert the data to (kg-mm-ms) unit system
- Process the data and create the material as demonstrated
- Use the material model with a dogbone specimen and validate the same
Procedure:
data extracted from the material curve image
by observing the curve we got 3 different strain rates given on different curves and we can observe the material behaviour in both elastic and plastic region
Actually the image in png format which will not support in get data digitizer so we have convert into jpg format and then import the material curve in the digitizer given the values Xmin,Xmax,Ymin and Ymax values once check the values and pick points on the curves
Curve1:
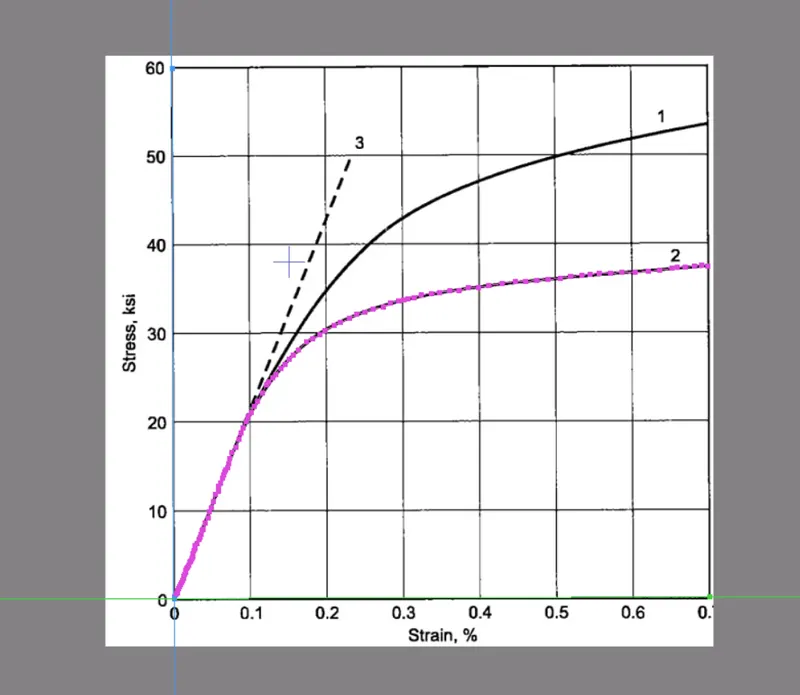
calculation of stress strain curve
the number of stress and strain points generated and exporeted to microsoft excel
the material card model we are using (kg-mm-ms)
1ksi=6894.76*10^3kg/m*s^2
1ksi=6.895*10^-3kg/mm*ms
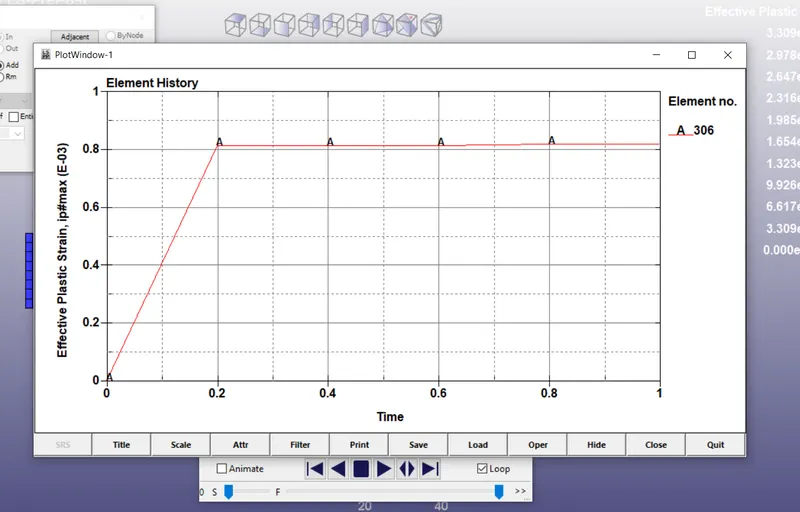
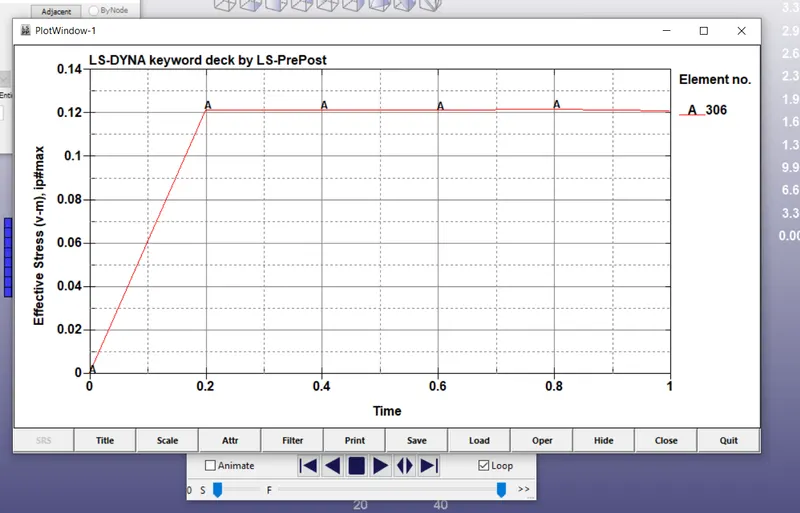
Effective plastic strain=true strain-true stress/E
where E is the elastic modulus
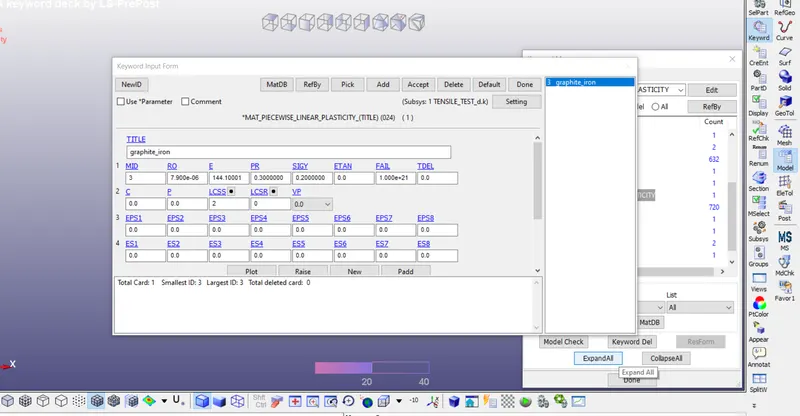
given E=20.9E^6psi after converting kg mm ms
the value is 144.100Gpa
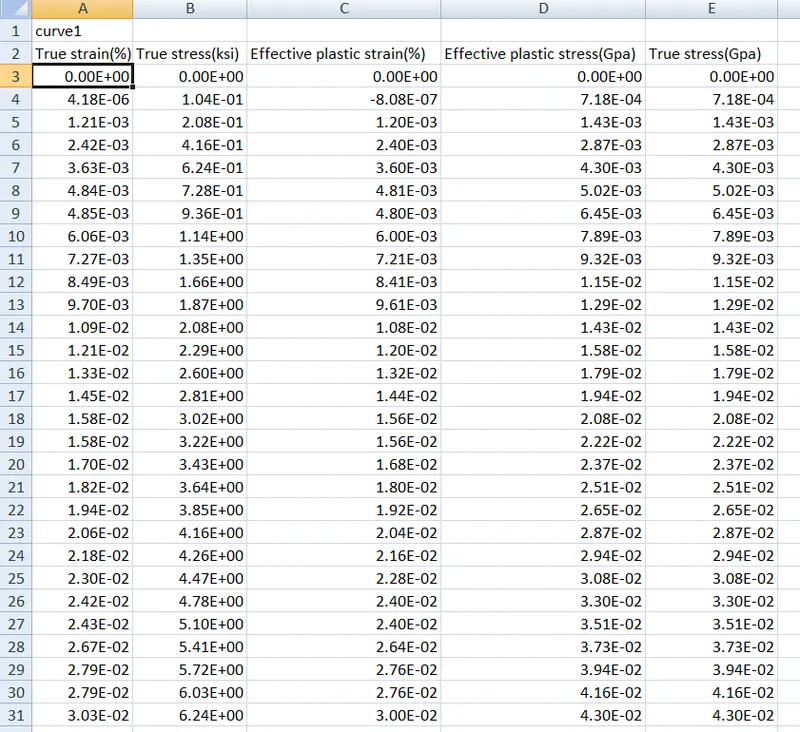
True strain vs True stress and Effective strain vs Effective stress graphs are shown in below.
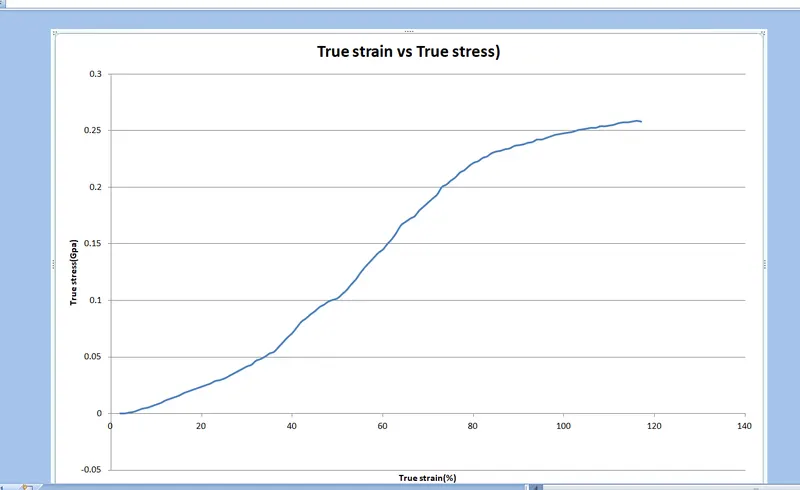
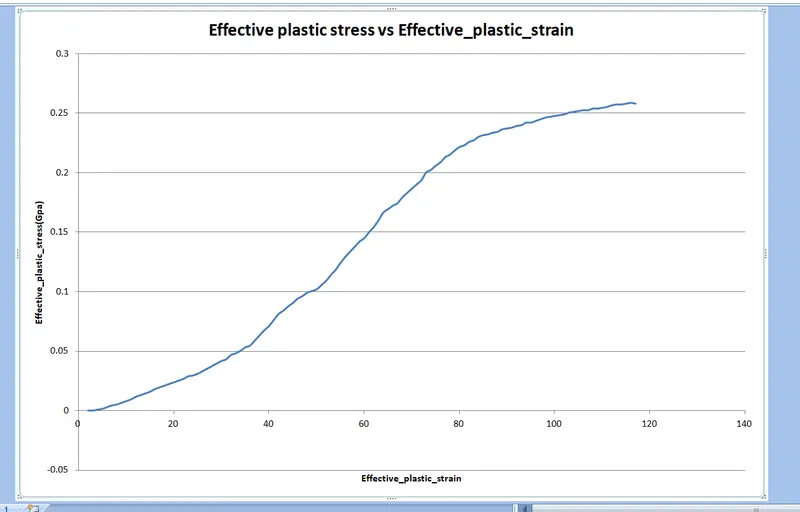
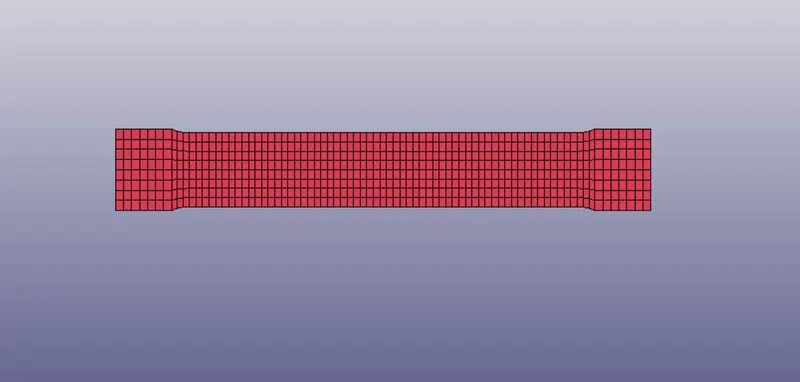
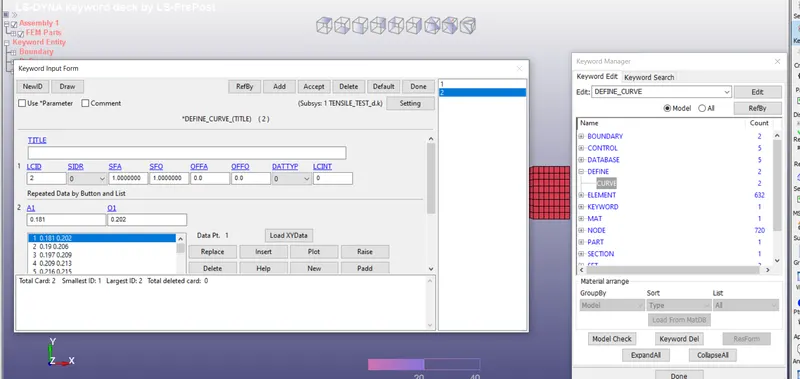
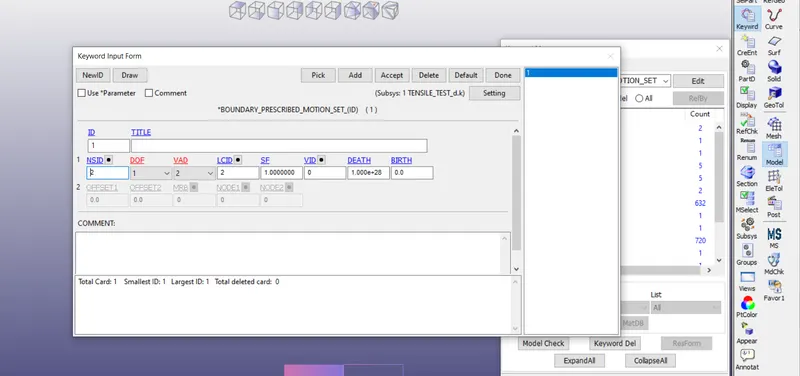
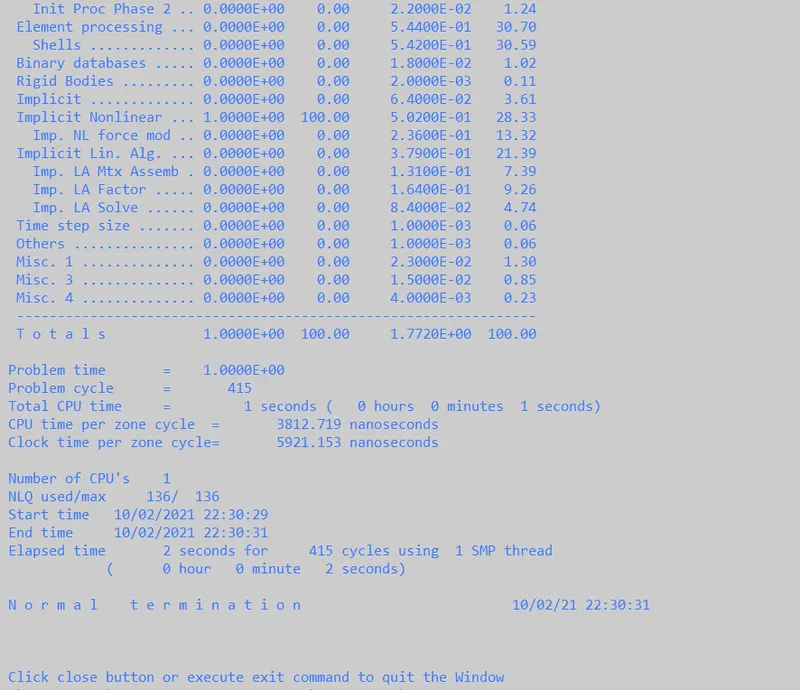
imported the dougbone specimen model and given the database_cards,control_cards,boundary,Material cards and defined the curve etc,.
Results:
Conclusion:
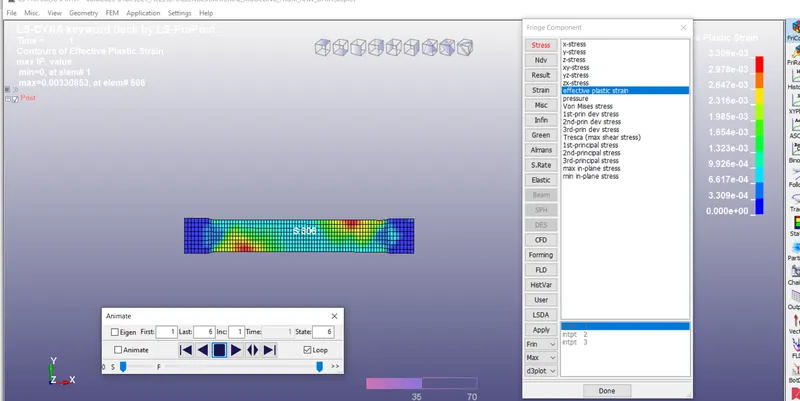
from the given graph the true stress and true strain strain alues are taken and caluculated the effective strain and effective stress values these values are imported into to curve and assigned to material curve and validate the results.