Week - 9 Material Modeling from Raw Data
OBJECTIVE:
- To extract the data from the given image of the stress-strain curve.
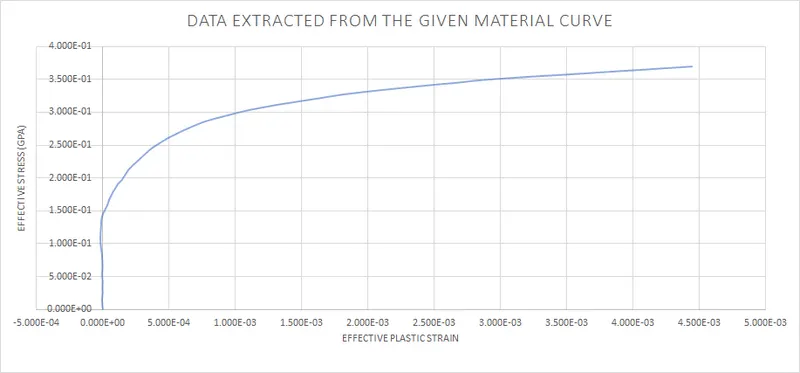
- To convert the true stress-strain data to effective plastic strain and effective stress.
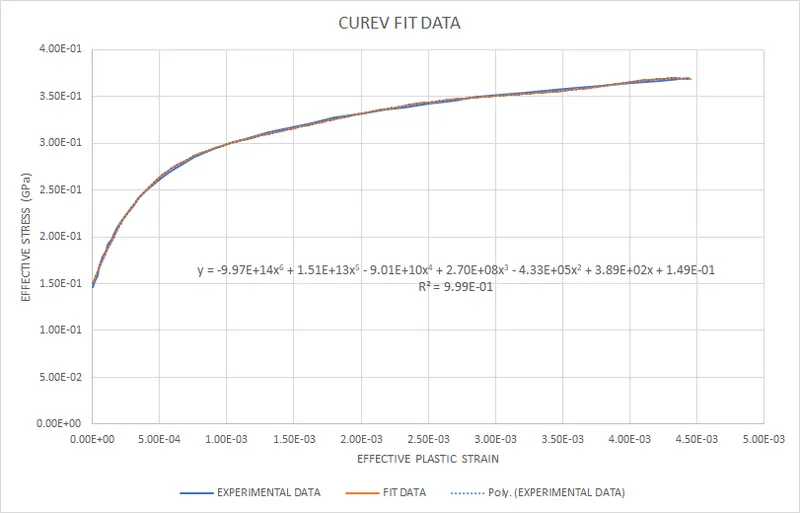
- To perform a curve fit to reduce the noise from the data.
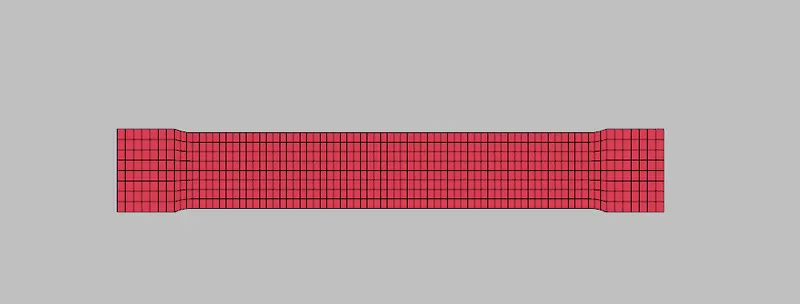
- To perform the uniaxial tensile loading using the given dogbone specimen and to compare it with the given data.
GIVEN STRESS-STRAIN CURVE:
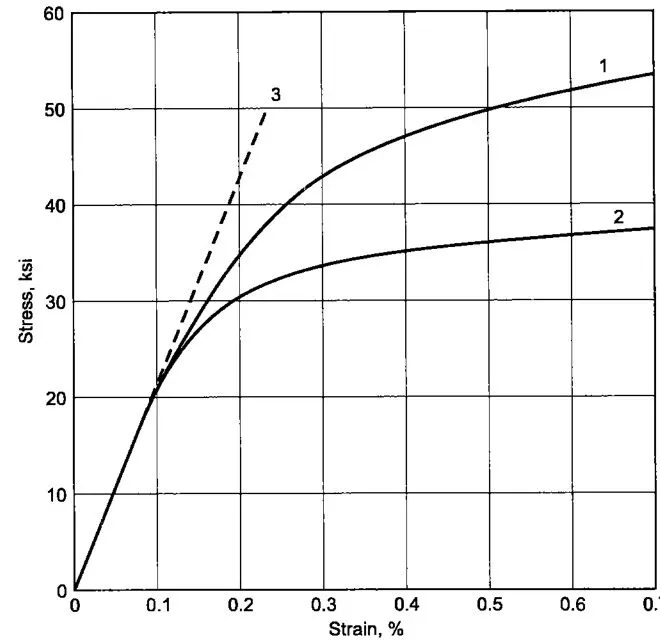
Data from curve one is extracted.
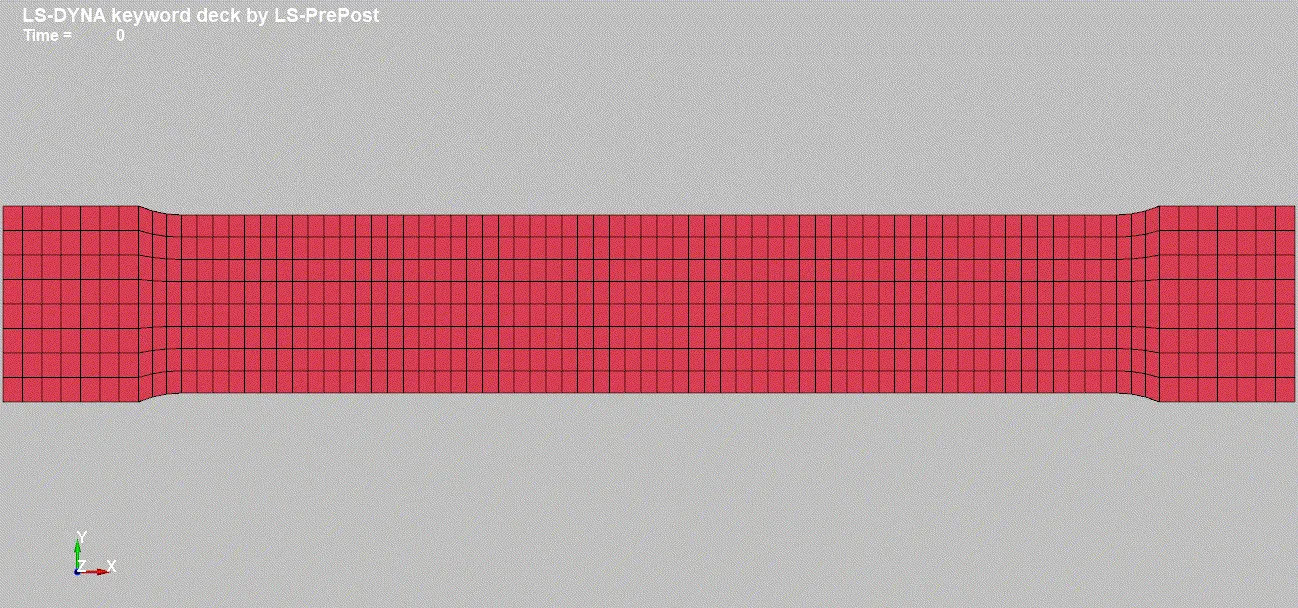
GIVEN DOGBONE SPECIMEN:
DATA EXTRACTED FROM THE CURVE:
CURVE FIT DATA:
In order to reduce the noise from the data, a curve fitting is performed with `R^2=0.9994`. The data starting from the yield point is only considered.
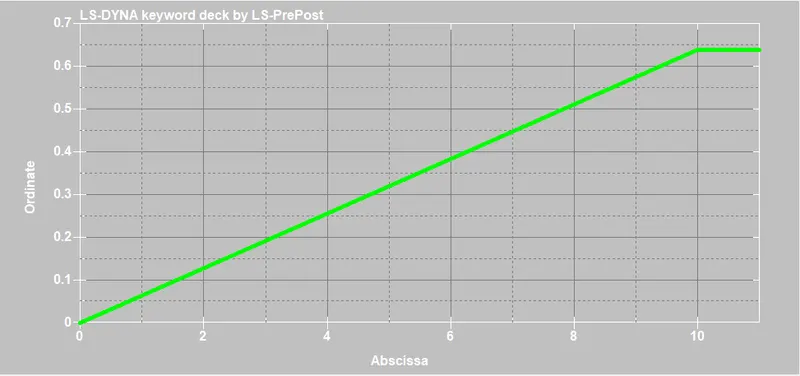
INPUT DISPLACEMENT CURVE:
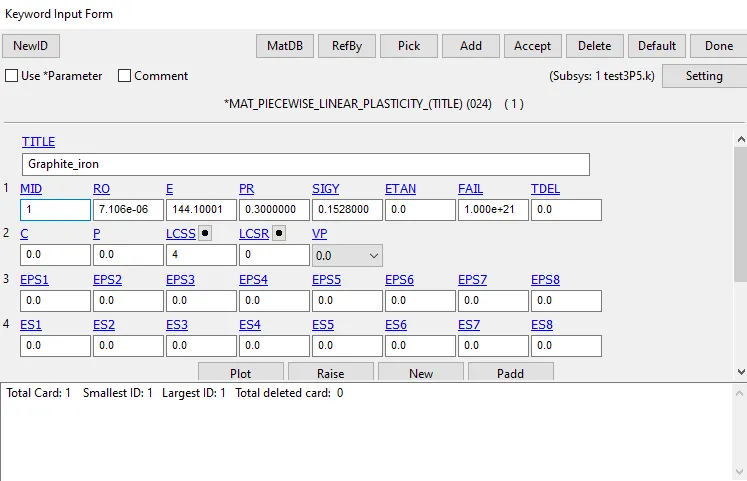
INPUT MATERIAL DATA:
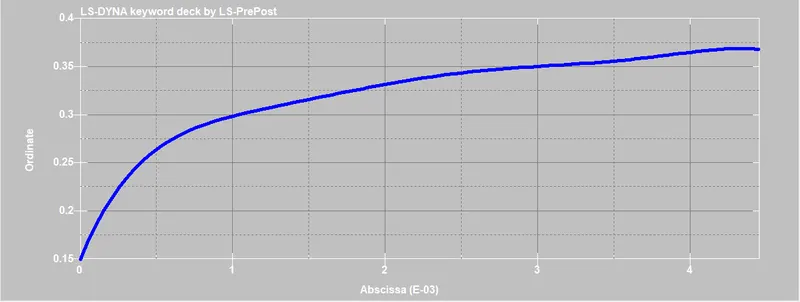
INPUT MATERIAL CURVE:
Using curve fitting, equidistant values from the data are chosen as the input for the material stress-strain curve.
RESULTS AND CONCLUSIONS:
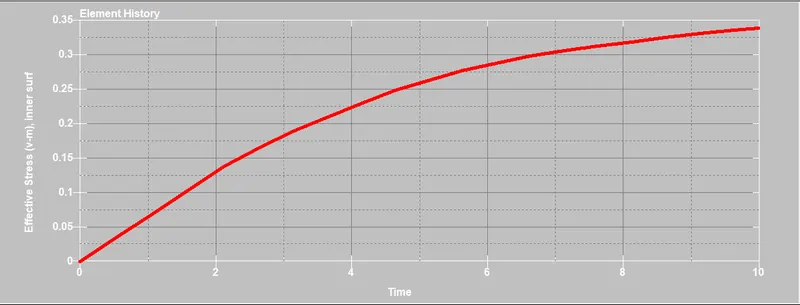
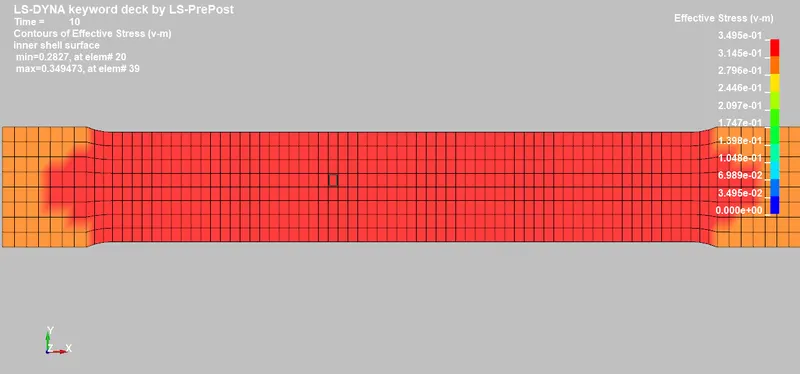
EFFECTIVE STRESS:
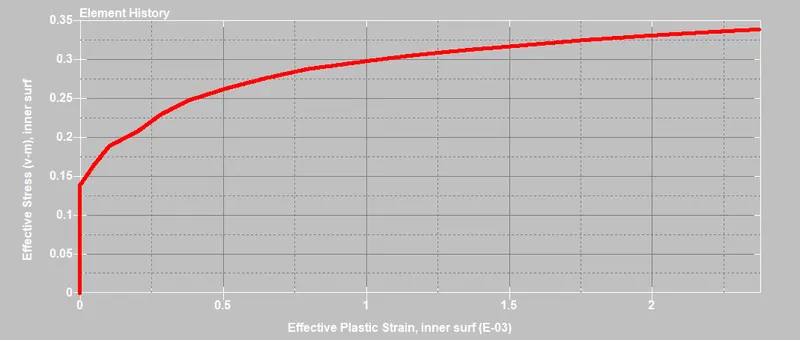
The maximum value of effective stress is 0.34GPa.
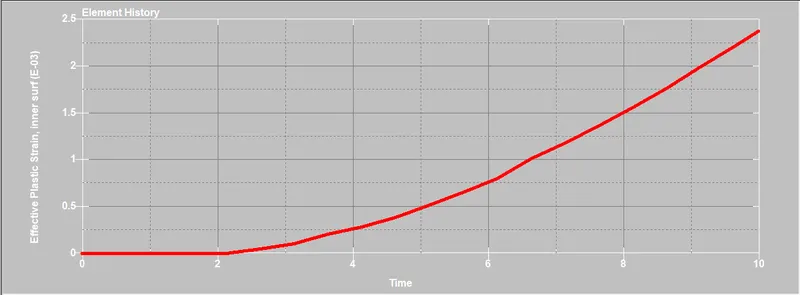
EFFECTIVE PLASTIC STRAIN:
The maximum value of effective plastic strain is: 2.3e-3
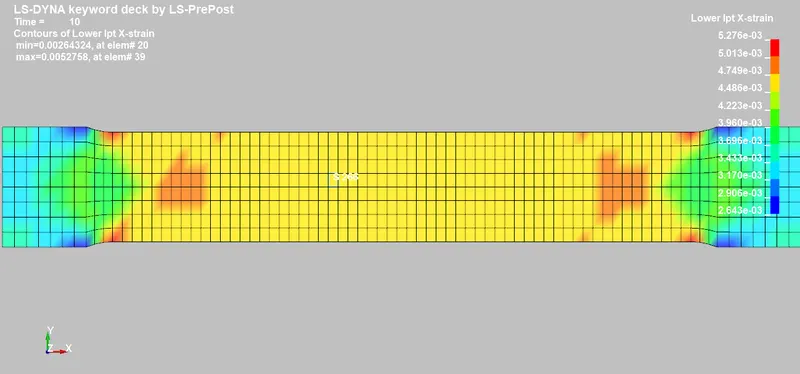
STRAIN ALONG THE X DIRECTION:
EFFECTIVE STRESS VS EFFECTIVE PLASTIC STRAIN PLOT:
COMPARISON BETWEEN EXPERIMENTAL DATA AND SIMULATION DATA:
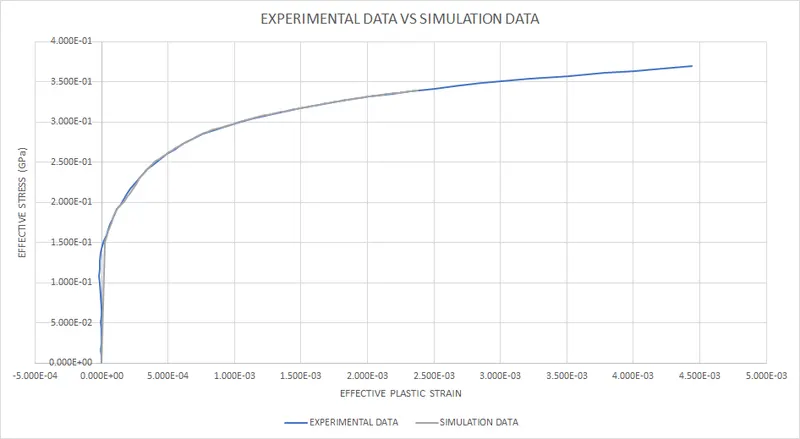
- From the two plots, it is clear that both the experimental and the simulation data are more or less the same.
- The termination time was set to 10ms, hence the simulated data curve didn't extend till the maximum value of the experimental data. Increasing the termination time and the displacement value in the displacement curve will extend the length of the simulation curve.
- The simulated data cure is much smoother than the experimental data curve till the yield point.