Week - 9 Material Modeling from Raw Data
MATERIAL MODELING FROM RAW DATA:
INTRODUCTION:
Material modeling is a widely undertaken process in industries. This process involves testing of new material or alloy and modeling this material through the extracted test data and validating it with the test data and thus can be used in later stages in simulation.
Material modeling is carried out in most of the industries mainly in Research and development sectors because new materials are preferred by the industries to eliminate certain parameters and impart new ones that could be beneficial for the application like improved fatigue, life cycle, thermal and wear-resistant, eliminating manufacturing costs, etc.
This newly modeled material can later be carried out in future engineering analysis using FEA tools thus preventing testing using a physical model and thus eliminating errors and increasing productivity.
OBJECTIVE:
To model a new material whose data either Force vs Displacement or Engineering Stress vs Strain data are collected through the different physical testing process. This data is represented in terms of a mathematical equation that replicates the behavior of the material can then be successfully used for future simulation tests.
This data is modeled in a MAT_024_PIECEWISE_LINEAR_PLASTICITY material card using the Load-Curve and hence its behavior replicates that of the newly modeled material and it is validated by performing a normal tensile test on a shell part.
SETUP:
- EXTRACTING TEST DATA:
- Data can either be raw data(tabular format) or as an image of the curve
- It can be Force vs displacement or engineering stress vs strain data.
- If the data is in form of a digital image, the data points can be extracted using "Graph Digitizer".
- If the data is a Force vs displacement curve, then these data points must be converted into valid engineering stress vs strain and later on to effective plastic strain vs true stress data.
This conversion can be carried out through the basic formulas,
Stress = Force per unit Area
Strain = Change in length / Original length
In our case, we have true stress and true strain% is given.
- data points for all three curves are extracted using the Getdata graph digitizer.
- Step 1: set the Xmin, Xmax, Ymin, Ymax values.
- step2:use the auto trace lines tool and remove unwanted points using the eraser tool.
- step3:use the reorder tool to arrange values from smallest to highest in terms of strain %
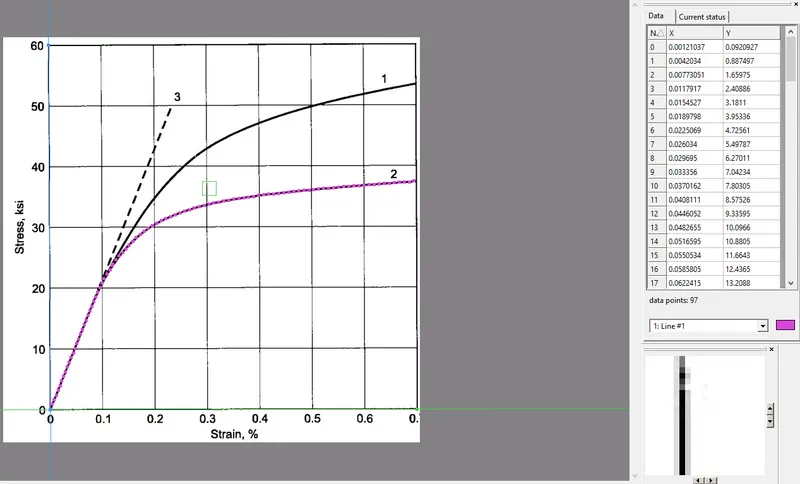
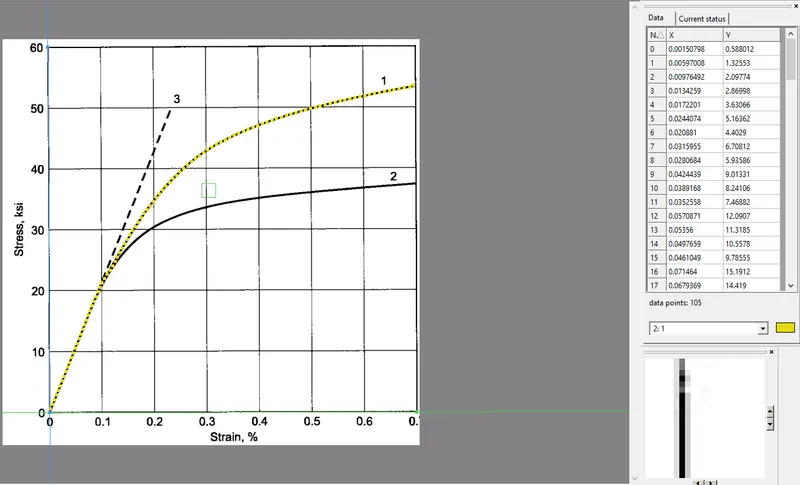
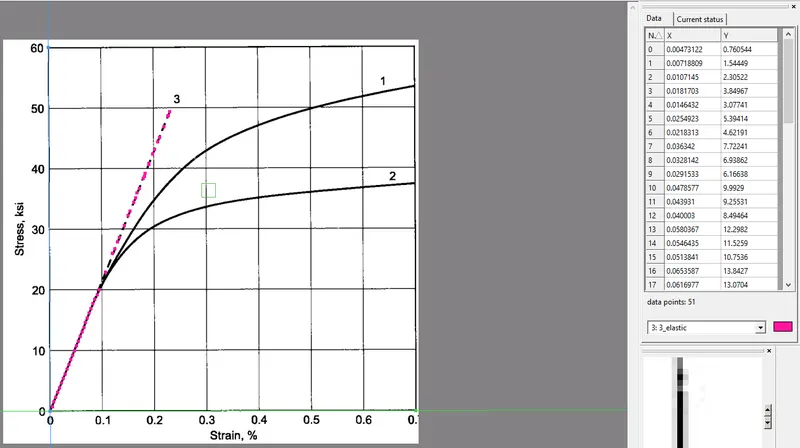
then save the data points in spreadsheet format.
- DATA CLEANUP:
It is more frequent than the data extracted from an image could always be noisy. In such cases, the data is filtered to bring about a smooth curve. This process of data filtering and cleanup is also called Curve fitting.
This process of curve fitting can either be performed using MATLAB, Excel or using the SciPy library in python. Curve fitting clears up the noise in the data by generating a curve using a mathematical equation that closely follows the data points of the curve
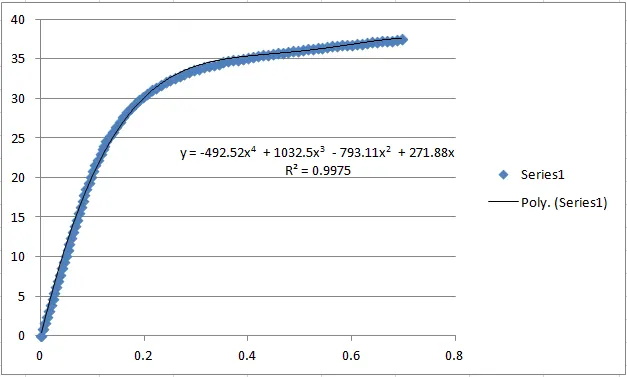
curve1: used 4 order polynomial
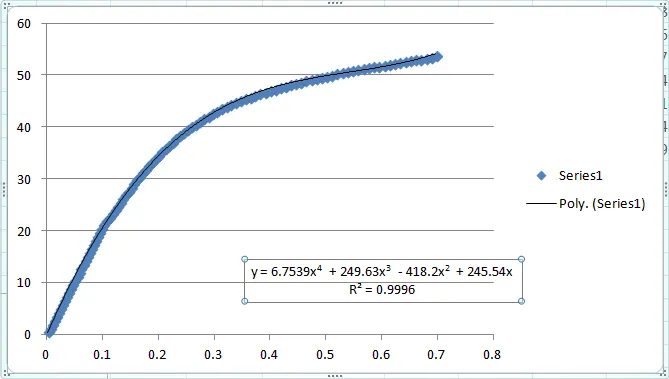
curve2: used 4 order polynomial
curve3: elastic curve-linear
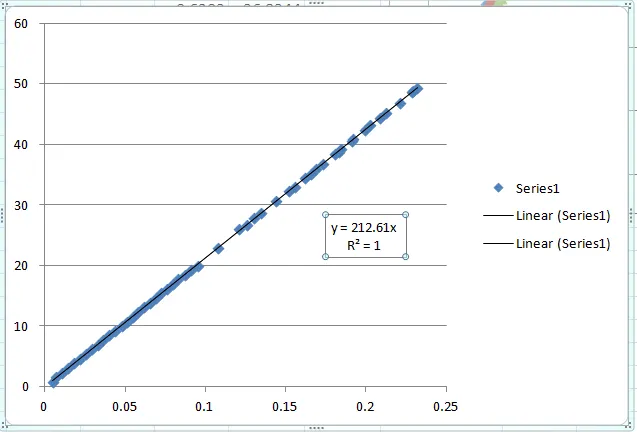
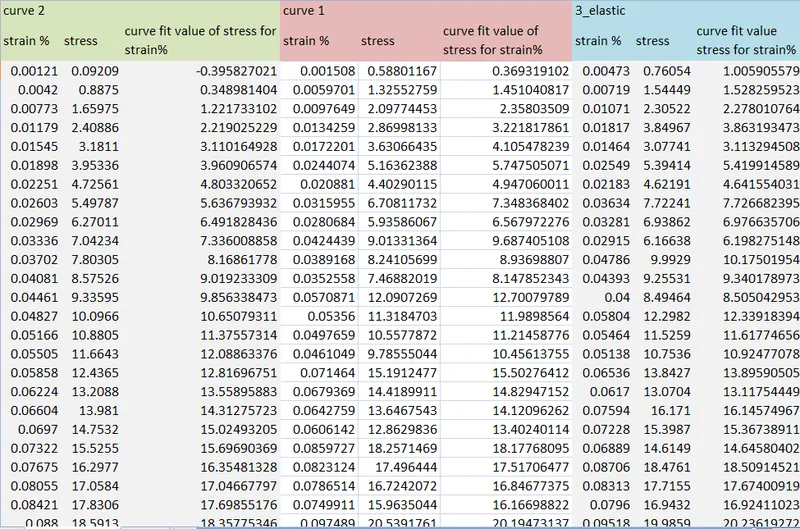
the result are more than 99% so new stress values are calculated using these equations.
-------------------------------------------------------------- -------------------------------------------------------------- -------------------------------------------------------------- --------------------------------------------------------------
- Find effective plastic strain:
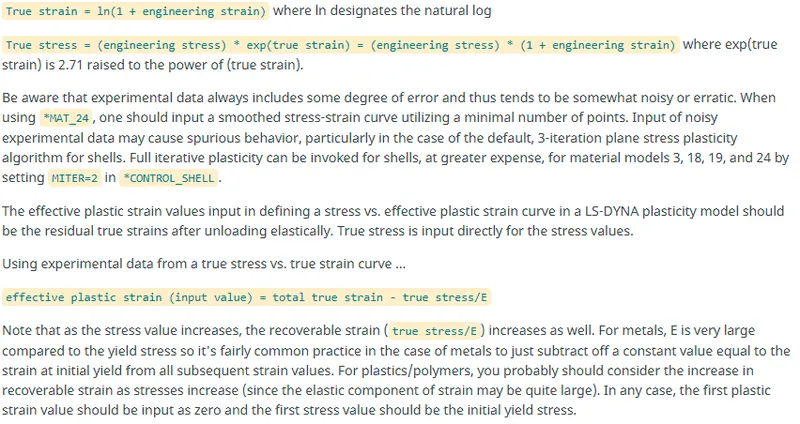
The extracted and fitted curve data now comprises only of true stress and strain however to define the curve in aMAT_024 card the curve data must contain the effective stress and effective plastic strain data.
true stress = effective stress,
true strain= (strain%)/100.
Effective plastic strain = True strain - True stress / E
where, E - Elastic modulus (GPa)
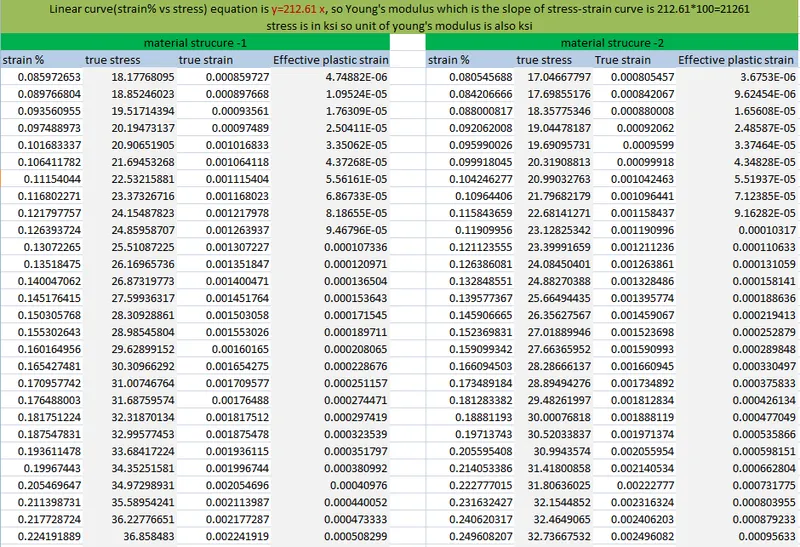
note :stress values are in ksi
-------------------------------------------------------------- -------------------------------------------------------------- --------------------------------------------------------------
- Converting to kg-mm-ms and model an elastic and a mat-24 material:
This material data now in the form of effective stress and plastic strain has to be referenced in the MAT_024 card. This can be achieved either by manually declaring each data point using LS-PrePost or using the .k/.dyn keyword file.
This is referenced under the DEFINE_CURVE card which is further referenced in the MAT_024 card along with the density, Elastic modulus, and other variable parameters.
to convert the values to other unit systems, only stress values hs to be converted while effective plastic strain remains the same.
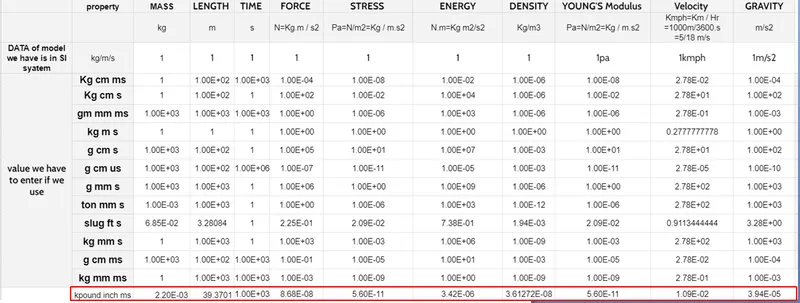
converted curve values.
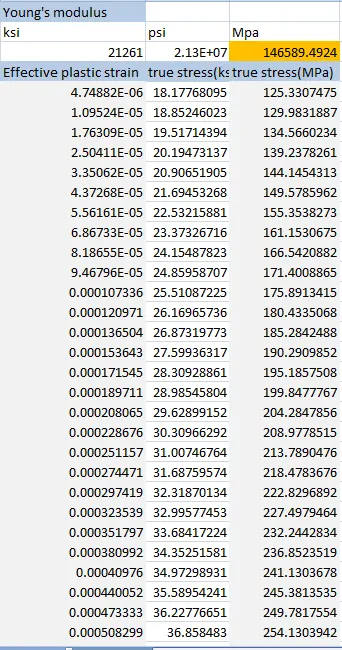
convert the stress to GPa and create the material curve
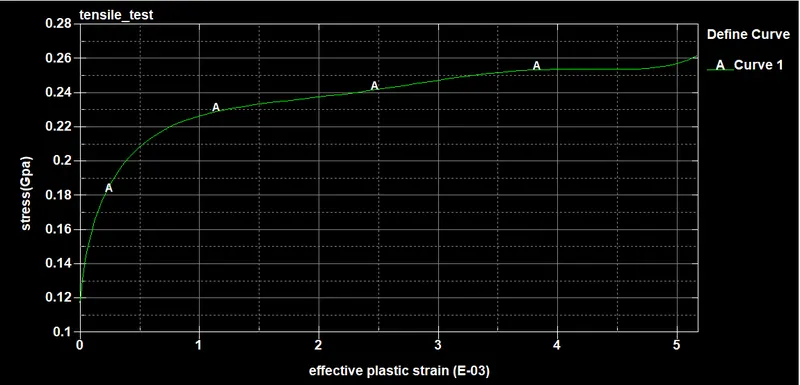
stress values are not smooth because we used 6th-degree polynomial curve fit
LS-DYNA keyword format for material definition:
1.Elastic: (highlighted value is material ID)

2.MAT24
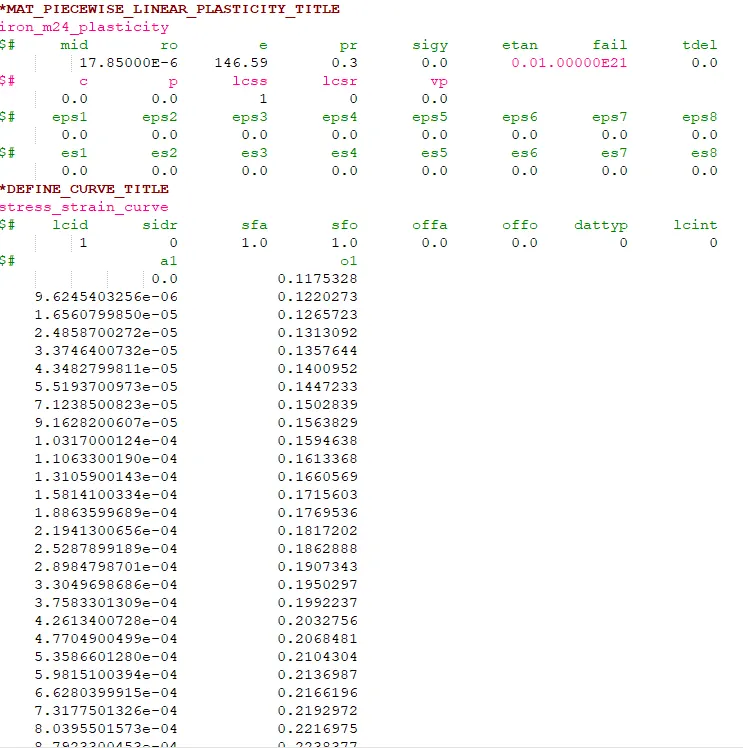
effective stress vs effective plastic strain curve:
-------------------------------------------------------------- -------------------------------------------------------------- --------------------------------------------------------------
- KEYWORD SETUP:
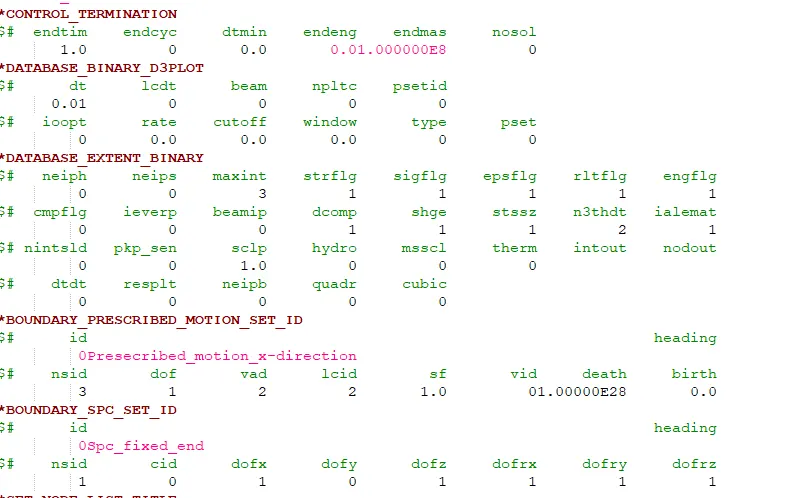
To validate the behavior of the material a tensile test simulation needs to be carried out. Hence the keyword is modeled along with other cards like *SECTION, *CONTROL_TERMINATION, BOUNDARY_SPC, displacement load, DATABASE, etc.
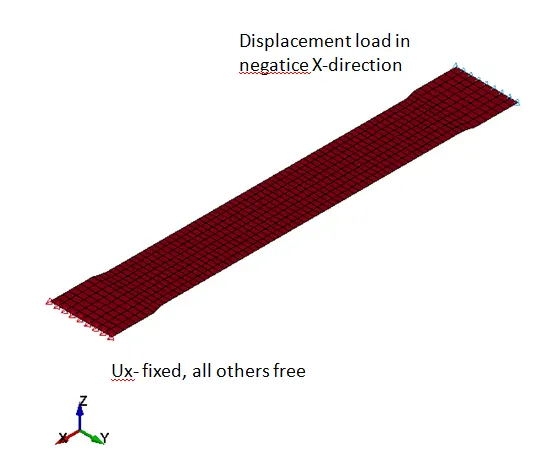

since given data is only defined for 0.7% strain we can only use 1mm displacement (total legth=145 mm so dl=0.007*145)
POST-PROCESSING:
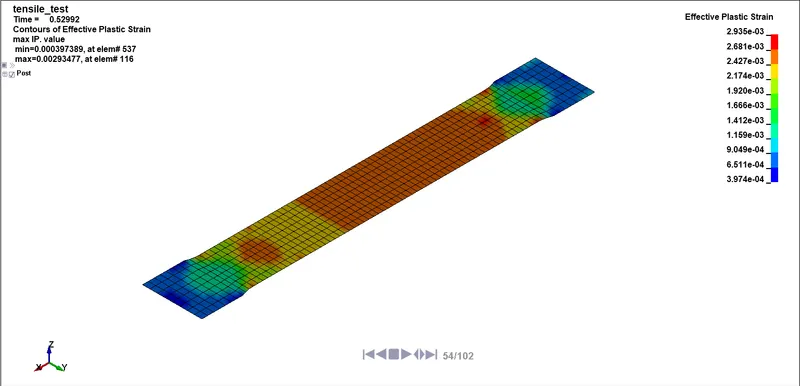
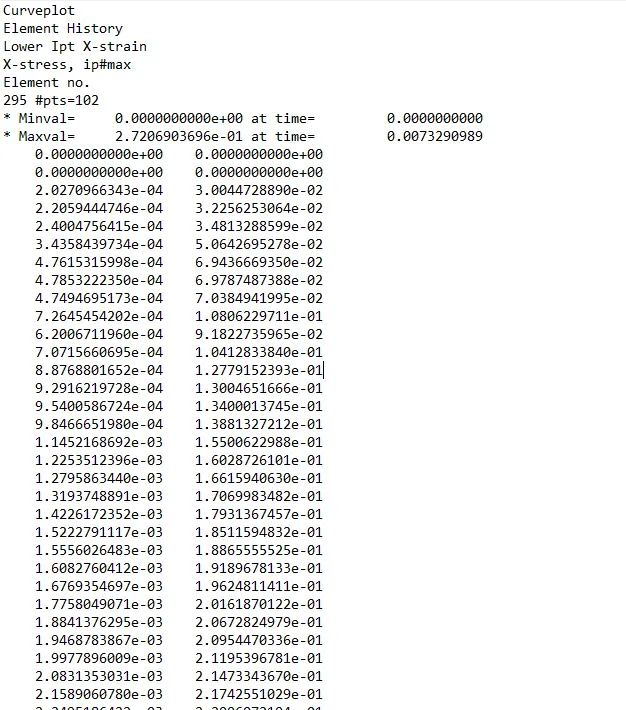
x-stress and x-strain results are plotted for element no.295 using history plot and results are saved.
XY-plot of x-stress and x-strain is plotted as shown.
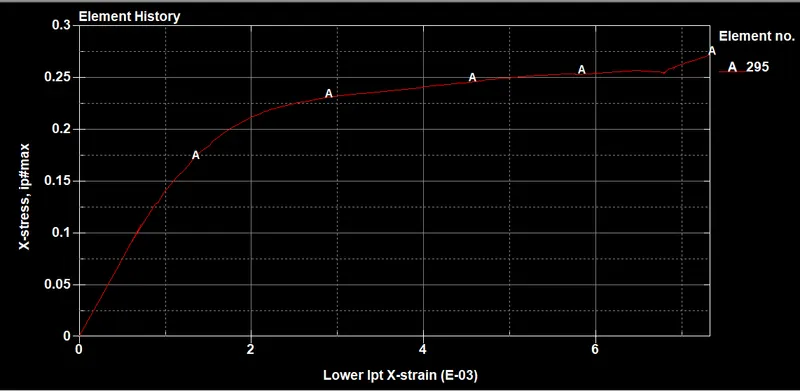
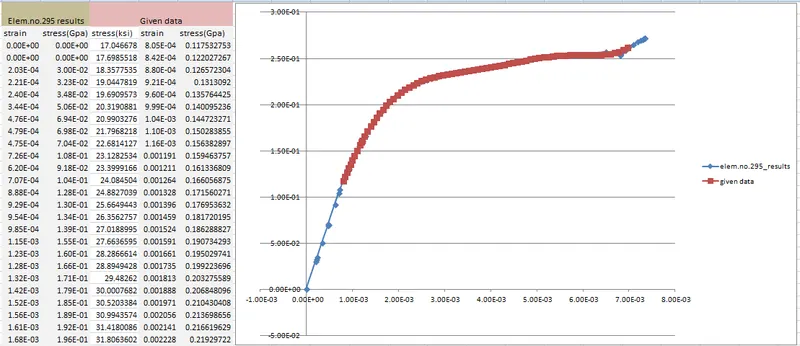
since no failure is defined, the stress-strain curve is extrapolated above 0.7% strain.
Given experimental data and element results are closely matching, so the material model is good to be used in the analysis.
CONCLUSION:
Hence we were able to model an un-defined material using its data given, errors are eliminated using curve fit and we successfully modeled it as an effective plastic strain vs stress curve that represents its stress and strain behavior during loading conditions using *MAT_024_PIECEWISE_LINEAR_PLASTICITY.
This new material model behaves as per the curve defined and the mathematical function that defines the curve. and had no issues with the solver during the process of defining it.