Material modeling from raw data
AIM
Create a MAT_24 material data from the given curve and validate it by using it in the dogbone specimen
OBJECTIVE
The data we need to input into the ls dyna will be the effectiv plastic strain vs effective stress curve.But the curve we ontained from the lab test will be of true stress vs true strain.So we need to convert this true strain into effective strain effective stress and true stress are same.SSo first we ned to find out the effective plastic strain(EPS) and effective stress(ES) value and thenwe need to convert the values into our required unit system.then we can deploy it into the ls dyna.And we can assign it to the dogbone specimen and run the tensile test on it to validate the material card we created.
PROCEDURE
First of all we are provided with the lab test data of the graphite iron casting.This is an image,so we need to pick the points from that curve.This can be done using the data digitizer.using the data digitizer we can extract the data points from the curve.These data points will be pasted in an excel file.
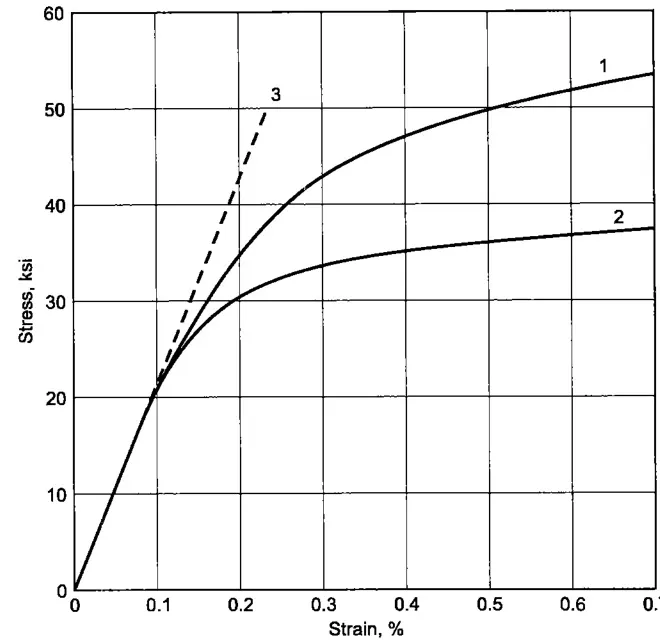
Fig 1 Material Stress vs strain
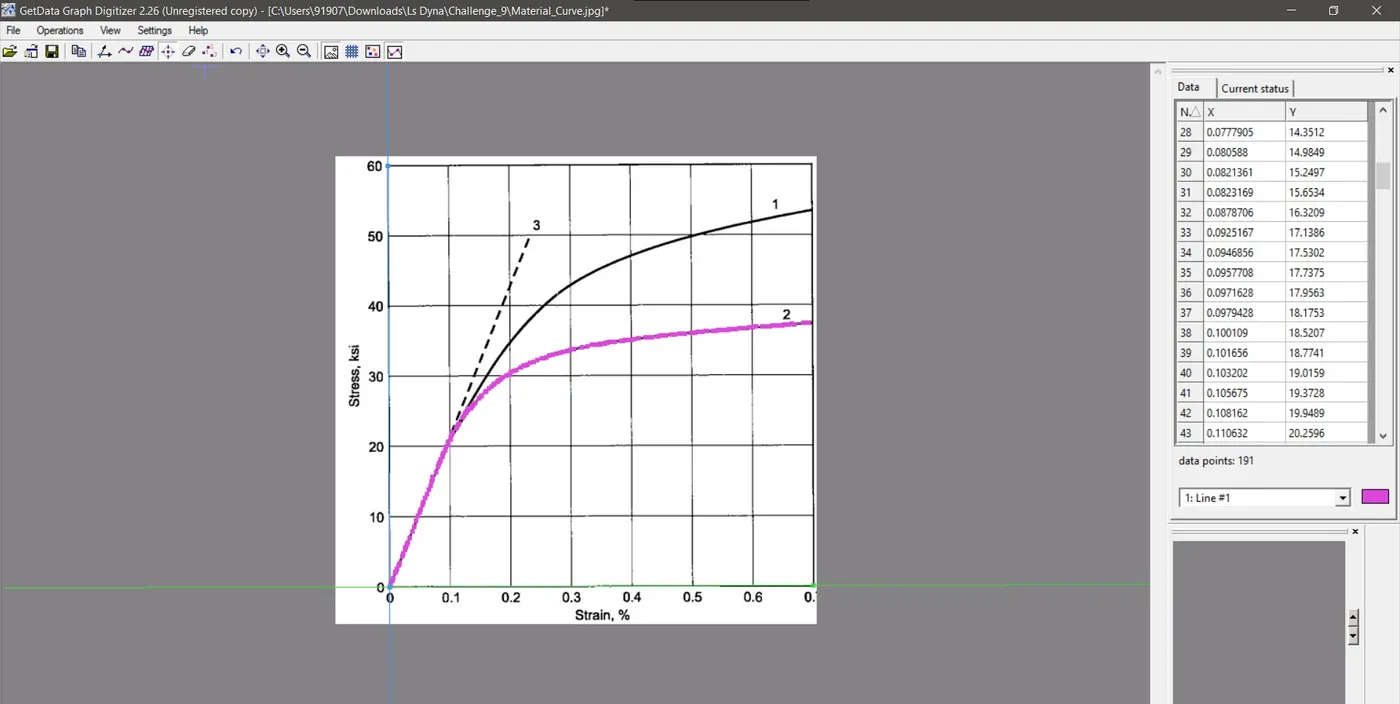
Fig 2 Extracting points using Data Digitizer
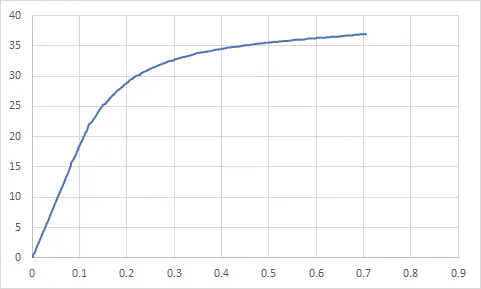
Fig 3 Stress vs Strain % curve in excel
We made a curve between the stress vs strain in excel in order to make sure that the data points are giving the exact same plot as the material curve. So the curve in excel seems to be exact copy of the material curve ,but we can see some noises in the some region.This is due to human error assosiated with the picking the points.So we need to clean up that data.Since the ls dyna will not accept th curve if the stress values cames down in between,because ls dyna will accept only the monotonically increasing curves.So we need to clean up that curve.So first we need to convert the strain % values to strain value by dividing it by 100.
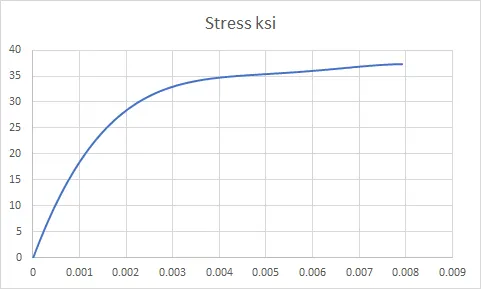
Fig 4 STRESS VS STRAIN in Excel
Then we plot the actual stress vs strain curve which is basically the true stress vs true strain of the material.So we are now equipped with the material data.At the same time we noted that the stress is basically given in kilo pound per square inch (ksi).So we need to convert that into SI unit system.The conversion factor is 1 ksi = 6.89E^6.So we need to multiply stress value with this factor so as to obtain the stress values in N/m^2 which is basically Pascal.So we can convert all the values to SI unit system.But we need to have to use the kg/mm/ms unit system.So the conversion factor from SI to kg/mm/ms for presure /stress is 10^-9.So we need to multiply all the stress values by this factor,this will gave us the effective stress in our unit system.
Now when it comes to strain,which is having no unit.So no need to have a comversion.But we are now given with the true strain.This true strain includes the strain which is recoverable which is the elastic strain.Here in Ls Dyna we need to input the effective pplastic strain vs effective stres curve.Efffective plastic curve is basically the true plastic strain in the material due to deformation.THis can be found out by reducing the elastic strain.
Elastic strain = True Stress /Elastic modulus
Total true strain = Plastic strain - recoverable strain
= True strain - True stress / E
So using these equation we need to reduce the ( trues stress /E) parameter from the true strain values to obtain the effective plastic strain.First we need to find out the elastic modulus of the material in kg/mm/ms unit system.For that we can take two points in the elastic portion of the curve.
Elastic Modulus = (19349761 - 13035494.37)/(0.00012 - 0.00008)
= 157.85 kg/mm ms^2
= 157.85/(6.85x10^6)
= 23 psi
Since this value is high and this is a metal.In metals since the Young's Modulus values will be high.So we need to reduce a constant value as true stress /E parameter to get the EPS value.This is done to simplify the calculation.here we take the value of stress in same unit systemas that of the Young's Modulus unit system.
So True Stress/E = 0.138686540/157.85
8.785 x10^-4
So we need to reduce this value from the True strain after the yield point to obtain the plastic strain values.From close examination with the data and the actual material curve we can see that the yield point of the material curve is at 0.135160807.So we need to do the above calculation in all the data points of strain after this , inorder to get EPSP.The true stresss at the plastic strain is basically effective stress itself.
So we can plot the effective stress vs effective stress plot in excel after all the calculations to find out the Effective plastic strain.
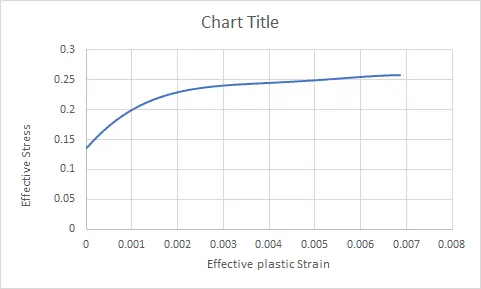
Fig 5 Effective plastic strain vbs Effective stress curve in Excel
The above curve starts from zero strain since at the point fo yield ,the true strain is equal to recoverable strain or elastic strain.Then we need to deploy these data into the LCID in define curve keyword in Ls dyna.
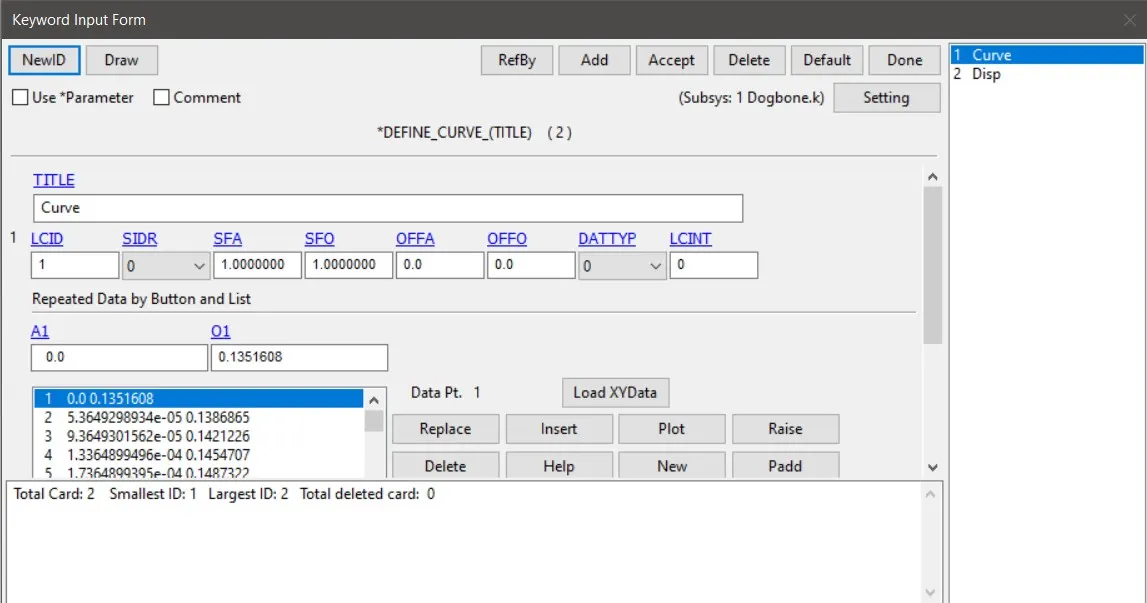
Fig 6 Loaded material data in Define Curve Card
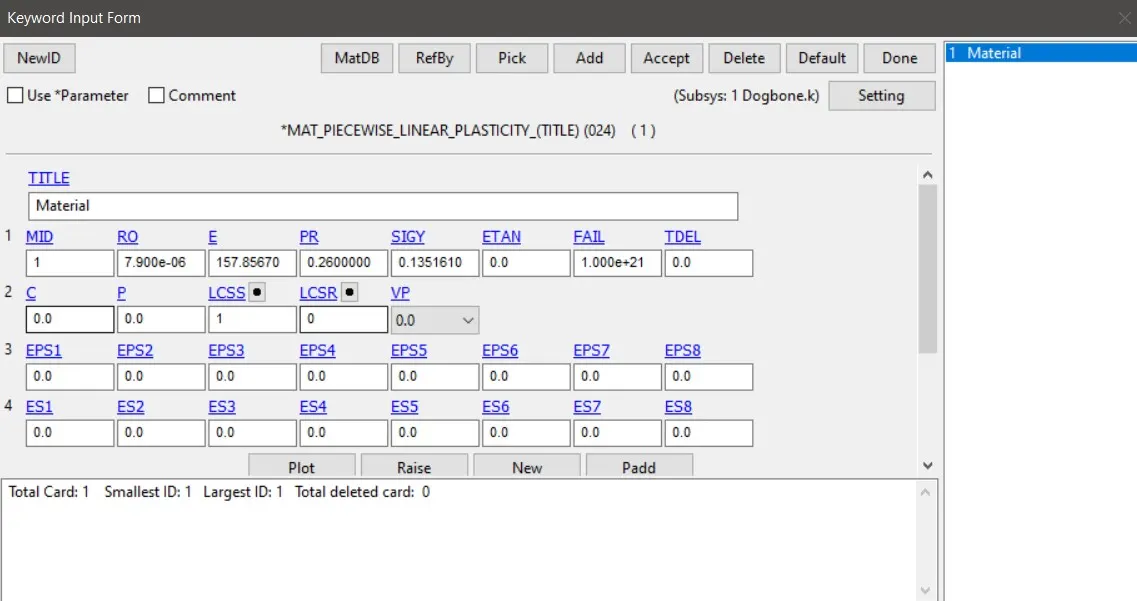
Fig 7 Material Card MAT_24
Then to replicate the real life behavuiour our contraints should beperfect.Here w need to restrict one side from moving and apply the boundry condition on the other side.Here we will be resttricting the middle node in the side which we need to restrict in all degrees of freedom.And we will be restricting all the nodes in that side in all degree of freedom except in vertical direction inorder to eliminate the abnormal behaviour due to the lateral strain happens when one end is pulled.As the application of load her we use the displacement in other side nodes.For that we define the curve for displacement and define it using the define curve keyword card.
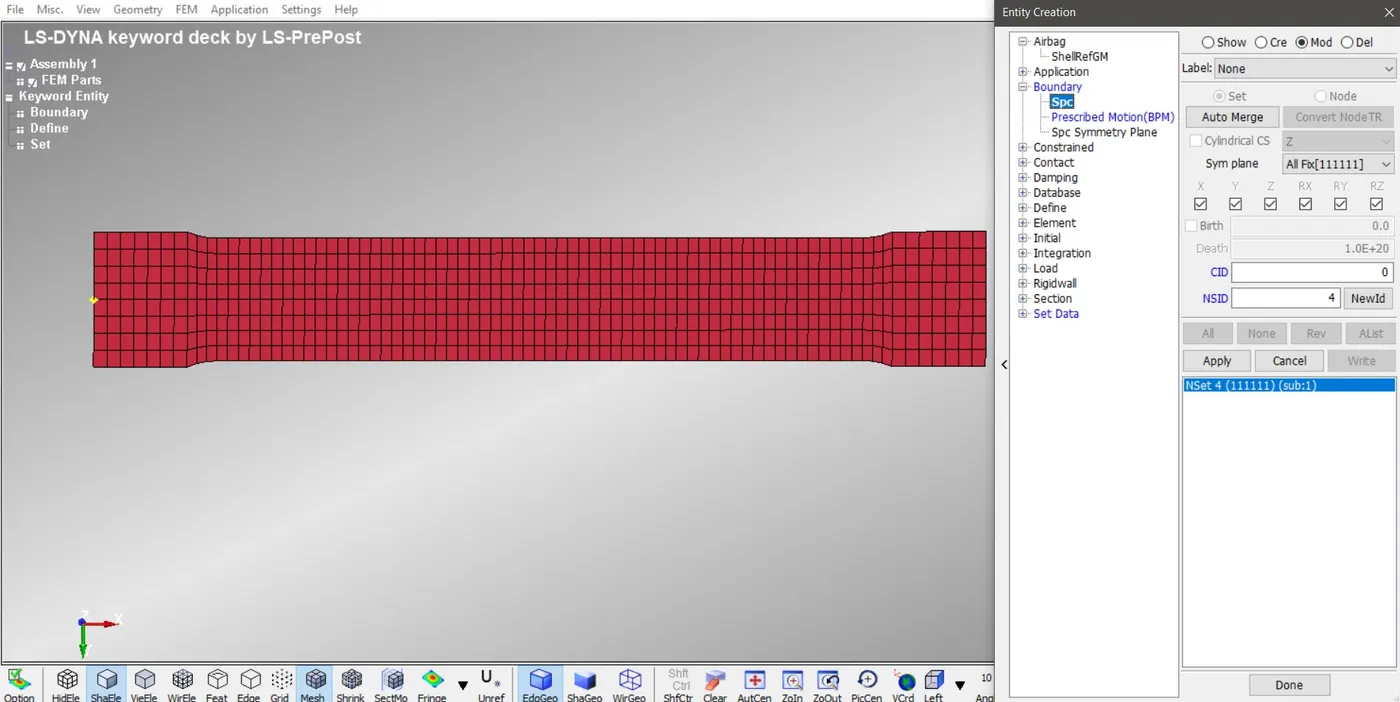
Fig 8 Middle Node SPC
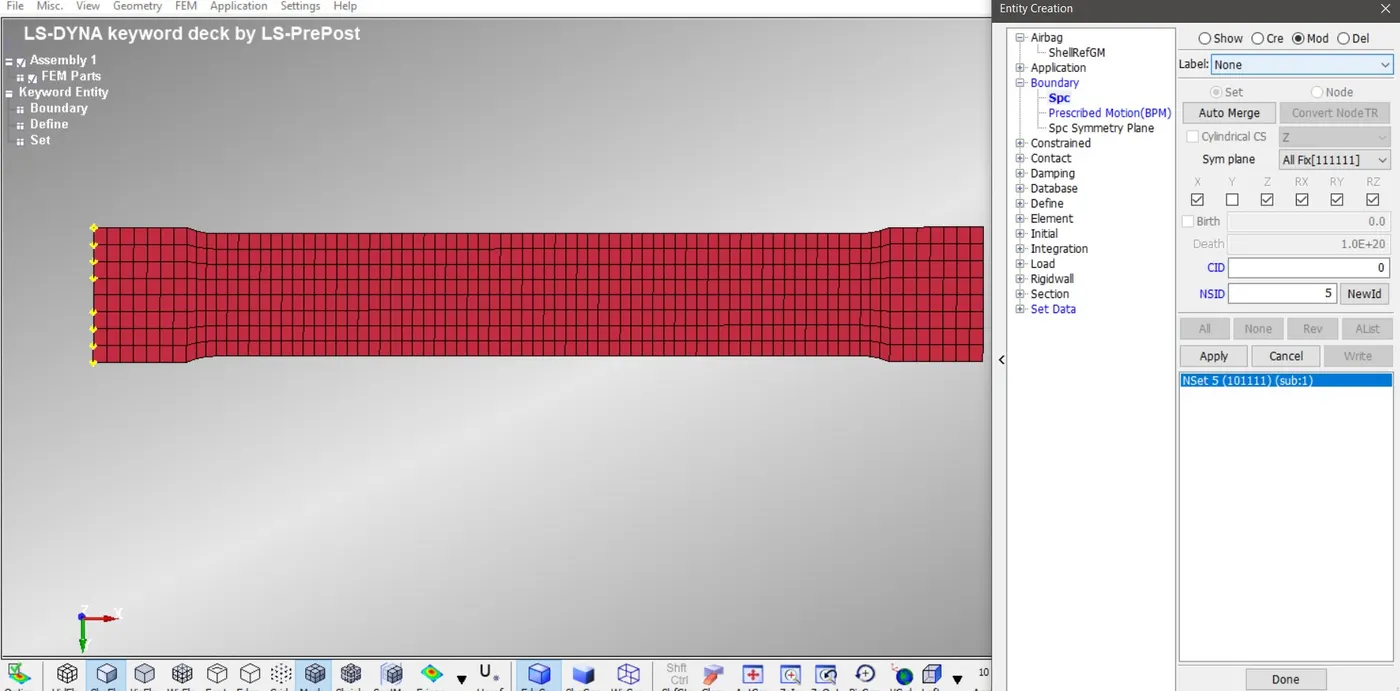
Fig 9 Others Nodes SPC
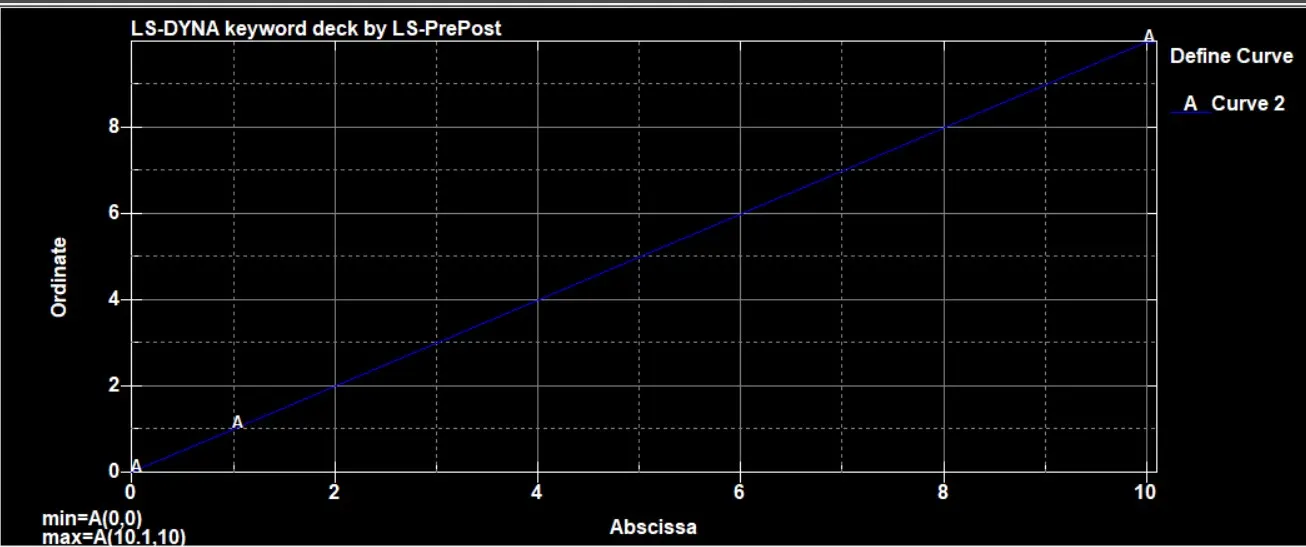
Fig 10 Displacement Curve
Inaddition to all this we need to get the simulation plot so we ned to create the database d3plot.Since we need to plot the effective plastic strain vs stress plot to validate our material curve ,we need to insert the DATABASE_EXTEBT_BINARY card in the deck and change the STRFLG to 1.Also create control termination card as usual.Now our deck preperation completed.So we can check the model using model checker inorder to ensure the deck is free of errors.
RESULTS
We will open th d3plot in LS prepost and we need to check the tensile test simulation Stress vs effective plastic strain curve.For that first we need to extract the stress vs time and effective plastic strain vs time curve using history tool.Then save those each curves ,Then by using XY plot tool we can plot the strees vs Effective plastic strain curve.And to compare ot validate the results we need to check the ultimate stress ,Elastic modulus,reduction in area etc.. Already we ensured the elastic modulus.For ensuring the other parametrs we need to plot each curve together.We will be padd that material curve along with the curve we estracter=d using XY plot tool.
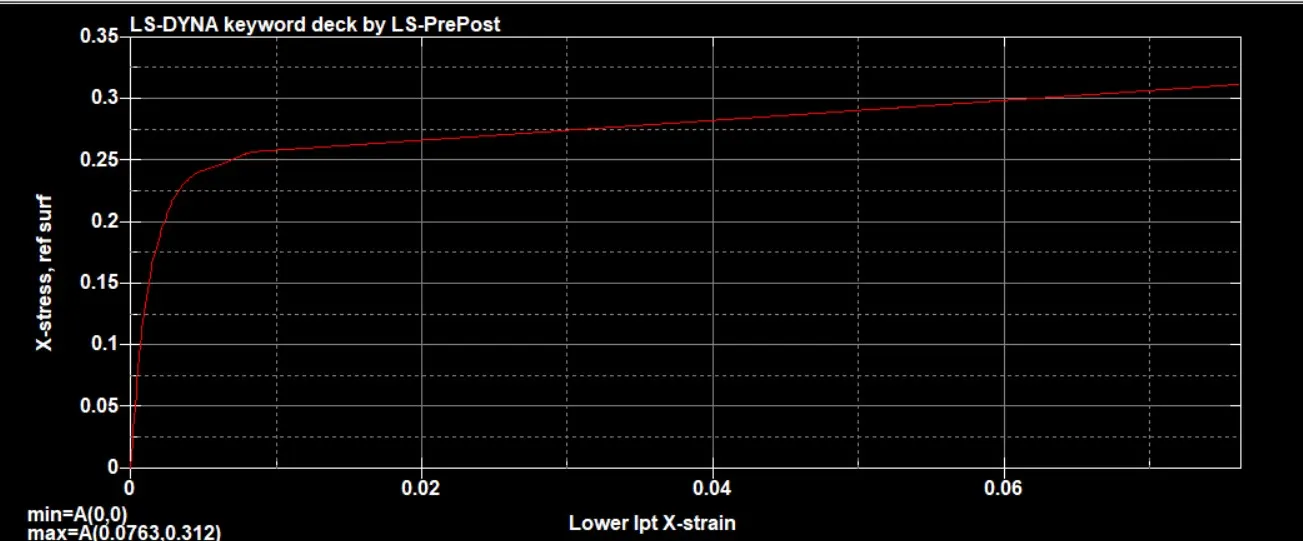
Fig 11 Stress vs strain curve from the simulation
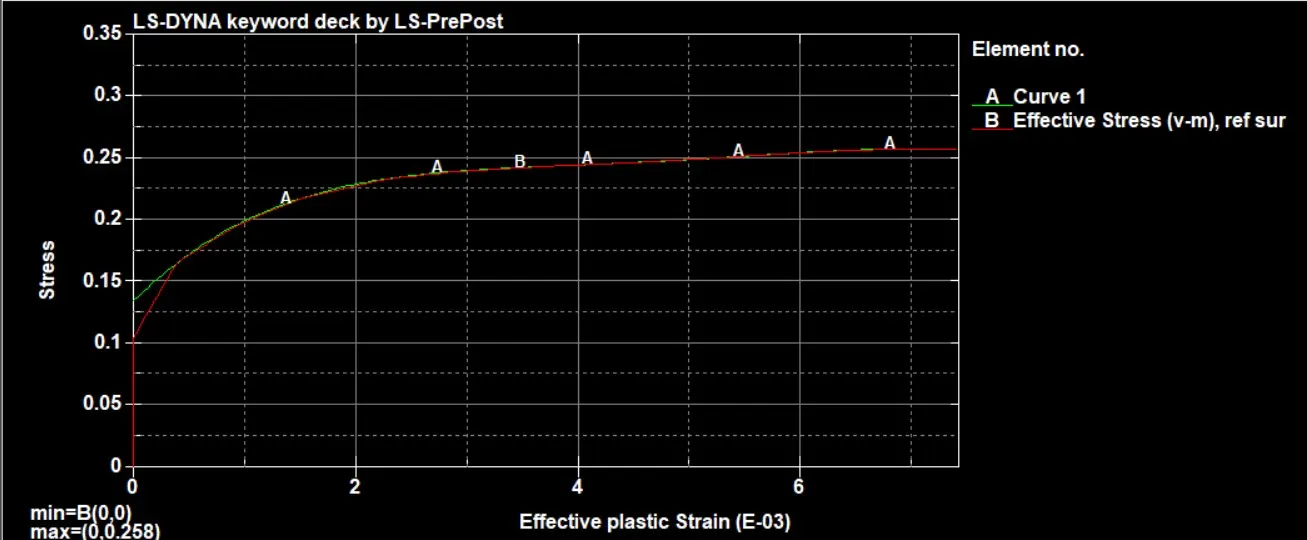
Fig 12 Plotting both the simulation curve and the material curve(Scaled within 0 to .007 strain)
We can see that the curves are matching till the last strain value.We know that the strain values are so small so the yielding may not be happening in the model.most probably the material just yields .Here there is slight mismatch at the intial values of plastic strainIt is because the polynomial function is used to fit the curve.So the values in elastic region itself will not be straight line.So the young's modulus values will be fluctuating little bit.This cause the error at the intial values of curve.But after that the pastic strain values of the simulation and the material curve coincides an matched perfectly.