Week 8 - Simulating Cyclone separator with Discrete Phase Modelling
AIM:- To perform analysis on cyclone separator and calculate the separation efficiency and pressure drop.
OBJECTIVE
- To perform analysis on Cyclone Separator and calculate separation efficiency for given cases
Case I - Size of particle = 5 um, Velocity = 1,2,3,4,5 m/s
Case II - Velocity = 3m/s, size of particles = 1,2,3,4,5 um - Explain different models used to determine the efficiency of cyclone separator in brief
THEORY
Cyclone Separator
Cyclone separators are separation devices that use the principle of inertia to remove particulate matter from flue gases. Cyclone separators is one of many air pollution control devices known as pre-cleaners since they generally remove larger pieces of particulate matter. This prevents finer filtration methods from having to deal with large, more abrasive particles later on.
The size of the cyclone depends largely on how much flue gas must be filtered, thus larger operations tend to need larger cyclones. For example, several different models of one cyclone type can exist, and the sizes can range from a relatively small 1.2-1.5 m tall (about 4-5 feet) to around 9 meters (30 feet)—which is about as tall as a three-story building.
Working of Cyclone Separator
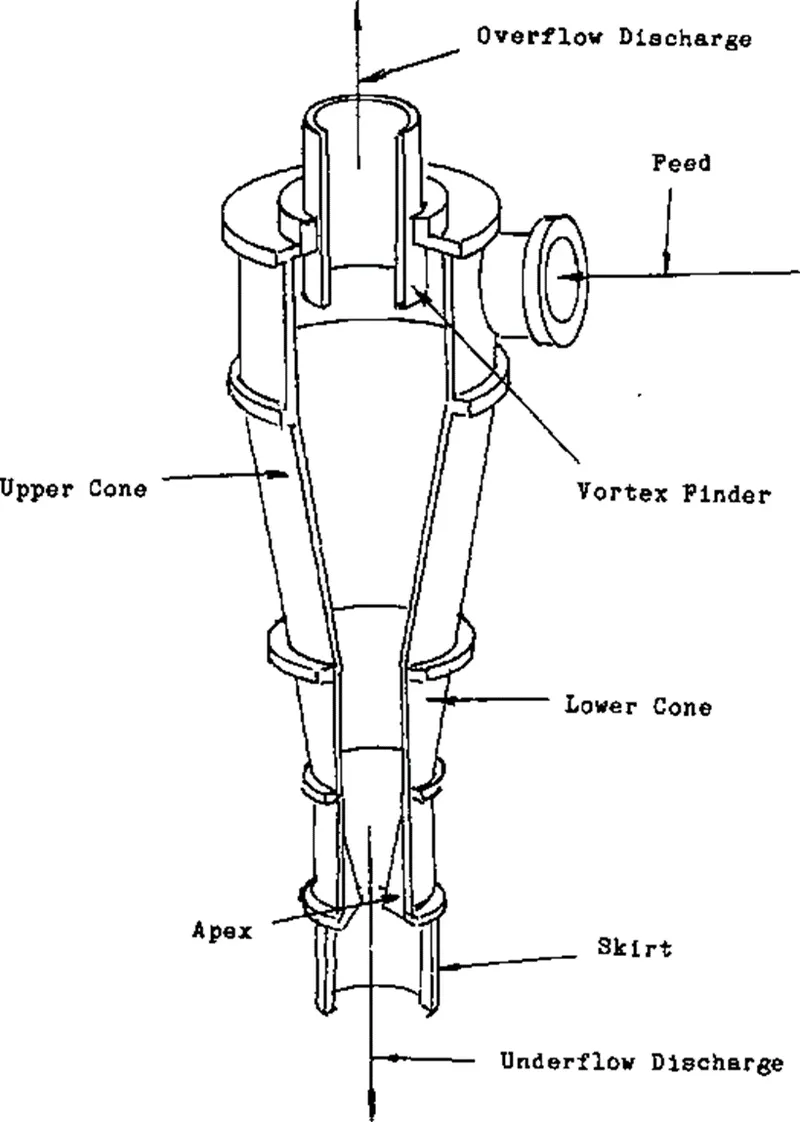
cyclone separators work much like a centrifuge, but with a continuous feed of dirty air. In a cyclone separator, dirty flue gas is fed into a chamber. The inside of the chamber creates a spiral vortex, similar to a tornado. The lighter components of this gas have less inertia, so it is easier for them to be influenced by the vortex and travel up it. Contrarily, larger components of particulate matter have more inertia and are not as easily influenced by the vortex.
Since these larger particles have difficulty following the high-speed spiral motion of the gas and the vortex, the particles hit the inside walls of the container and drop down into a collection hopper. These chambers are shaped like an upside-down cone to promote the collection of these particles at the bottom of the container. The cleaned flue gas escapes out the top of the chamber. Most cyclones are built to control and remove particulate matter that is larger than 10 micrometers in diameter. However, there do exist high-efficiency cyclones that are designed to be effective on particles as small as 2.5 micrometers. As well, these separators are not effective on extremely large particulate matter. For particulates around 200 micrometers in size, gravity settling chambers or momentum separators are a better option.
Model 1: Iozia and Leith Model
Iozia and Leith (1990) logistic model is a modified version of Barth (1956) model which is developed based on force balance. The model assumes that a particle carried by the vortex endures the influence of two forces: a centrifugal force, Z, and flow resistance, W. Core length, zc, and core diameter, dc are given as:
β is an expression for slope parameter derived based on the
statistical analysis of experimental data of a cyclone with D = 170
0.25 m given as:
and dpc is the 50% cut size given by Barth:
where core length, zc, and core diameter, dc, are given as
Model 2: Li and Wang Model
The Li and Wang [3] model includes particle bounce or re-entrainment and turbulent diffusion at the cyclone wall. A two-dimensional analytical expression of particle distribution in the cyclone is obtained. Li and Wang model was developed based on the following assumptions:
- The radial particle velocity and the radial concentration
- The profile is not constant for uncollected particles within the cyclone.
Boundary conditions with the consideration of turbulent diffusion coefficient and particle bounce entrainment on the cyclone wall are:
Model 3: Koch and Licht Model
Koch and Licht collection theory recognized the inherently turbulent nature of cyclones and the distribution of gas residence times within the cyclone. Koch and Licht described particle motion in the entry and collection regions with the additional following assumptions:
- The tangential velocity of a particle is equal to the tangential velocity of the gas flow, i.e. there is no slip in the tangential direction between the particle and the gas.
- The tangential velocity is related to the radius of the cyclone by u Rn = constant.
A force balance and an equation on the particles collection yields
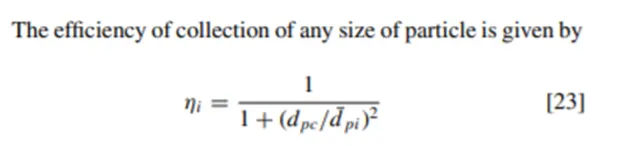
the grade efficiency ηi:
Model 4: Lapple Model
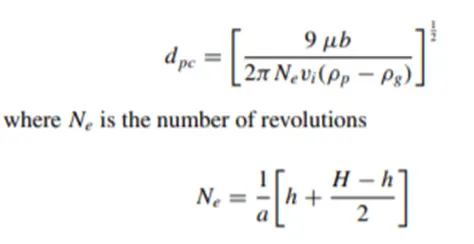
Lapple model was developed based on force balance without considering the flow resistance. Lapple assumed that a particle entering the cyclone is evenly distributed across the inlet opening. The particle that travels from inlet half-width to the wall in the cyclone is collected with 50% efficiency. The semi-empirical relationship developed by Lapple [1] to calculate a 50% cut diameter, dpc is:
Geometry:
The geometry of Cyclone Separator is imported in to the SpaceClaim as shown below
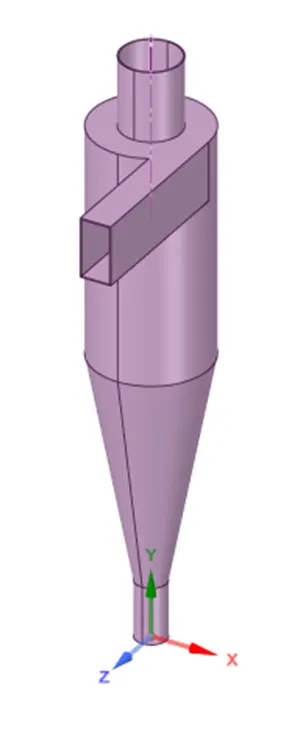
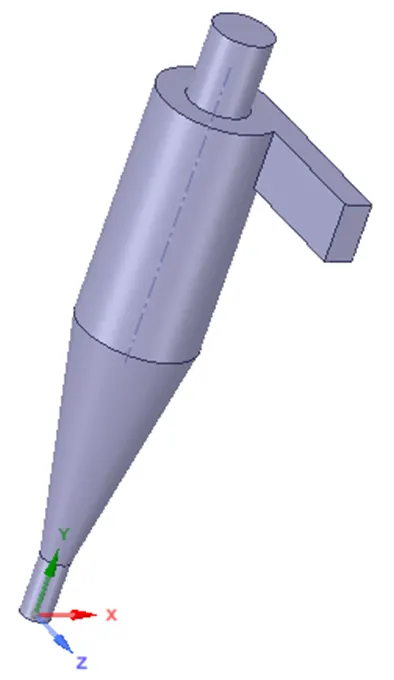
We need to extract the fluid volume by selecting the inlet and outlet edges to obtain the below geometry 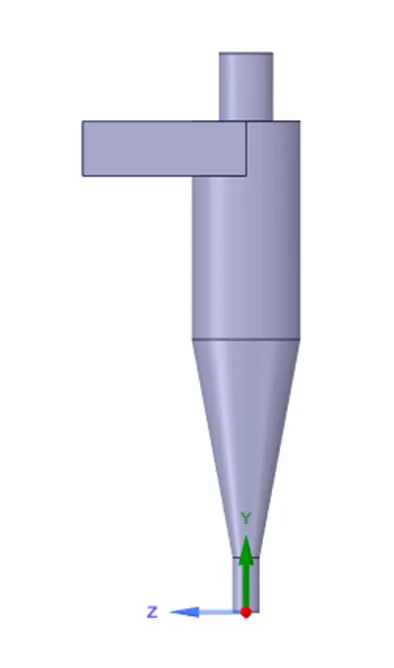
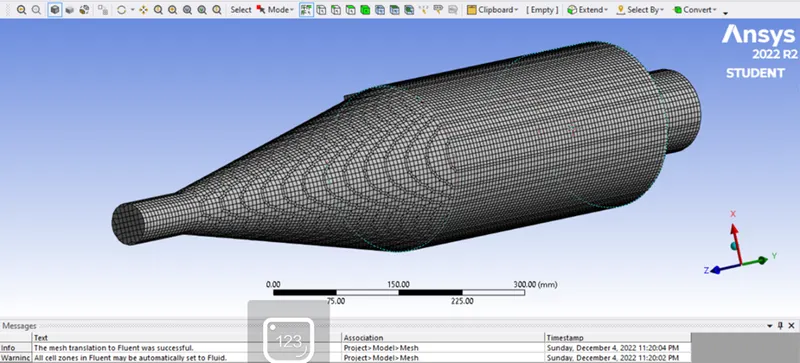
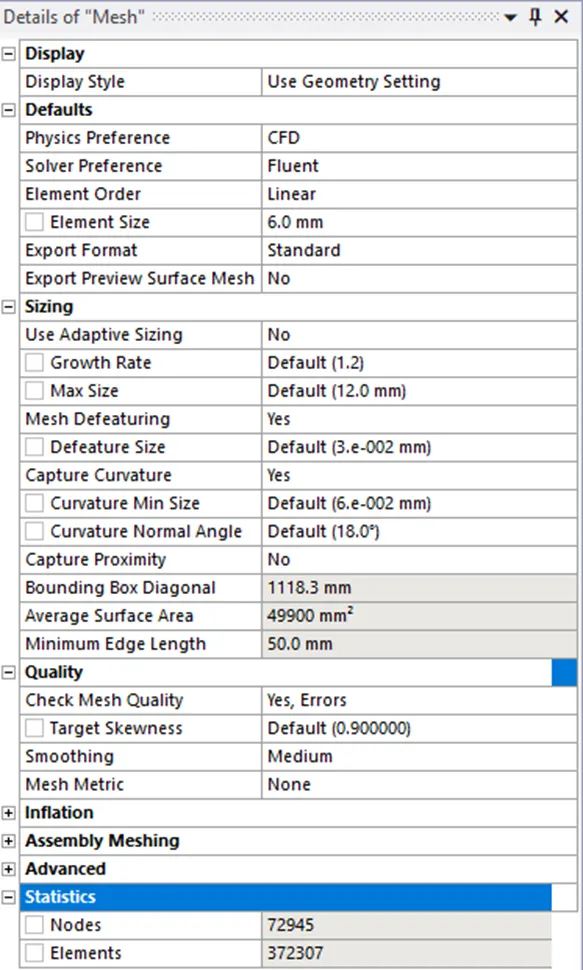
Step 2 - Meshing:
Fluent Setup:
Solver: Steady State solver
Type: Pressure based
Model: k-epsilon RNG, Swril dominated flow, Standard wall function
Injections:
Type - Surface injection
Material type - Antracite
X-velocity - 3m/s
Diameter - varying from 1e-6 to 5e-6
Flow rate - 1e-20 kg/s
Performance analysis on a given cyclone separator model by varying the particle diameter from 1 μm to 5 μm
Case 1: Particle diameter = 1 μm 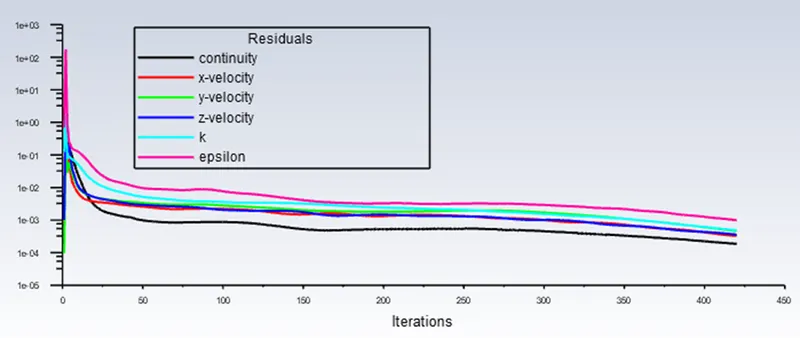
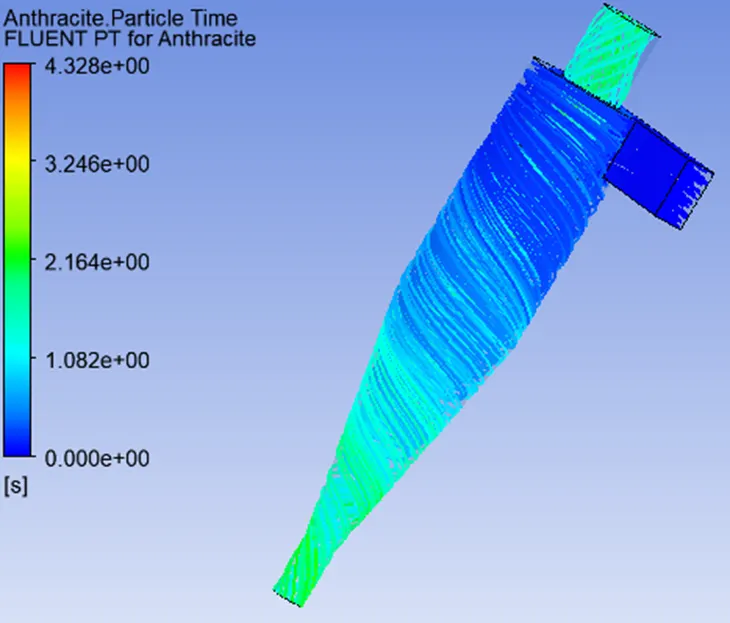
Separation Efficiency = 215/465 = 46.23 %
Pressure contour & Pressure drop
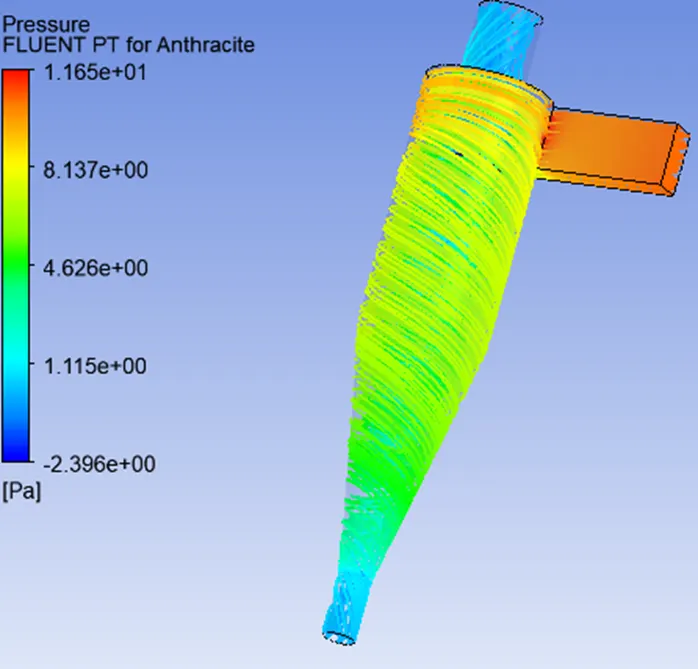
Max Pressure = 11.65 pa, Min Pressure = -2.396 Pa
Pressure Difference = 14.046 Pa
2.v=3 m/s, d=2e-6 m
Residual
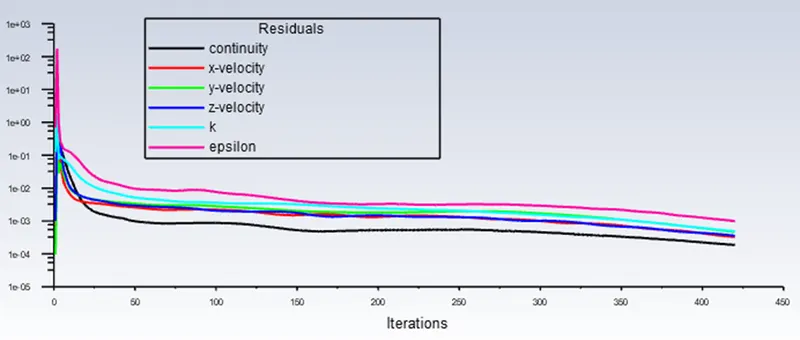
Particle Resident Time & Separation Efficiency
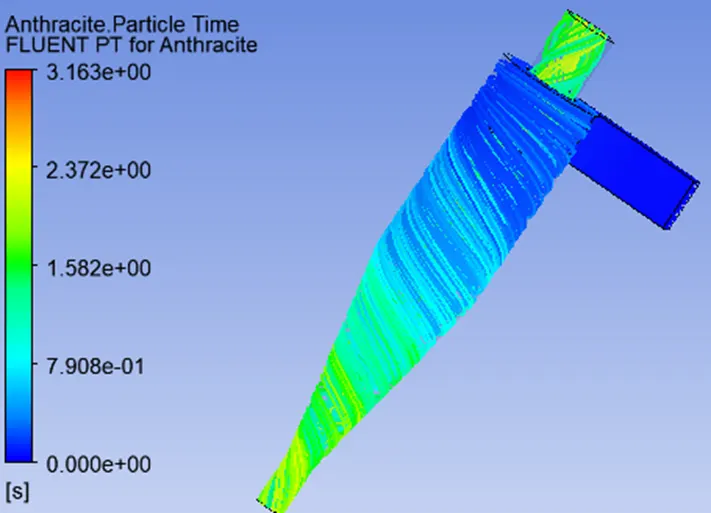
Seperation Efficiencey = (Trapped/Tracked)*100 = 50.75%
Pressure contour & Pressure drop
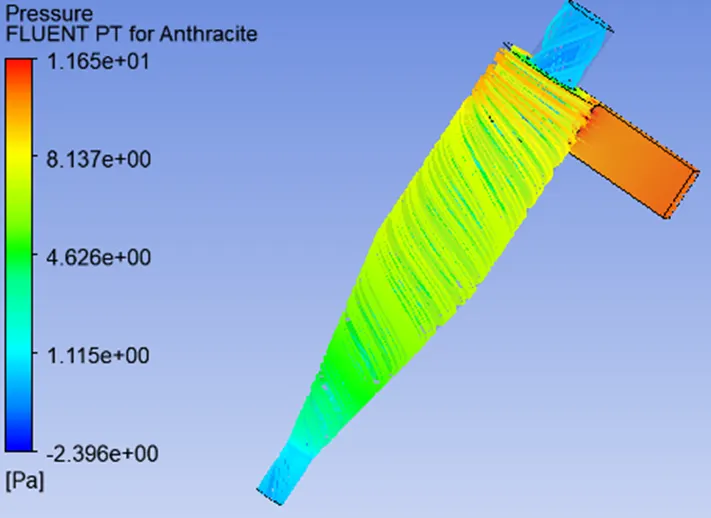
- Max Pressure = 11.65 pa, Min Pressure = -2.396 Pa
Pressure Difference = 14.046 Pa
v=3 m/s, d=3e-6 m
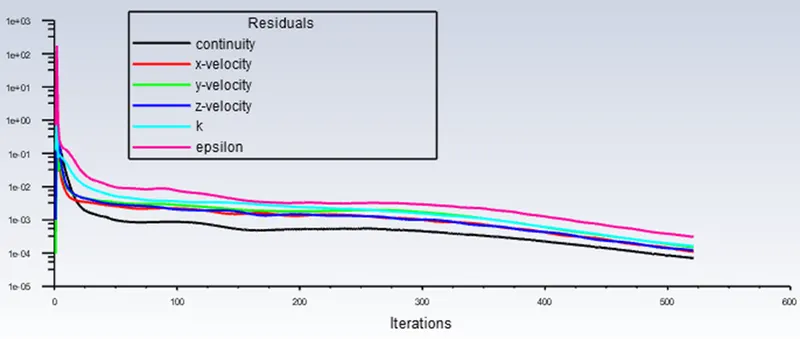
Residual
Particle Resident Time & Separation Efficiency
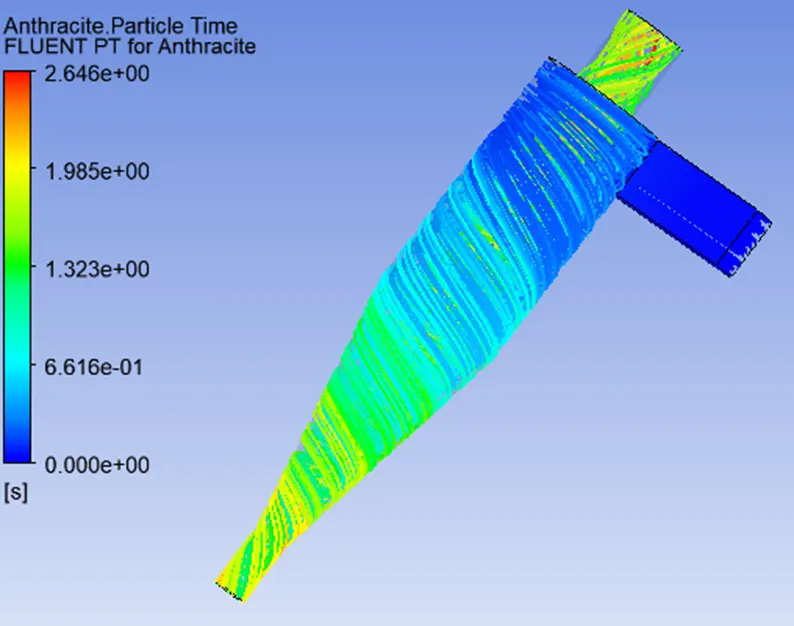 Seperation Efficiencey = (Trapped/Tracked)*100 = 55.48%
Pressure contour & Pressure drop
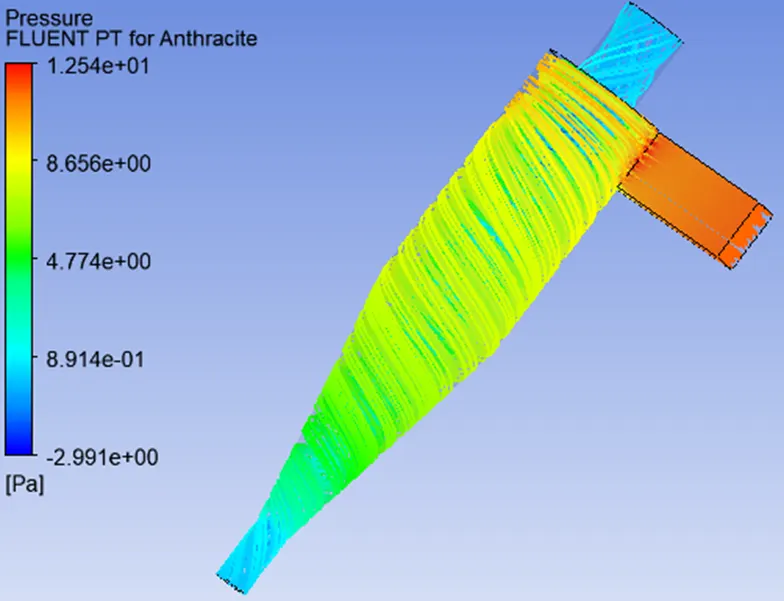
- Max Pressure = 12.54 pa, Min Pressure = -2.991 Pa
Pressure Difference = 15.531 Pa
v=3 m/s, d=3e-6 m
Residual
Particle Resident Time & Separation Efficiency
Seperation Efficiencey = (Trapped/Tracked)*100 = 55.48%
Pressure contour & Pressure drop
- Max Pressure = 12.54 pa, Min Pressure = -2.991 Pa
Pressure Difference = 15.531 Pa
v=3 m/s, d=4e-6 m
Residual
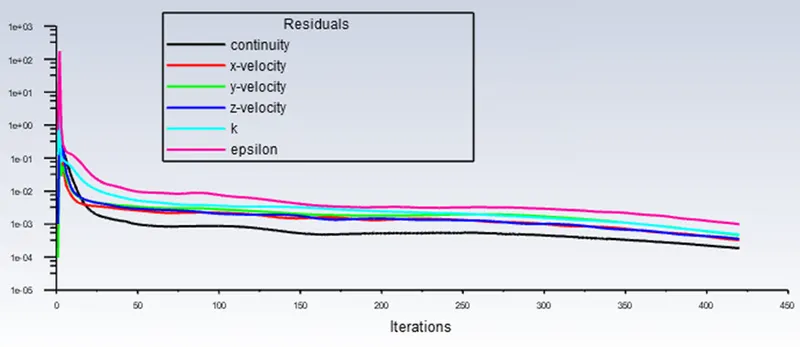
Particle Resident Time & Separation Efficiency
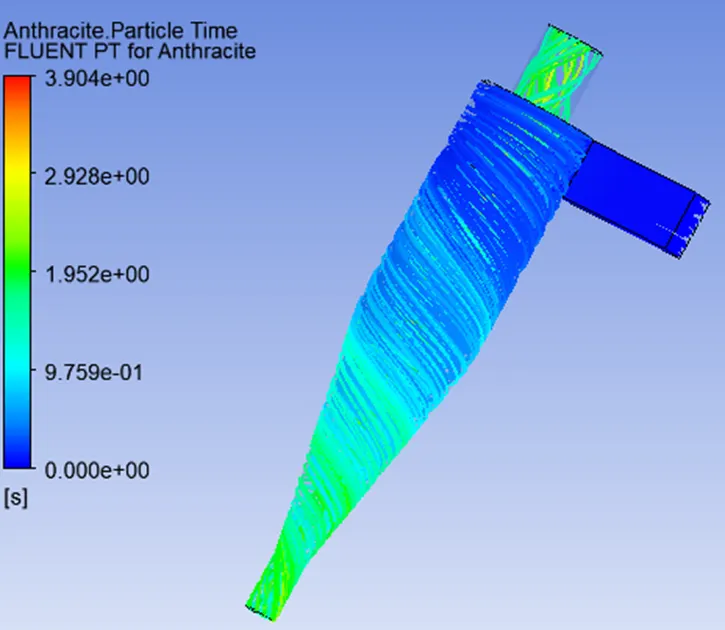
Seperation Efficiencey = (Trapped/Tracked)*100 = 61.5%
Pressure contour & Pressure drop
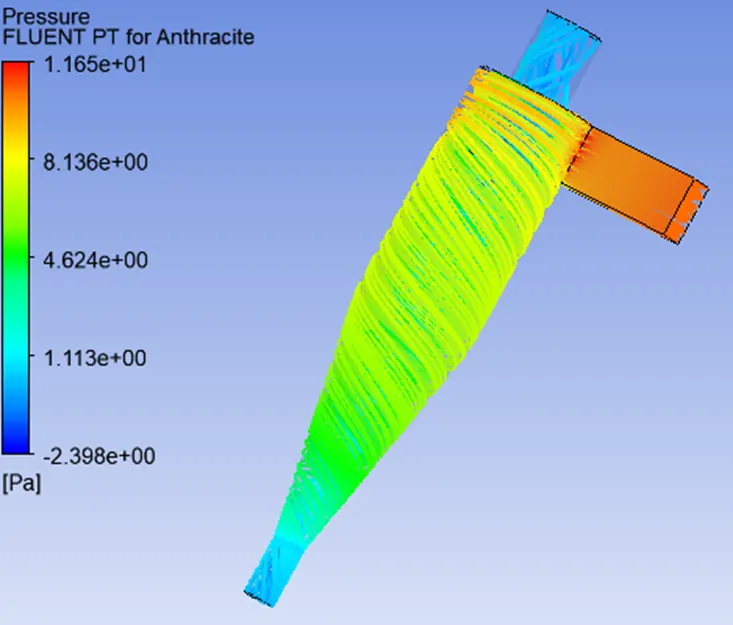
- Max Pressure = 11.65 pa, Min Pressure = -2.398 Pa
Pressure difference = 14.048 Pa
v=3 m/s, d=5e-6 m
Residual
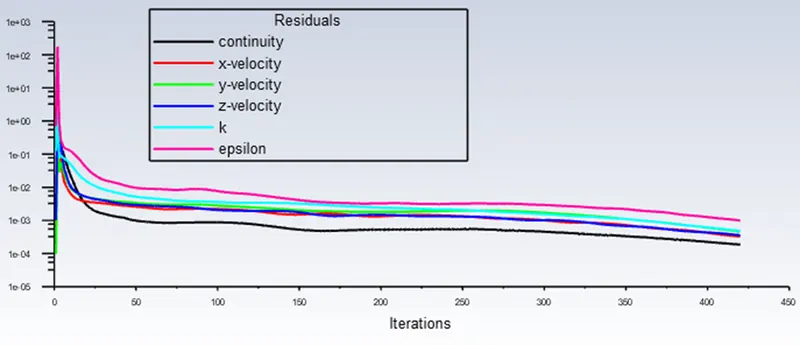
Particle Resident Time & Separation Efficiency
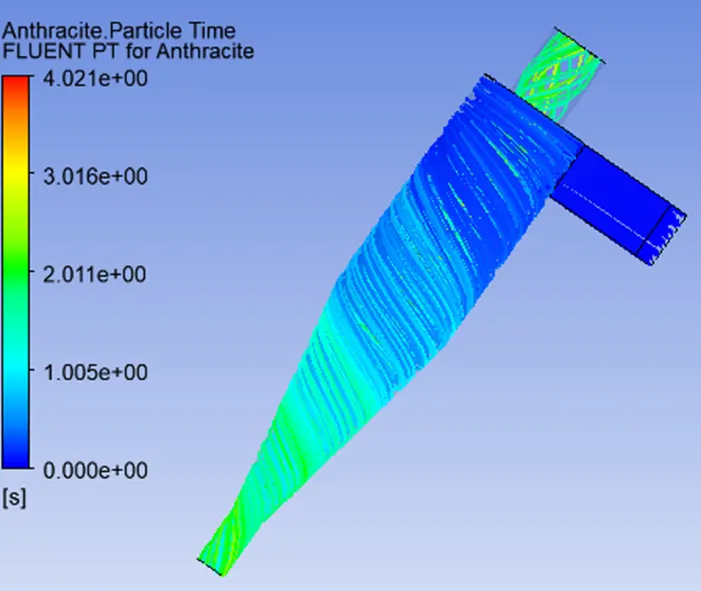
Seperation Efficiencey = (Trapped/Tracked)*100 = 70.32 %
Pressure contour & Pressure drop
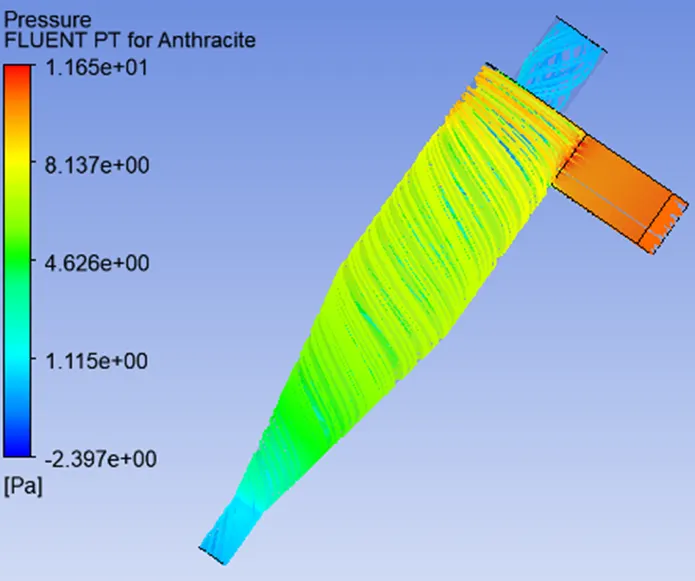
- Max Pressure = 11.65 pa, Min Pressure = -2.397 Pa
Pressure difference = 14.047 Pa -
Case 1
Size of Particles (m)
Velocity of particles (m/s
No of the particles tracked
No of the particles escaped
No of the particle trapped
No of the particles incomplete
separation efficiency (%)
Pressure difference (Pa)
1
1e5
3
465
239
215
11
46.23
14.046
2
2e5
3
465
229
236
0
50.75
14.046
3
3e5
3
465
207
258
0
55.48
14.046
4
4e5
3
465
179
286
0
61.5
14.048
5
5e5
3
465
138
327
0
70.32
14.047
CASE 2
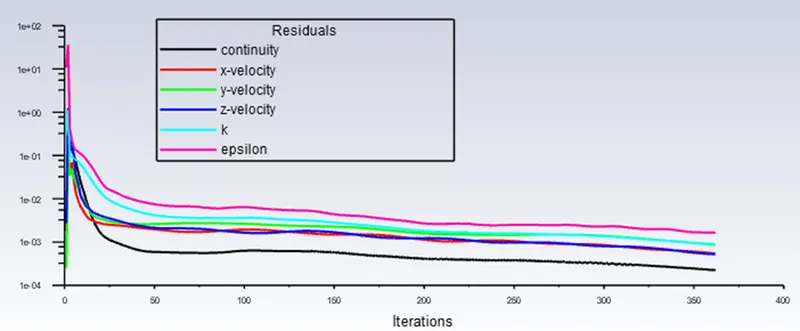
v=1 m/s, d=5e-6 m
Residual
- Particle Resident Time & Separation Efficiency
Seperation Efficiencey = (Trapped/Tracked)*100 = 24.086 %
Pressure contour & Pressure drop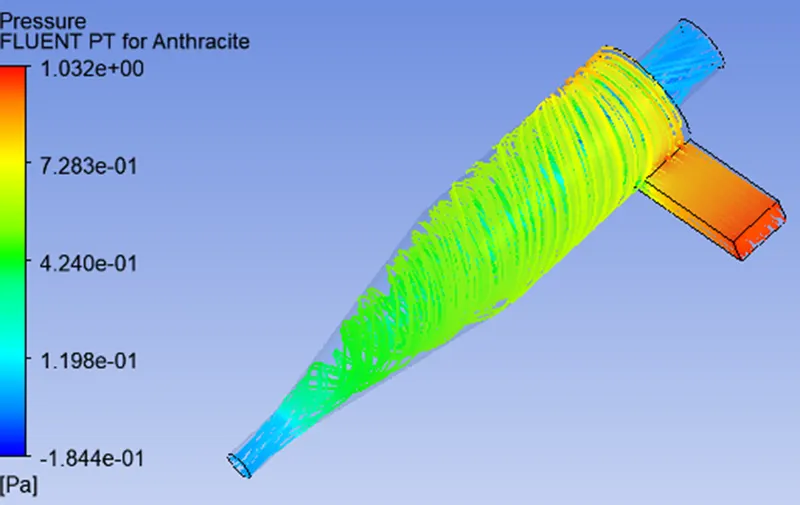
-
- Max Pressure = 1.032 pa, Min Pressure = -1.844 Pa
Pressure difference = 2.876 Pa
Residual
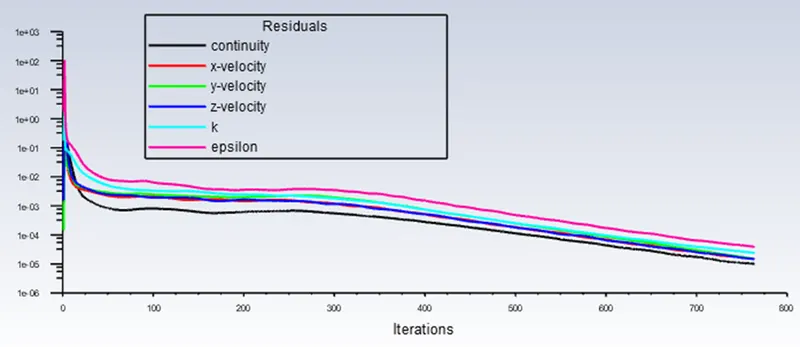
- Max Pressure = 1.032 pa, Min Pressure = -1.844 Pa
- Particle Resident Time & Separation Efficiency
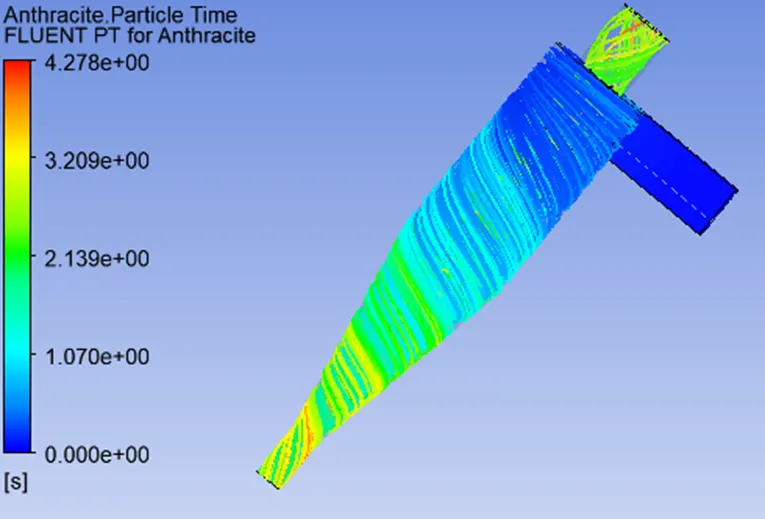
Seperation Efficiencey = (Trapped/Tracked)*100 = 62.79 %
Pressure contour & Pressure drop
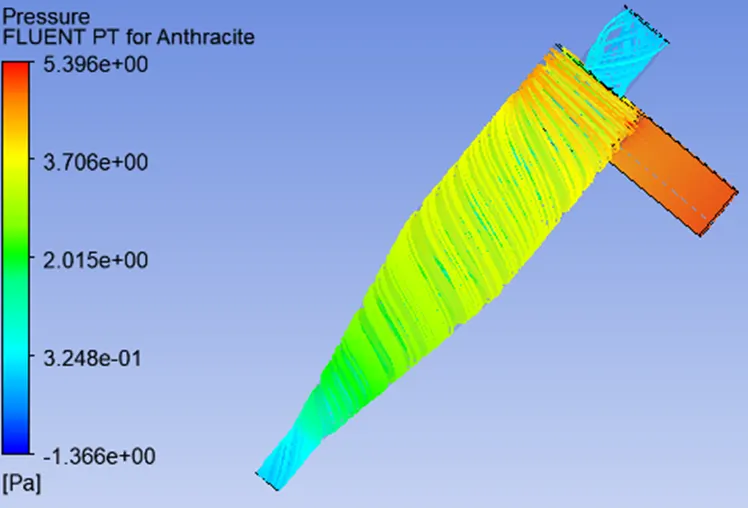
- Max Pressure = 5.396 pa, Min Pressure = -1.366 Pa
Pressure difference = 6.762 Pa
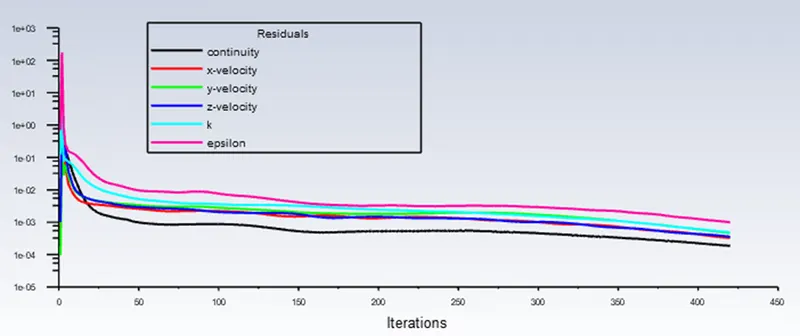
v=3 m/s, d=5e-6 m
Residual
Particle Resident Time & Separation Efficiency
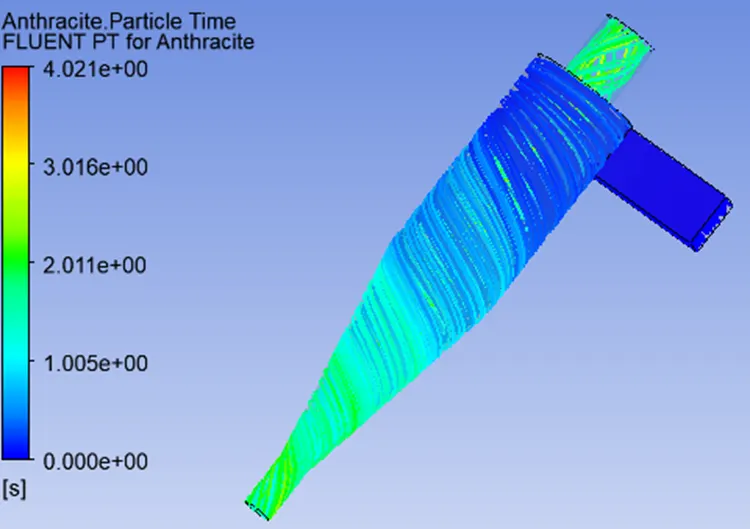
Seperation Efficiencey = (Trapped/Tracked)*100 = 70.32 %
Pressure contour & Pressure drop
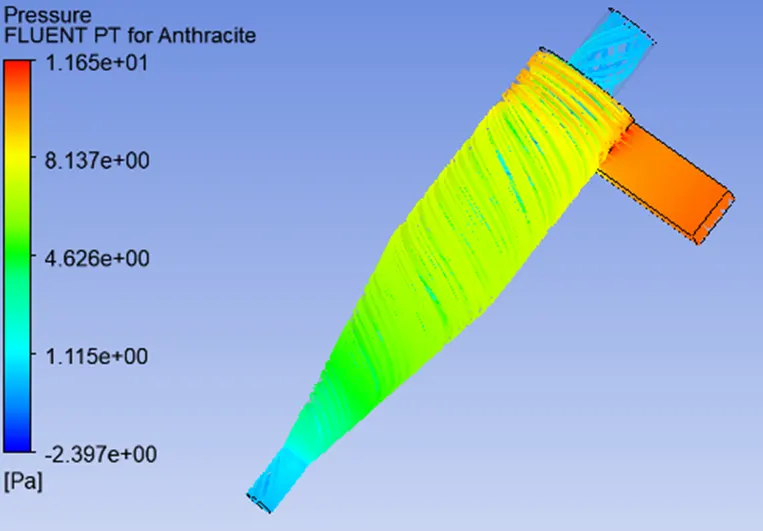
- Max Pressure = 11.65 pa, Min Pressure = -2.397 Pa
Pressure difference = 14.047 Pa
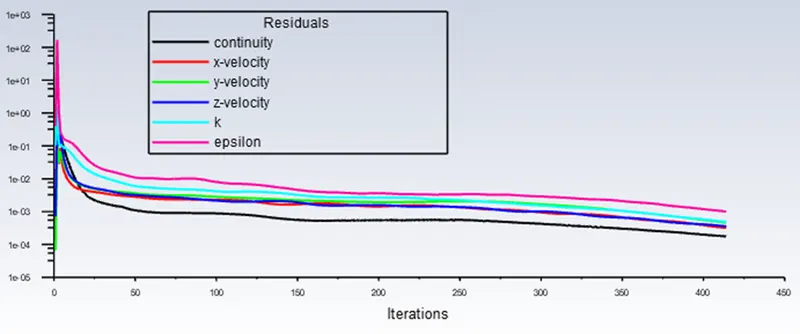
v=4 m/s, d=5e-6 m
Residual
Particle Resident Time & Separation Efficiency
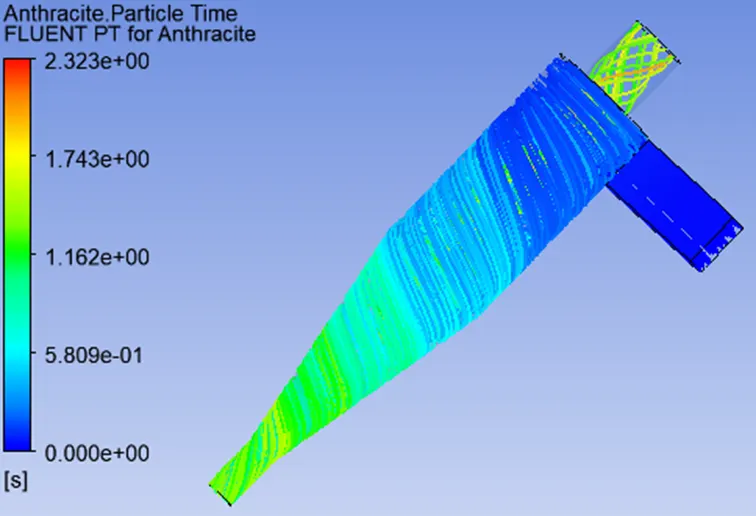
Seperation Efficiencey = (Trapped/Tracked)*100 = 78.70 %
Pressure contour & Pressure drop
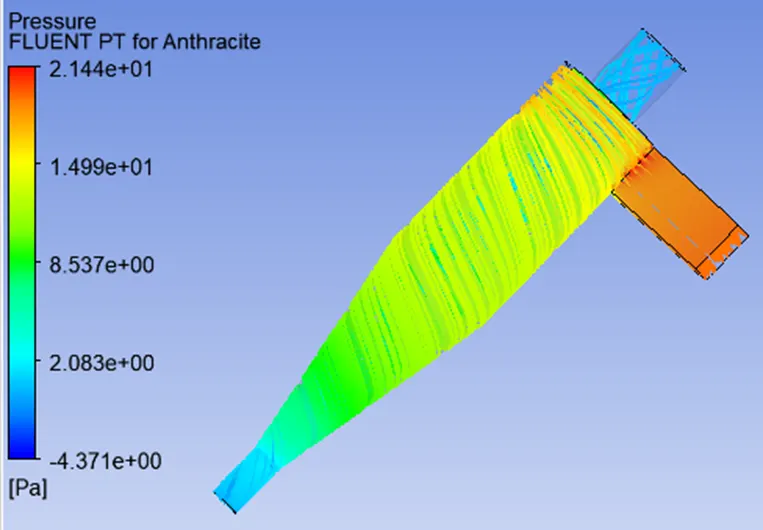
- Max Pressure = 21.44 pa, Min Pressure = -4.371 Pa
Pressure difference = 25.811 Pa
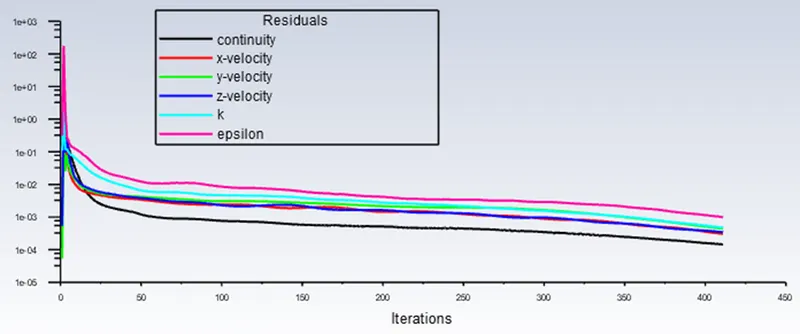
v=5 m/s, d=5e-6 m
Residual
Particle Resident Time & Separation Efficiency
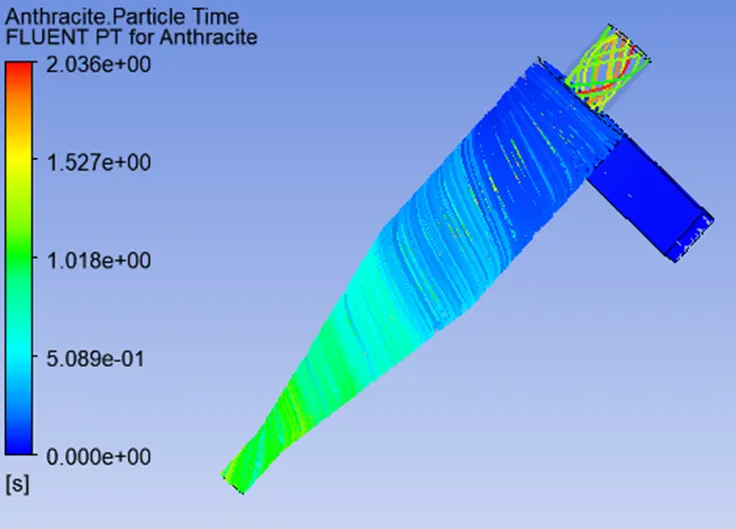
Seperation Efficiencey = (Trapped/Tracked)*100 = 84.73 %
Pressure contour & Pressure drop
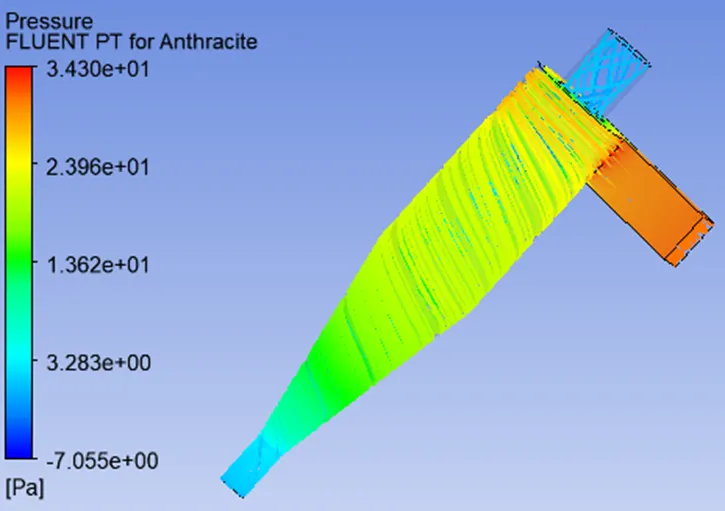
Max Pressure = 34.3 pa, Min Pressure = -7.055 Pa
Pressure difference = 41.355 Pa
|
Case 1 |
Size of Particles (m) |
Velocity of particles (m/s) |
No of the particles tracked |
No of the particles escaped |
No of the particle trapped |
No of the particles incomplete |
Separation efficiency (%) |
Pressure difference (Pa) |
|
1 |
5e5 |
1 |
465 |
248 |
112 |
115 |
24.086 |
2.876 |
|
2 |
5e5 |
2 |
465 |
173 |
292 |
0 |
62.79 |
6.762 |
|
3 |
5e5 |
3 |
465 |
138 |
327 |
0 |
70.32 |
14.047 |
|
4 |
5e5 |
4 |
465 |
99 |
366 |
0 |
78.7 |
25.811 |
|
5 |
5e5 |
5 |
465 |
71 |
394 |
0 |
84.73 |
41.355 |
Note: Ideally the cyclone separator simulation requires zero incomplete particles. But due to the limitation in computation, few cases discussed above have few incomplete particles. This can be optimized with an increase by increasing the maximum no of steps in tracking parameters.
CONCLUSION
Based on the results discussed in the previous section, we can make the following conclusion
- The efficiency of cyclone separators of the same size and configuration decreases as the particle size decreases.
- The efficiency of the cyclone separator s directly proportional to the flow velocity of the particulate. i.e. high-velocity yields higher efficiency
- Pressure drop only depends on the velocity of the particulate. As the velocity increases the pressure difference between inlet and outlet pressure increases.
- As the size of the particle decreases and the velocity of the flow decreases, the time is taken for convergence also increases. So to overcome this, the maximum no of steps in tracking parameters are increased.