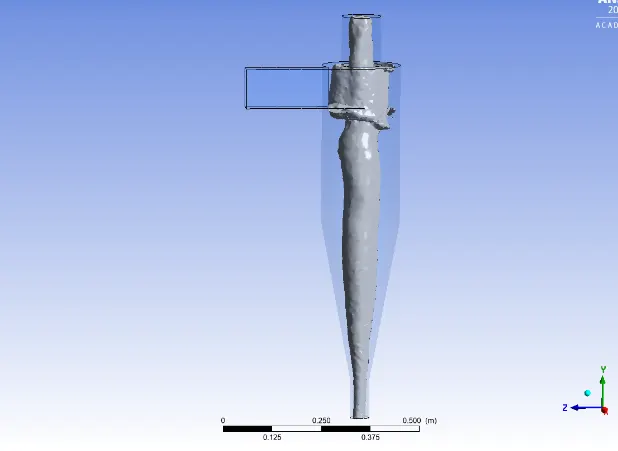
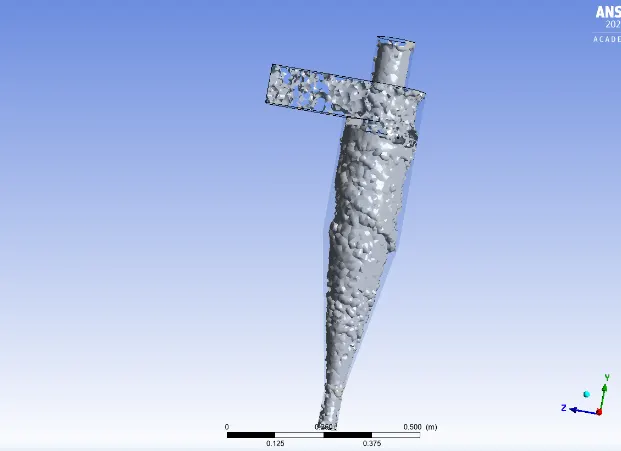
Week 8 - Simulating Cyclone separator with Discrete Phase Modelling
Aim:To perform analysis on cyclone separator and calculate the separation efficiency and pressure drop.
OBJECTIVE:
- To perform analysis on Cyclone Separator and calculate separation efficiency for given cases.
Case I - Size of particle = 5 um, Velocity = 1,2,3,4,5 m/s
Case II - Velocity = 3m/s, size of particles = 1,2,3,4,5 um - Explain different models used to determine the efficiency of cyclone separator in brief.
Given conditions:
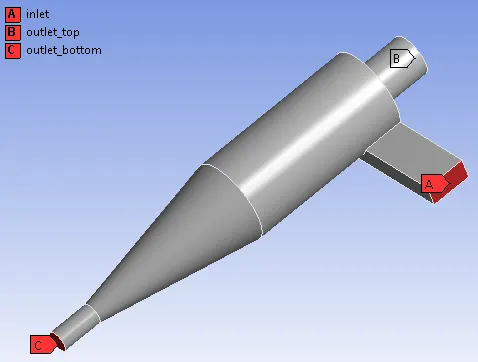
Inlet and wall:- Reflect
Outlet(Top):- Escape
Outlet(Bottom/dustbin) - Trap
Cyclone Separator:
Cyclone separators are separation devices that use the principle of inertia to remove particulate matter from flue gases.Cyclone separators is one of many air pollution removers known as precleaners since they generally remove larger pieces of particulate matter.
This prevents finer filtration methods from having to deal with large, more abrasive particles later on. In addition, several cyclone separators can operate in parallel, and this system is known as a multicyclone
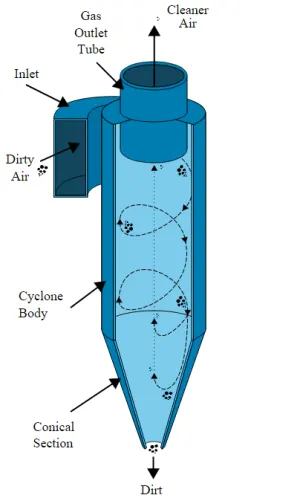
Cyclone separators work much like a centrifuge, but with a continuous feed of dirty air. In a cyclone separator, dirty flue gas is fed into a chamber. The inside of the chamber creates a spiral vortex, similar to a tornado. This spiral formation and the separation is shown in Figure . The lighter components of this gas have less inertia, so it is easier for them to be influenced by the vortex and travel up it. Contrarily, larger components of particulate matter have more inertia and are not as easily influenced by the vortex.
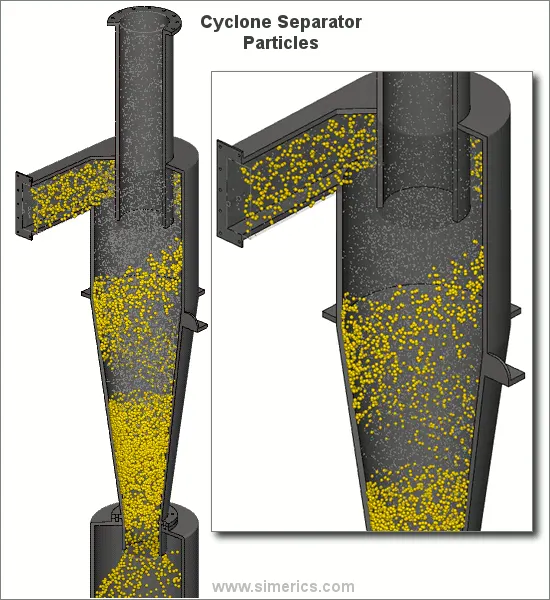
Since these larger particles have difficulty following the high-speed spiral motion of the gas and the vortex, the particles hit the inside walls of the container and drop down into a collection hopper. These chambers are shaped like an upside-down cone to promote the collection of these particles at the bottom of the container. The cleaned flue gas escapes out the top of the chamber.
Effectiveness:
Cyclone separators are generally able to remove somewhere between 50-99% of all particulate matter in flue gas. How well the cyclone separators are actually able to remove this matter depends largely on particle size. If there is a large amount of lighter particulate matter, less of these par0ticles are able to be separated out. Because of this, cyclone separators work best on flue gases that contain large amounts of big particulate matter.
There are several advantages and disadvantages in using cyclone separators. First, cyclone separators are beneficial because they are not expensive to install or maintain, and they have no moving parts. This keeps maintenance and operating costs low. Second, the removed particulate matter is collected when dry, which makes it easier to dispose of. Finally, these units take up very little space. Although effective, there are also disadvantages in using cyclone separators. Mainly because the standard models are not able to collect particulate matter that is smaller than 10 micrometers effectively and the machines are unable to handle sticky or tacky materials well.
Seperation efficiency is ratio of trapped particles to the total number of particles tracked.
Pressure drop is defined as the difference in total pressure between two points of fluid carrying network.
pressure drop = Total inlet pressure - total outlet pressure(top).
CYCLONE EFFICIENCY EMPIRICAL MODELS:
IOZIA AND LEITH MODEL :
Iozia and Leith (1990) logistic model is a modified version of Barth (1956) model which is developed based on force balance. The model assumes that a particle carried by the vortex endures the influence of two forces: a centrifugal force, Z, and a flow resistance,
The addition made by Iozia and Leith on the original Barth (1956) model are the core length zc and slope parameter β expression which is derived based on the statistical analysis of experimental data of cyclone with D = 0.25 m.
LI AND WANG MODEL:
The Li and Wang (1989) model includes particle bounce or re-entrainment and turbulent diffusion at the cyclone wall. A two-dimensional analytical expression of particle distribution in the cyclone is obtained. Li and Wang model was developed based on the following assumptions:
- The radial particle velocity and the radial concentration profile are not constant, for uncollected particles within the cyclones.
- Boundary conditions with the consideration of turbulent diffusion coefficient and particle bounce re-entrainment on the cyclone wall
KOCH AND LICHT MODEL:
Koch and Licht (1977) collection theory recognized the inherently turbulent nature of cyclones and the distribution of gas residence times within the cyclone. Koch and Licht describe particle motion in the entry and collection regions with the additional following assumptions:
- The tangential velocity of a particle is equal to the tangential velocity of the gas flow, i.e. there is no slip in the tangential direction between the particle and the gas.
- The tangential velocity is related to the radius of cyclone by: uRn = constant.
LAPPLE MODEL:
Lapple (1951) model was developed based on force balance without considering the flow resistance. Lapple assumed that a particle entering the cyclone is evenly distributed across the inlet opening. The particle that travels from inlet half width to the wall in the cyclone is collected with 50% efficiency. The semi empirical relationship developed by Lapple (1951) to calculate a 50% cut diameter.
Modeling approach:
There are 5 steps in the modeling approach.
- geometry correction(using space claim).
- meshing. (using Ansys mesher).
- setup problem.(using Ansys fluent).
- solution using(Ansys fluent).
- results.(using CFD post).
Step 1 - Geometry setup:
- Import the given geometry in SpaceClaim
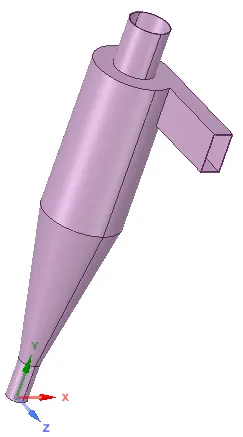
- Extract the fluid volume from the geometry. Prepare -> extract volume -> select edges
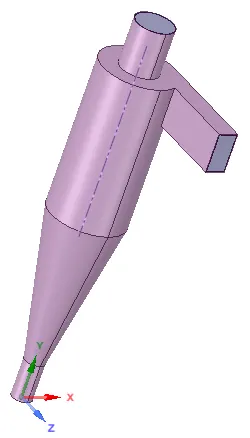
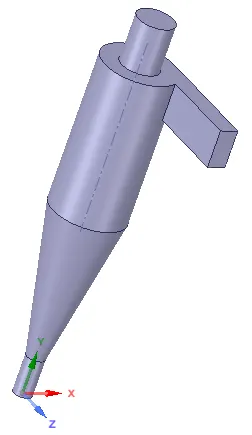
- Suppress the given geometry for physics.
Step 2 - Mesh:
- Here cut cell approach is tried to mesh the domain to obtain better accuracy and mesh quality
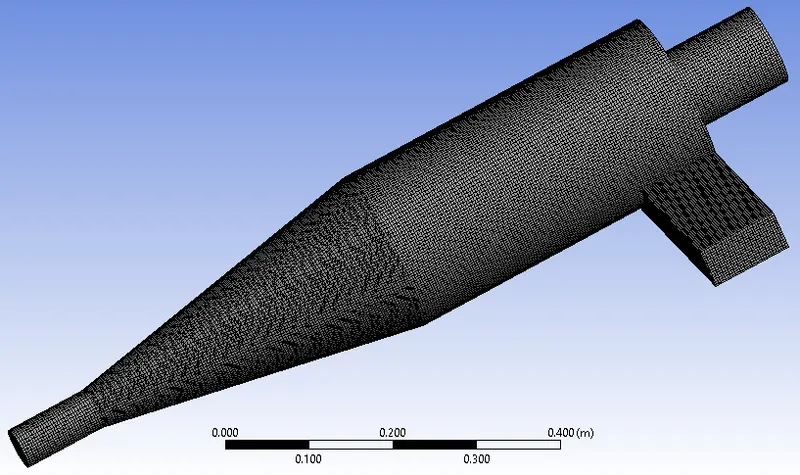
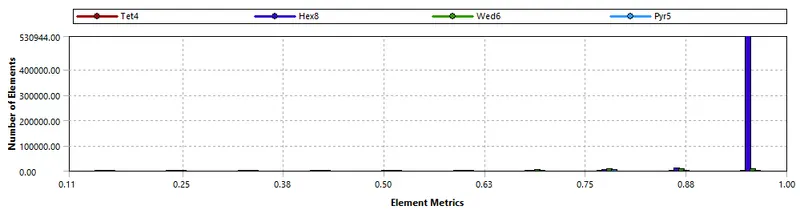
- Named selections are assigned to identify the inlets and outlets of the domain.
Step 3 - Setting up Physics:
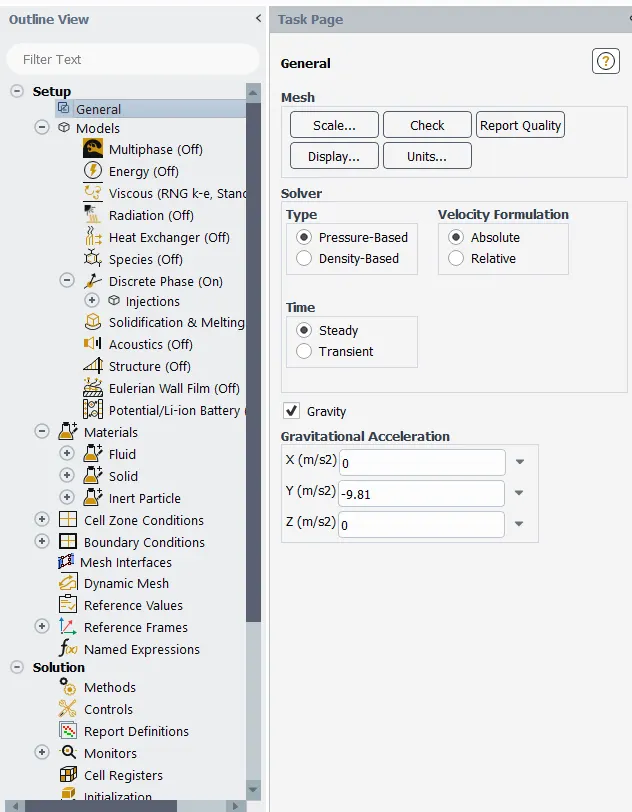
- Pressure based, steady-state solver. Gravity = -9.81 m/s2
- Model: K-Epsilon -> RNG, Swirl Dominated Flow
- Model: Discrete Phase model -> Interaction with continuous phase, update DPM sources every flow iteration, Max no of steps -> Create Injections
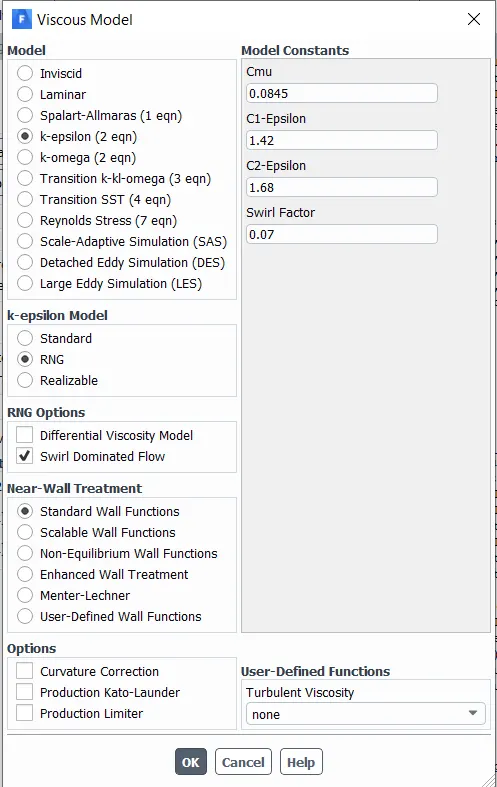
Discrete phase model and injections:
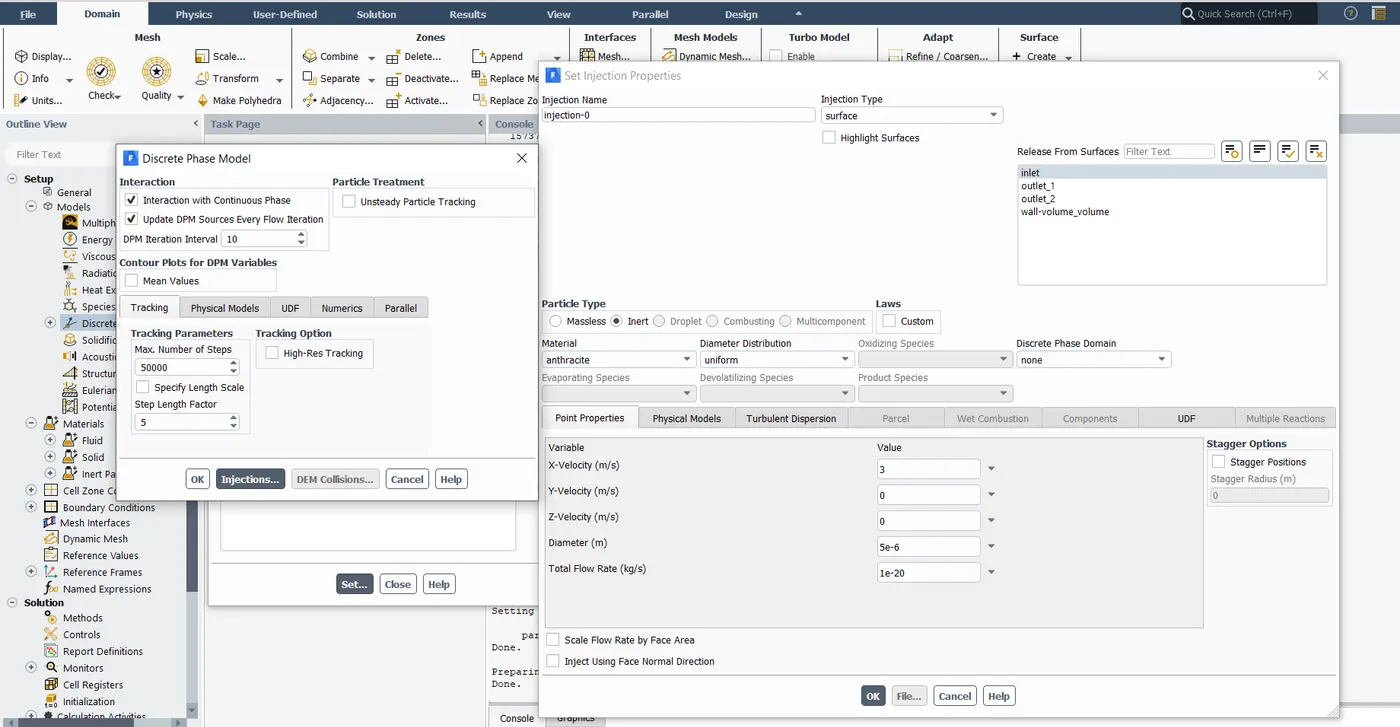
Boundary Conditions:
Inlet and wall:- Reflect
Outlet(Top):- Escape
Outlet(Bottom/dustbin) - Trap
Step 4 - Method:
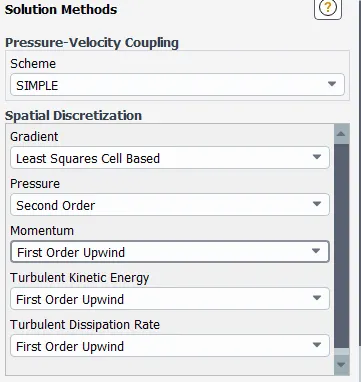
Step 5 - Initialization: Standard initialization
Step 6 - Run the simulation: enter no of iterations, run the simulation
Step 7 - Extract the results: Check convergence from residuals, particle tracking, pressure contours.
RESULT:
CASE 1
- v=3 m/s, d=1e-6 m
Residual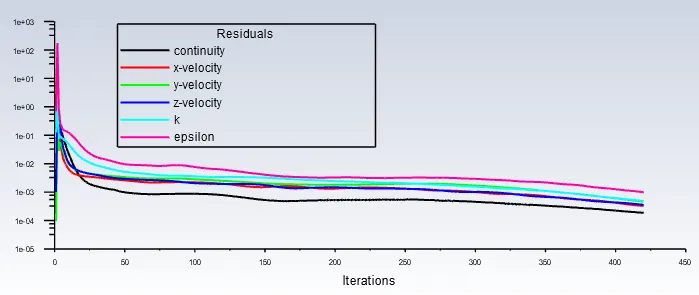
Particle Resident Time & Separation Efficiency:
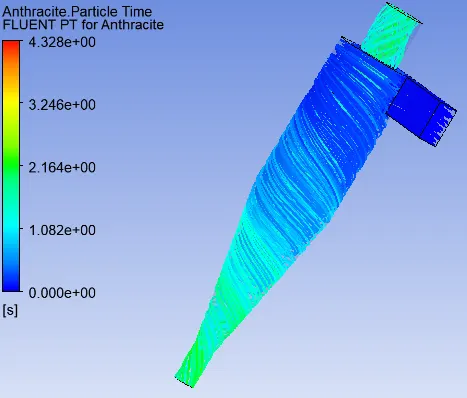
Separation Efficiency = 215/465 = 46.23 %
Pressure contour & Pressure drop: 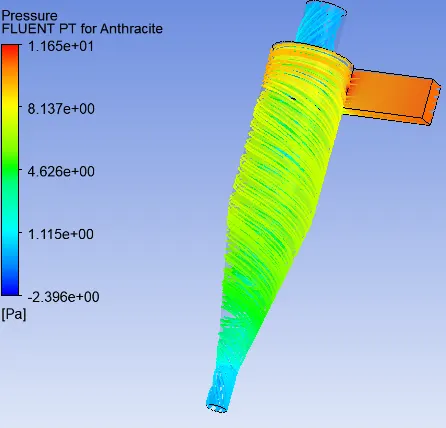
Max Pressure = 11.65 pa, Min Pressure = -2.396 Pa
Pressure Difference = 14.046 Pa- v=3 m/s, d=2e-6 m
Residual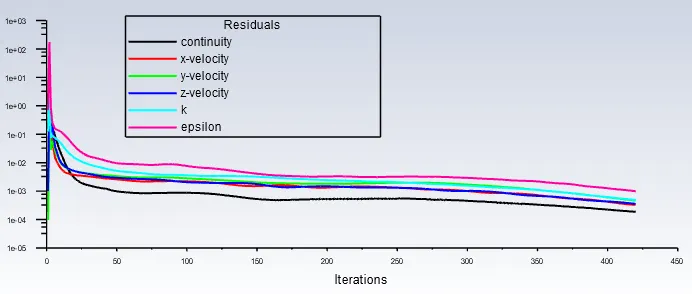
Particle Resident Time & Separation Efficiency
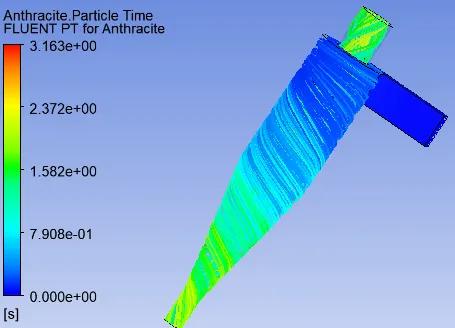
Seperation Efficiencey = (Trapped/Tracked)*100 = 50.75%
Pressure contour & Pressure drop: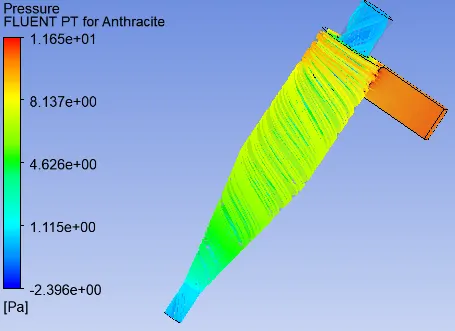
Max Pressure = 11.65 pa, Min Pressure = -2.396 Pa
Pressure Difference = 14.046 Pa - v=3 m/s, d=3e-6 m
Residual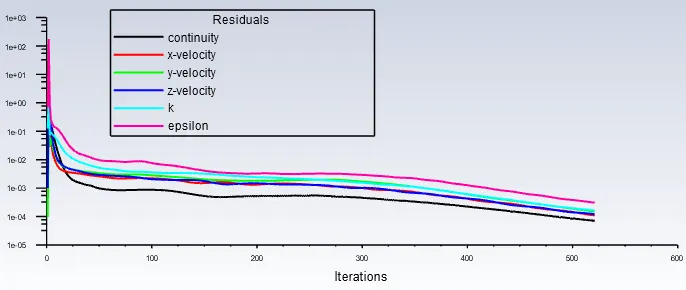
Particle Resident Time & Separation Efficiency
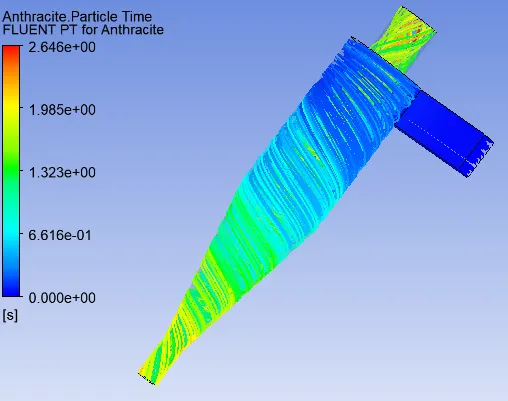
Seperation Efficiencey = (Trapped/Tracked)*100 = 55.48%
Pressure contour & Pressure drop: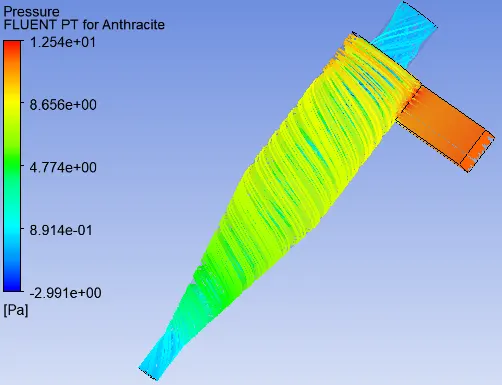
Max Pressure = 12.54 pa, Min Pressure = -2.991 Pa
Pressure Difference = 15.531 Pa - v=3 m/s, d=4e-6 m
Residual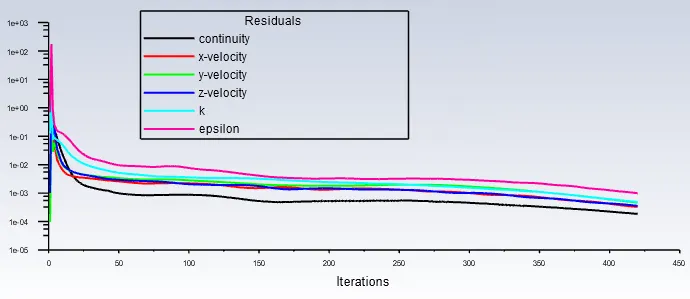
Particle Resident Time & Separation Efficiency
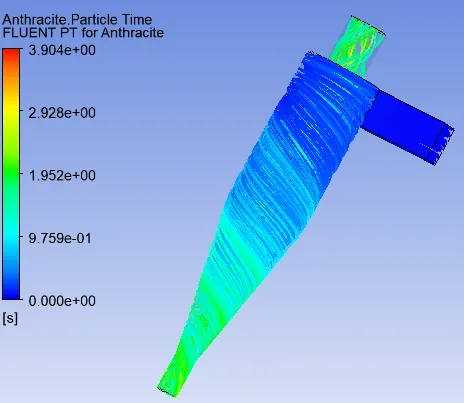
Seperation Efficiencey = (Trapped/Tracked)*100 = 61.5%
Pressure contour & Pressure drop: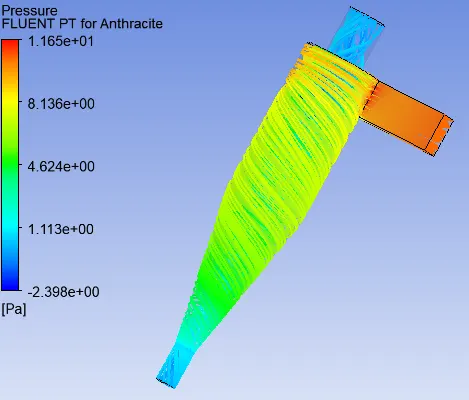
Max Pressure = 11.65 pa, Min Pressure = -2.398 Pa
Pressure difference = 14.048 Pa - v=3 m/s, d=5e-6 m
Residual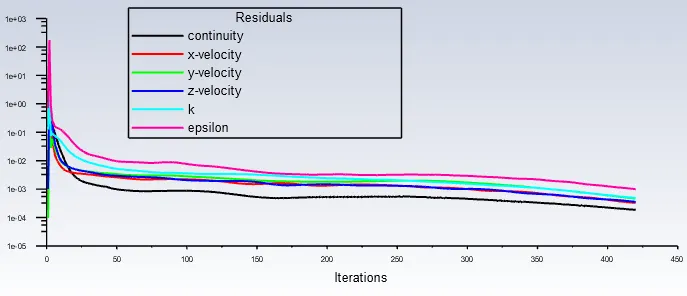
Particle Resident Time & Separation Efficiency
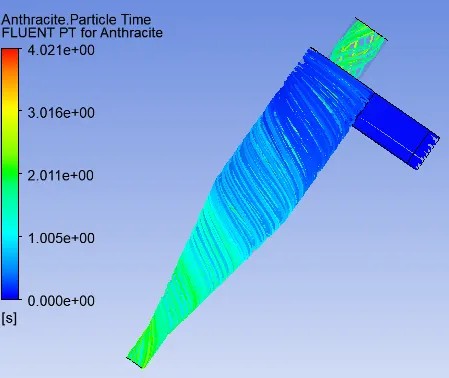
Seperation Efficiencey = (Trapped/Tracked)*100 = 70.32 %
Pressure contour & Pressure drop: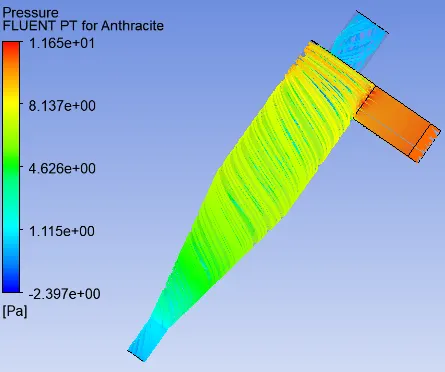
Max Pressure = 11.65 pa, Min Pressure = -2.397 Pa
Pressure difference = 14.047 Pa
Case 1 Size of Particles (m) Velocity of particles (m/s No of the particles tracked No of the particles escaped No of the particle trapped No of the particles incomplete separation efficiency (%) Pressure difference (Pa) 1 1e5 3 465 239 215 11 46.23 14.046 2 2e5 3 465 229 236 0 50.75 14.046 3 3e5 3 465 207 258 0 55.48 14.046 4 4e5 3 465 179 286 0 61.5 14.048 5 5e5 3 465 138 327 0 70.32 14.047
CASE 2
- v=1 m/s, d=5e-6 m
Residual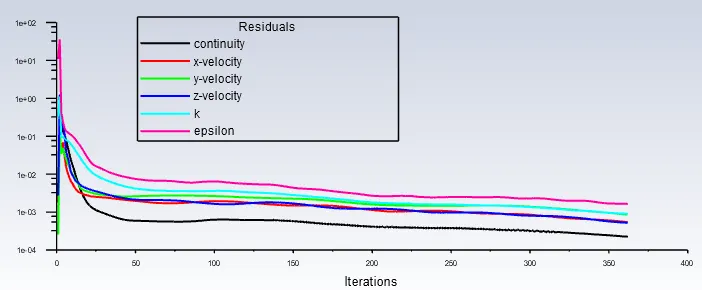
Particle Resident Time & Separation Efficiency
Seperation Efficiencey = (Trapped/Tracked)*100 = 24.086 %
Pressure contour & Pressure drop: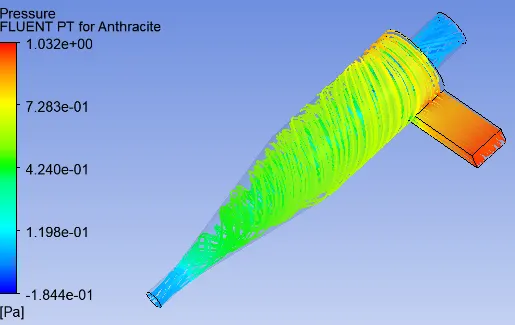
Max Pressure = 1.032 pa, Min Pressure = -1.844 Pa
Pressure difference = 2.876 Pa - v=2 m/s, d=5e-6 m
Residual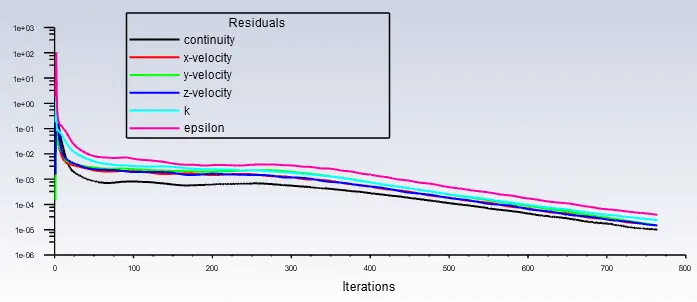
Particle Resident Time & Separation Efficiency
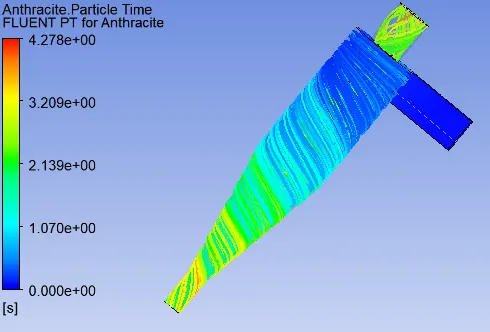
Seperation Efficiencey = (Trapped/Tracked)*100 = 62.79 %
Pressure contour & Pressure drop: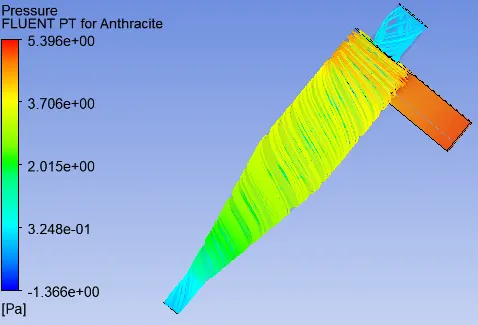
Max Pressure = 5.396 pa, Min Pressure = -1.366 Pa
Pressure difference = 6.762 Pa - v=3 m/s, d=5e-6 m
Residual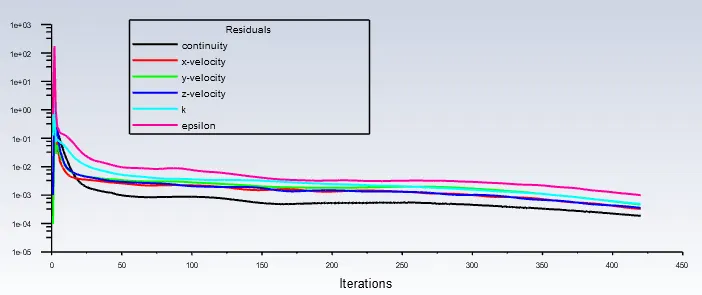
Particle Resident Time & Separation Efficiency
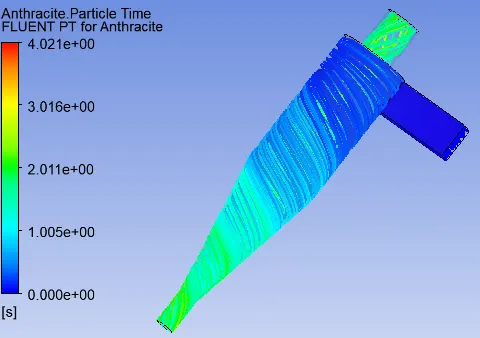
Seperation Efficiencey = (Trapped/Tracked)*100 = 70.32 %
Pressure contour & Pressure drop: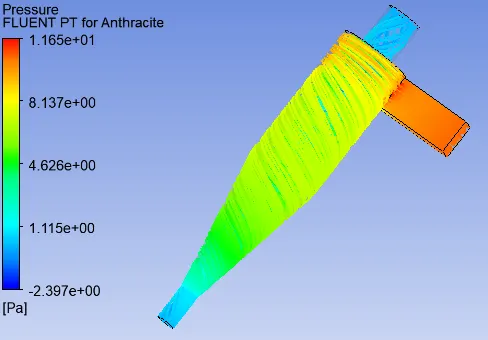
Max Pressure = 11.65 pa, Min Pressure = -2.397 Pa
Pressure difference = 14.047 Pa - v=4 m/s, d=5e-6 m
Residual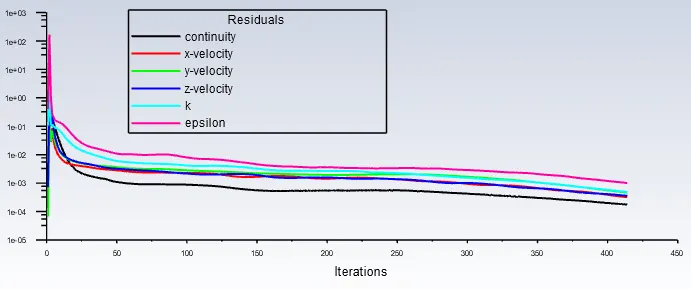
Particle Resident Time & Separation Efficiency
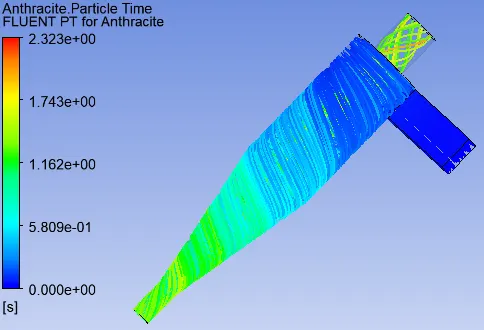
Seperation Efficiencey = (Trapped/Tracked)*100 = 78.70 %
Pressure contour & Pressure drop: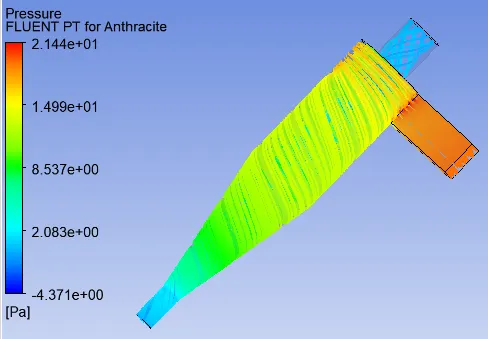
Max Pressure = 21.44 pa, Min Pressure = -4.371 Pa
Pressure difference = 25.811 Pa - v=5 m/s, d=5e-6 m
Residual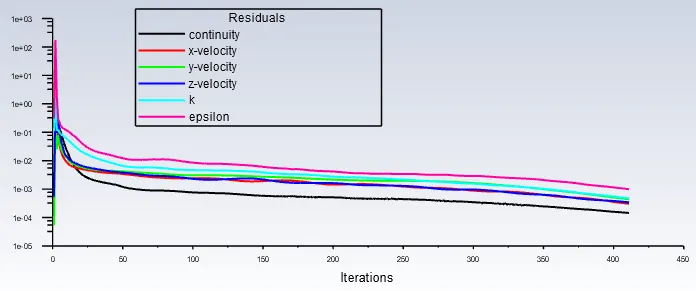
Particle Resident Time & Separation Efficiency
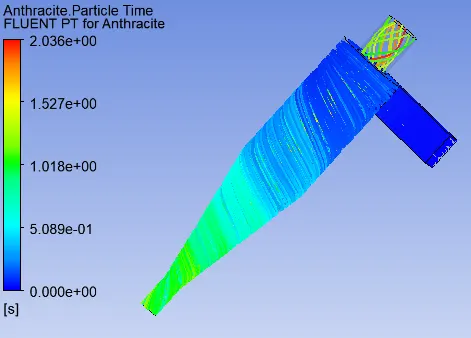
Seperation Efficiencey = (Trapped/Tracked)*100 = 84.73 %
Pressure contour & Pressure drop: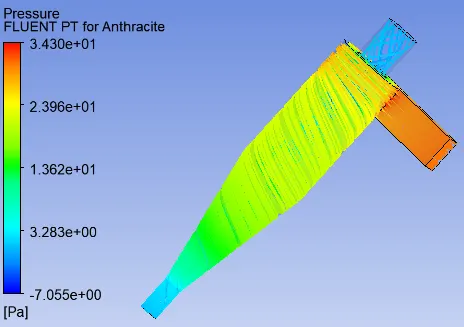
Max Pressure = 34.3 pa, Min Pressure = -7.055 Pa
Pressure difference = 41.355 Pa
Case 1 Size of Particles (m) Velocity of particles (m/s) No of the particles tracked No of the particles escaped No of the particle trapped No of the particles incomplete Separation efficiency (%) Pressure difference (Pa) 1 5e5 1 465 248 112 115 24.086 2.876 2 5e5 2 465 173 292 0 62.79 6.762 3 5e5 3 465 138 327 0 70.32 14.047 4 5e5 4 465 99 366 0 78.7 25.811 5 5e5 5 465 71 394 0 84.73 41.355
Conclusion:
1.Seperation Efficiency depends on both diameter and velocity of particles.
2.Increase in diameter and velocity increases seperation efficiency.
3.Velocity has greater impact as compared to diameter of particle.
4.Pressure drop is dependant on velocity. for constant velocity with varying diameter size the pressure drop remains almost constant.
5.Increase in velocity causes the pressure drop to rise exponentially.
Basic vortex region: