Week 7 State of charge estimation
Challenge 7
- Simulate the 3 test cases from harness dashboard and write a detailed report on the results
- What is coulomb counting? Refer to the above model and explain how BMS implements coulomb counting for SOC estimation?
Hint: (Download the file from the link and go to SOC estimation model-ECU block)
Solution
Definition Battery Management System (BMS)
A battery management system (BMS) is an electronic system designed to oversee rechargeable batteries. Its functions include safeguarding the battery against operating beyond safe limits, keeping track of its condition, computing additional information, relaying this information, regulating the battery's surroundings, verifying its authenticity, and/or ensuring its even charge distribution.
Functions of BMS
The battery management system (BMS) performs a variety of crucial tasks in handling rechargeable batteries. Among its key functions are:
- Continuous Monitoring of Battery Parameters: The BMS constantly observes critical battery parameters like voltage, current, temperature, and state of charge (SOC). This data is essential for evaluating the battery's health and performance.
- Protection Against Overcharge and Overdischarge: Preventing the battery from being overcharged, which can cause damage or safety hazards, and safeguarding it from discharging beyond safe limits, leading to irreversible harm.
- Temperature Oversight: The BMS tracks the battery's temperature and may implement measures to maintain it within the optimal range. Extreme temperatures can significantly impact the battery's performance and overall lifespan.
- Ensuring Cell Balancing: In multi-cell battery packs, the BMS ensures that each cell receives an equal charge during charging and discharging. This cell balancing process maintains cell uniformity and maximizes the battery's total capacity.
- State of Charge Estimation: The BMS estimates the battery's state of charge (SOC), indicating the remaining energy at any given time.
- State of Health Monitoring: The BMS also monitors the battery's state of health (SOH) throughout its lifespan, assessing capacity degradation and overall condition.
- Fault Detection and Diagnostics: Identifying any faults or abnormalities in the battery's operation and initiating appropriate responses, such as isolating a faulty cell or shutting down the system if necessary.
- Communication and Data Reporting: BMS systems communicate with external devices or systems, transmitting vital battery data, diagnostics, and alerts to users or central monitoring systems.
- Ensuring Safety and Protection: A crucial BMS function involves maintaining battery safety and protecting the surrounding environment. This may include features like short-circuit protection and temperature-based safety cutoffs.
- Authentication and Security: In certain applications, the BMS may incorporate security features to authenticate the battery and prevent the use of unauthorized or counterfeit batteries.
In conclusion, the BMS plays an indispensable role in optimizing battery performance, extending its lifespan, and ensuring secure operations across various applications, from small consumer electronics to electric vehicles and renewable energy storage systems. Figure 1 shows a schematic diagram for a vehicle BMS, andFigure 2 identifies BMS structure.
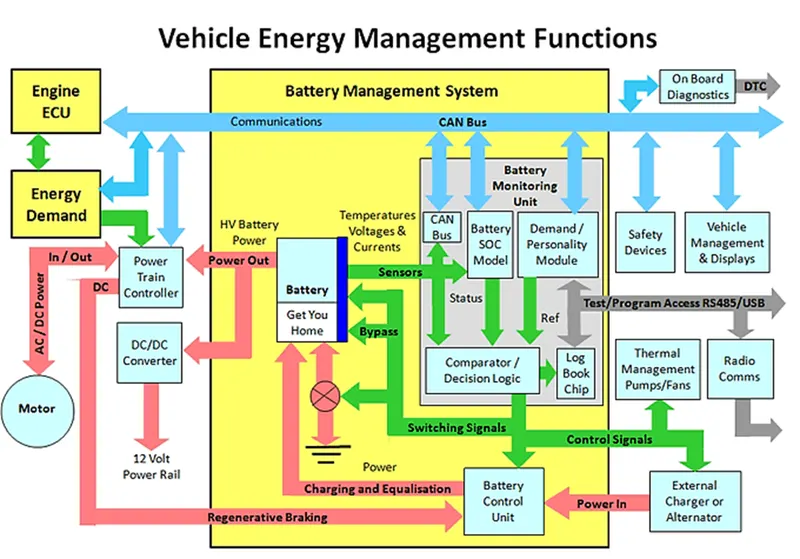
Figure 1: Schematic diagram of a vehicle energy management functions. Available at: https://www.researchgate.net/post/Power_needed_to_fully_charge_a_car_battery
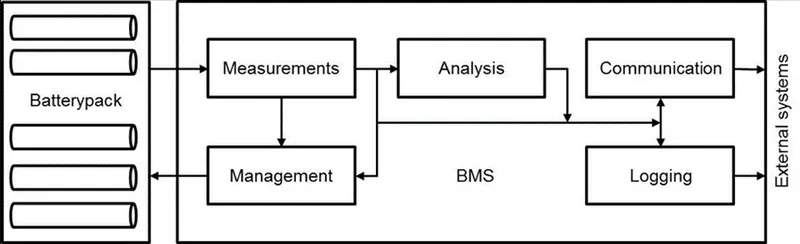
Figure 2: Battery management system structure. Available at: https://www.researchgate.net/publication/324331458
Simulink Model of BMS
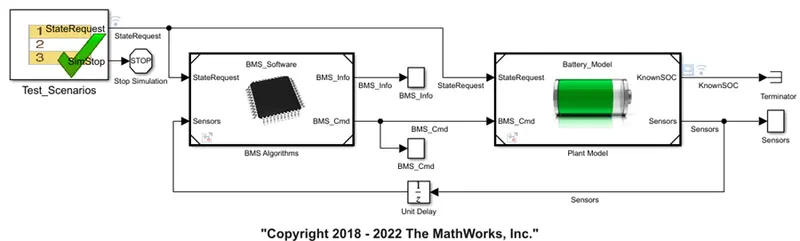
The model consists of two primary components: the BMS ECU block and the PLANT block. The PLANT block represents a battery, while the ECU block represents software within the Matlab and Simulink environment.
Plant Subsystem
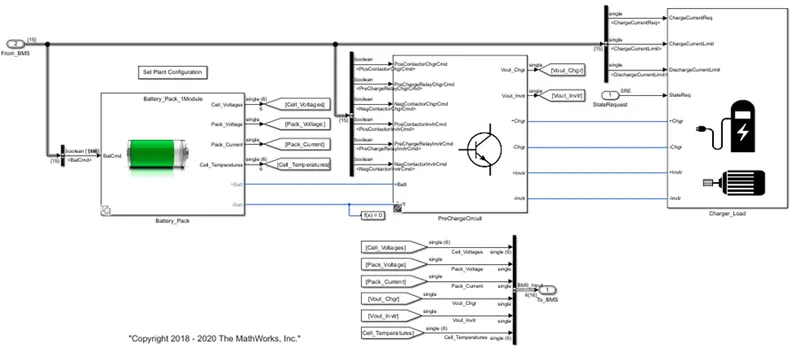
The plant subsystem is composed of three main blocks: the battery pack, the pre-charger circuit, and the charger-load block. The pre-charger circuit is interconnected with the charger and the load, represented by the motor, which is connected through the inverter and charger wires to the pre-charge block. The charger and load subsystem comprises the charger block and the motor block, and they are connected in a parallel arrangement.
Charger and Load Subsystem
Load Subsystem
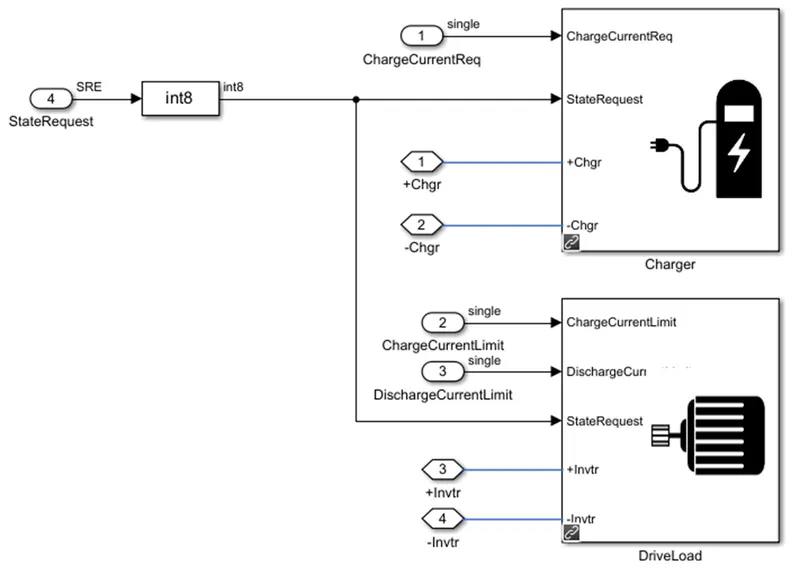
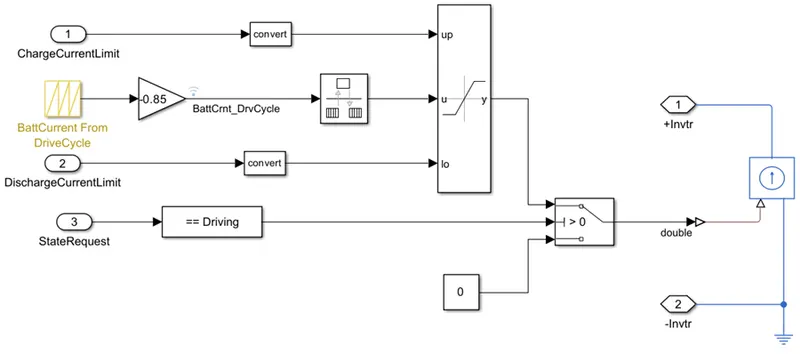
This particular subsystem models the DC driver load. It simulates the battery current based on the drive cycle, essentially replicating the current draw. The current source is determined by the battery current drive cycle block, and it facilitates both the charging and discharging of the battery block.
Charger Subsystem
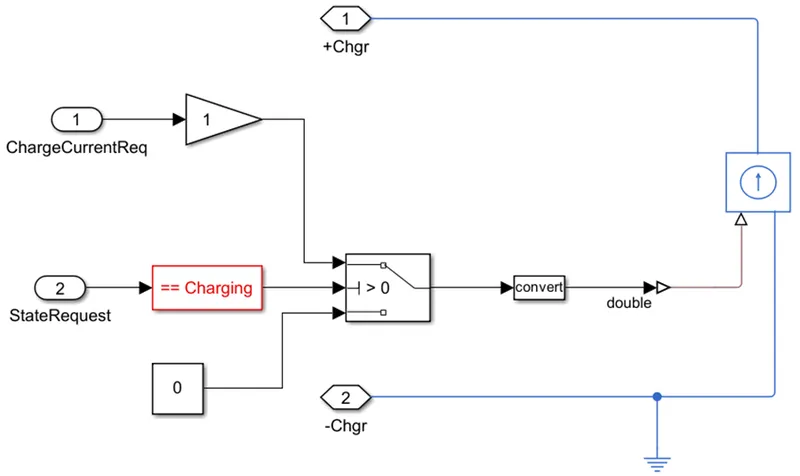
This will reverse the charging process of the battery. The equations herein depict the battery being continuously charged in the opposite direction. The charging source remains continuous throughout this process.
Battery pack subsystem
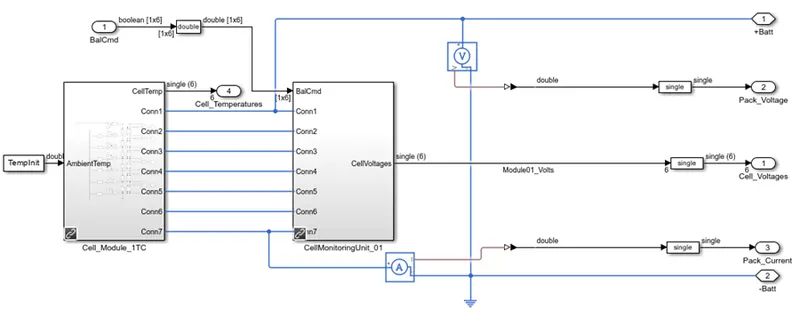
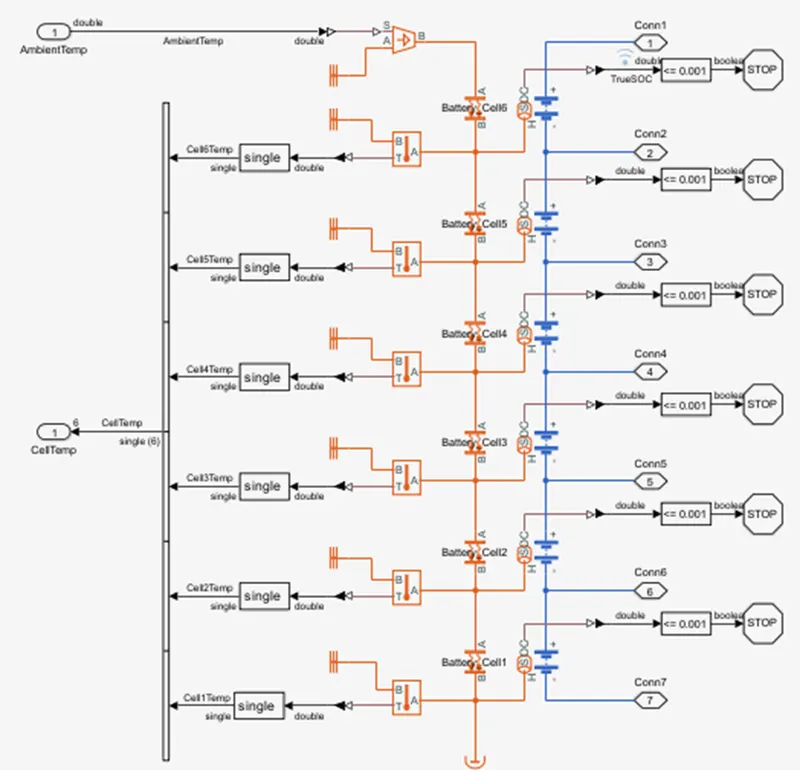
This subsystem represents a cell module block that comprises two sets: a 6-cell module and a 16-cell module. From the 6-cell module block, six cells are connected in series, and the temperature port is activated to measure the temperature of each cell. This data is then transmitted to the multiplexer and subsequently passed to the BMS circuit. The Connection 1 port provides the battery-positive connection, while the Connection 7 port serves as the battery-pack-negative connection. Notably, the current sensor block is connected in series with the negative port, generating the output for the pack current value.
Precharge Circuit Subsystem
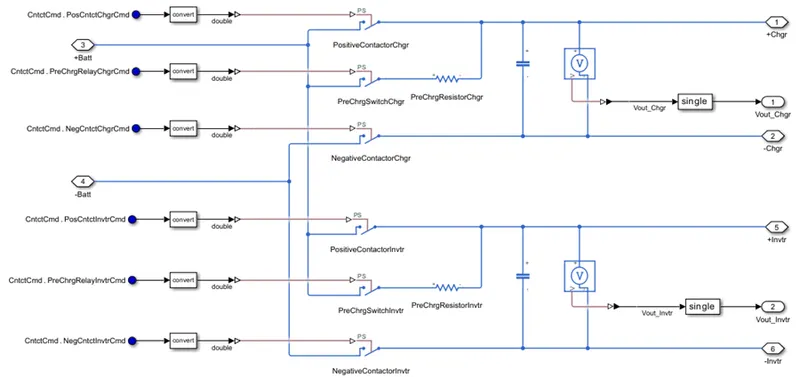
In essence, the precharge circuit is responsible for connecting and disconnecting the pre-charge resistor in the inverter or charger. Two resistors are employed since the current direction is reversed in the circuit. Input signals from the precharge relay commands are utilized to control the contactor, which, in turn, switches the circuit on and off.
Test Harness Dashboard Model
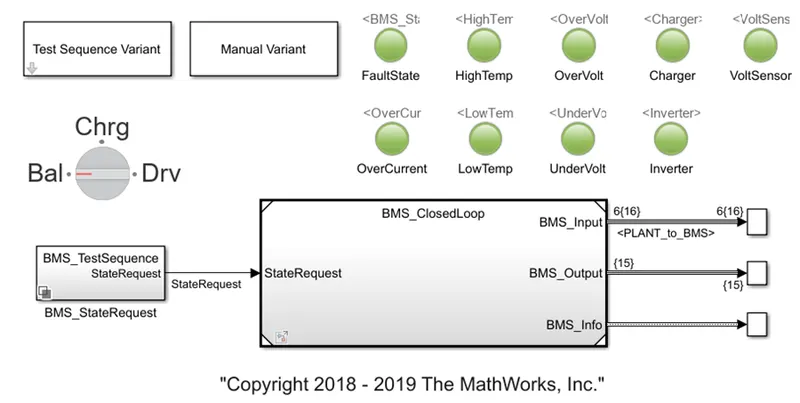
The dashboard provides real-time information about the BMS status and any potential faults in the system. A green light indicates a fault-free condition, while a red light indicates the presence of a fault. Additionally, the BMS status is visible on the left-hand side knob, displayed as a block that shows whether the BMS is in a charging state, driving mode, or a balanced state.
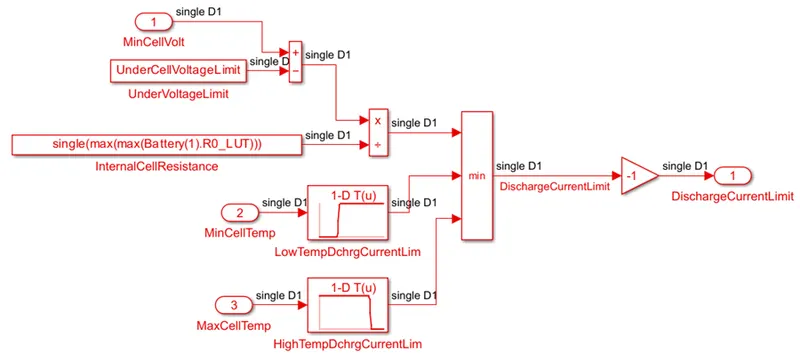
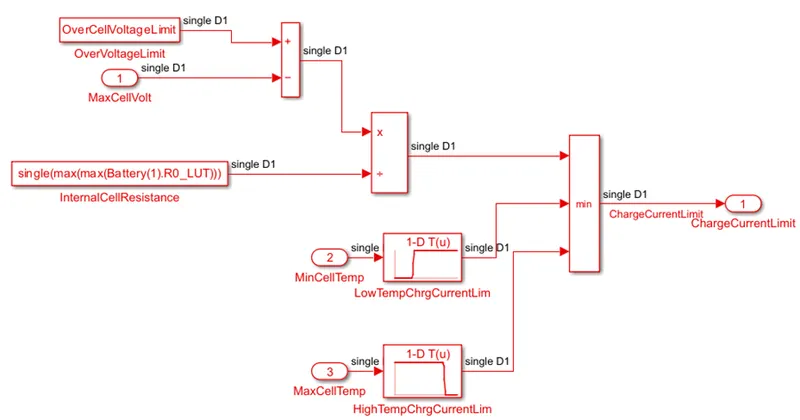
This block manages the current and power limits through two separate components: one for the charge current limit and another for the discharge current limit. The limits for charging and discharging are calculated based on factors like the number of cells connected in series and the minimum or maximum cell voltage, current, or temperature. The equations in block format below illustrate how the discharge and charging calculations are represented.
All these algorithms will be executed within the state machine block, denoted by a blue indication to show which algorithms are currently running. The state machine block will handle calculations for cell voltage, cell current, and temperature-related parameters. The output generated by the state machine block will be directed to the BMS dashboard. The Matlab BMS model will operate in three distinct states, each requiring specific algorithmic execution.
Current Power Limits Calculations Block
In this block, the current and power limits are managed through two separate blocks: one for the charge current limit and the other for the discharge current limit. The calculation of these limits depends on factors such as the number of cells connected in series and the minimum or maximum cell voltage, current, or temperature. The discharge and charge calculations are presented below in block format using equations.
Charging and Discharging Blocks
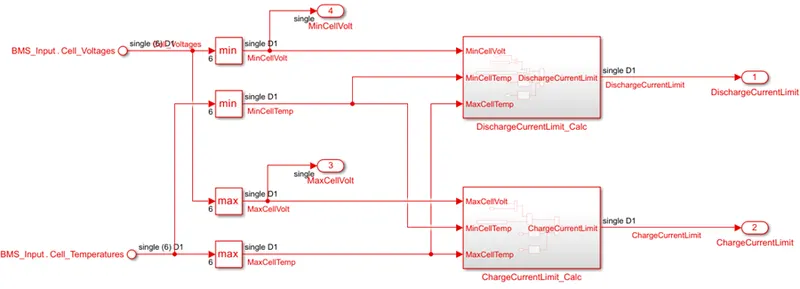
Discharge Current Calculation Subsystem
Charge Current Calculation Subsystem
State Machine Block
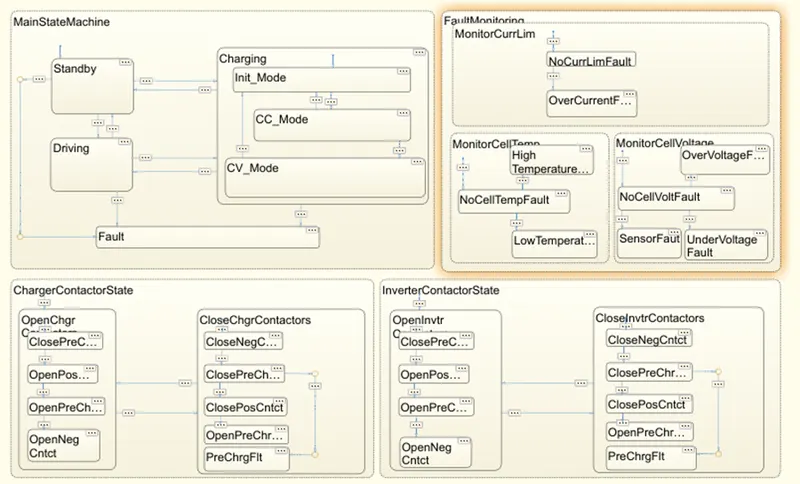
All of these algorithms are scheduled to execute within the state machine block. The running algorithms or blocks will be indicated in blue. Inside the state machine block, various algorithms related to cell voltage, cell current, and temperature calculations will be processed. The state machine block's output is then fed into the BMS dashboard. The Matlab BMS model will operate in three different states as required.
- Simulate the 3 test cases from harness dashboard and write a detailed report on the results
Test 1 Description
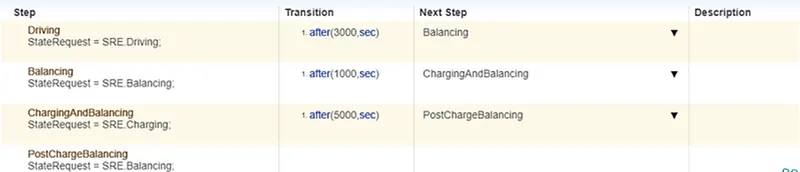
The simulation runs for a duration of 20,000 seconds, divided into distinct phases. Initially, the first 3,000 seconds represent the discharge or driving mode, followed by 1,000 seconds of balancing or standby mode. Subsequently, there are 5,000 seconds allocated to the charging and balancing mode. Finally, the simulation concludes with another period of standby or balancing mode.
Test 1 Output
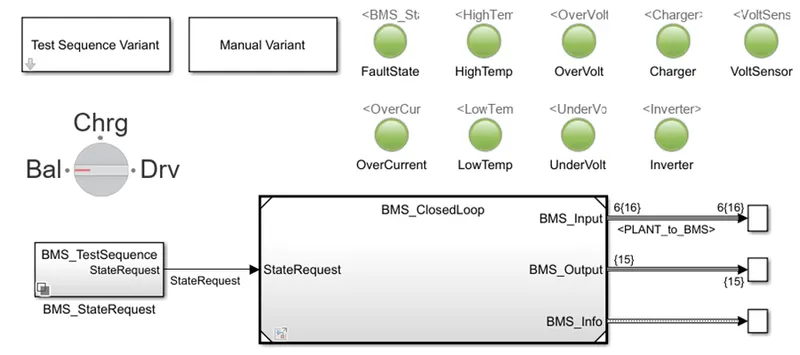
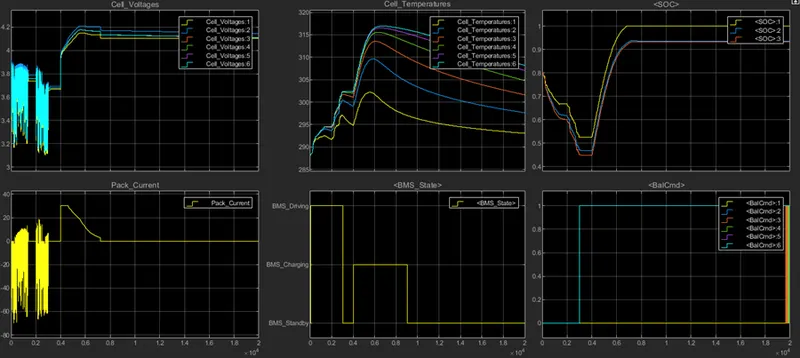
In the beginning, the battery is charged at 80%. It remains in a driving condition for 3000 seconds, after which it enters a standby phase for 1000 seconds to balance the cells. Following the standby period, the battery undergoes a charging phase where its state of charge (SOC) is increased to 100%. This charging process takes 5000 seconds, and afterward, the same sequence repeats for the aging procedure.
In the dashboard display, all the green LEDs are illuminated, indicating that the system is free from any faults.
Within the output scope, a total of 6 plots are available:
- The first plot depicts the cell voltage during driving conditions, with a maximum voltage of 4.2V. Fluctuations in voltage indicate the drive cycle, while during battery balancing mode, the voltage remains constant, indicating no voltage is drawn from the circuit.
- The pack current plot illustrates the combination of the drive cycle and the load current, which is implemented using a repeating cycle block. Negative current values represent discharging, while positive values represent charging.
- As the BMS operates, cell temperatures rise. Different temperatures are observed for each cell due to their varying placements within the battery pack. Central cells tend to have higher temperatures compared to those at the outer edges.
- It is crucial to control the temperature difference between cells to avoid reaching maximum values, as excessive heat can impact the capacity of cells with higher temperatures.
- Initially, the state of charge (SOC) is set at 80%. During driving conditions, the SOC reduces to 55% (for cell no.1) and 45% for other cells, and during standby periods, the SOC remains constant. After the charging period, the SOC level increases back to 100%.
- The sixth plot displays the cell balancing command for all six cells. The first cell, having the lowest voltage, does not require balancing. As a result, signals for all other cells have a magnitude of 1, while the first cell's signal has a magnitude of zero.
Test 2 Description
The simulation is scheduled to run for a total of 20,000 seconds, with the initial 5,000 seconds dedicated to the discharge or driving mode, while the remaining time is designated for charging the battery.

Test 2 Output
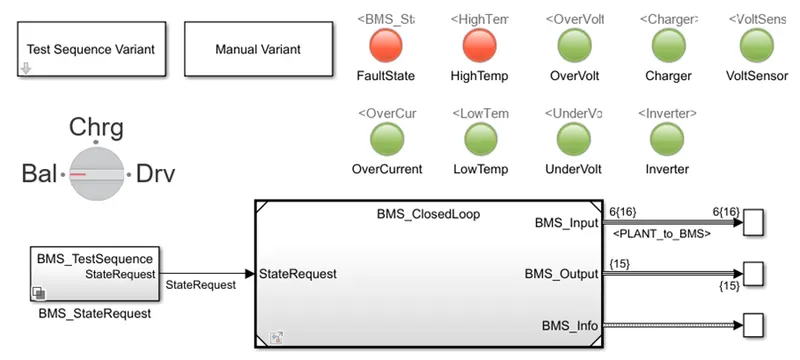
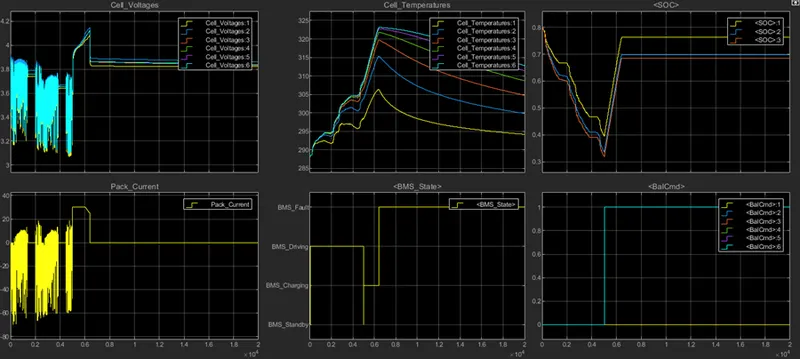
From the dashboard display, it is evident that two LEDs are lit up in red, indicating the presence of faults within the battery pack system.
- In the first set of plots, the cell voltage is displayed. During the discharged state, there are fluctuations on the negative side, while in the standby state, the signals are stable. When the battery is being charged, the signal level rises.
- The second set of plots illustrates the pack current. Until 5000 seconds, the current is discharged, but after that, an error occurs during the charging state.
- In the third plot, the cell temperatures are shown, and it is evident that a fault occurs when the cell no.6 voltage reaches its maximum temperature of approximately 323.5k. As a result, the battery enters a fault state, and further processes are put on standby.
- The fourth plot indicates that an error in the input state is detected at 6000 seconds.
- The fifth plot demonstrates the state of charge (SOC) of the 6 cells. The SOC decreases during battery discharge, and as it is charged, the curve rises until it reaches 100%.
- The sixth plot illustrates the cell balancing command for all six cells. The first cell, having the lowest voltage, does not require balancing, and hence its signal magnitude remains at zero. For all other cells, the signal magnitude is 1, indicating that cell balancing initiates when the battery starts to charge. During the fault onset, battery charging is halted, but balancing continues to take place.
Test 3 Description
The simulation is conducted over a duration of 20,000 seconds, with the initial 10,000 seconds representing the discharge or driving mode, followed by the remaining time allocated for charging the battery.

Test 3 Output
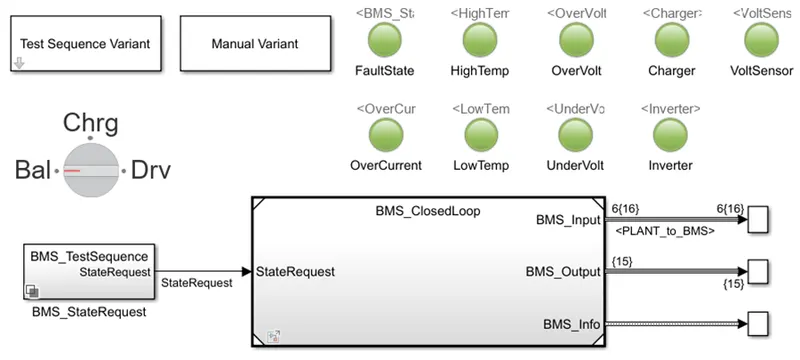
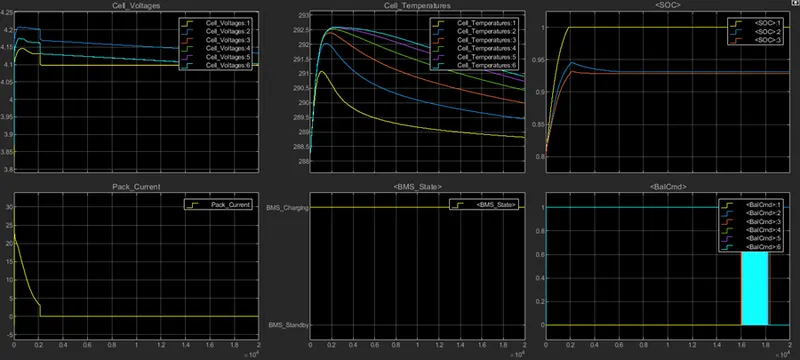
The dashboard displays all green LEDs illuminated, indicating that the system is free from any faults.
- The cell voltages experience a sharp increase in the voltage when discharging mode is disabled and charging mode is enabled. Since the voltage of cell 1 is less than other cells, balancing starts to occur. Consequently, the voltage of cell 1 keeps increasing at a slow rate, while decreasing for other cells to make this balance.
- The second plot depicts a sharp decrease in the pack current between 0 to 2000 seconds and remains steady afterward since the charge is not utilized during this period, and no driving activity is present.
- As the BMS operates, cell temperatures rise. Different temperatures are observed for each cell due to their varying placements within the battery pack. Central cells tend to have higher temperatures compared to those at the outer edges.
- In the fourth plot, the input state follows the given state input. The simulation runs in charging mode, and no driving (or discharging) activity is present.
- The fifth plot illustrates the state of charge (SOC) for the 6 cells. As the battery discharges, the SOC decreases, and during charging, the curve ascends until it reaches a full charge of 100% for the weakest cell (cell no.1).
- The sixth plot displays the cell balancing command for all six cells. The first cell, which has the lowest voltage, does not need balancing, resulting in a signal magnitude of zero. However, for the remaining cells, the signal magnitude is 1, indicating that cell balancing is activated when the battery enters the charging phase.
- What is coulomb counting? Refer to the above model and explain how BMS implements coulomb counting for SOC estimation?
Coulomb counting is a technique utilized for tracking the State of Charge of a battery pack. It involves integrating the active flowing current (measured in amps) over time to determine the total sum of energy entering or leaving the battery pack. This process yields a capacity measurement typically expressed in Amp-hours (Ah). Upon observation, the SOC of the cells exhibits differences, which result from distinct calculations performed in the SOC simulation and balancing block.
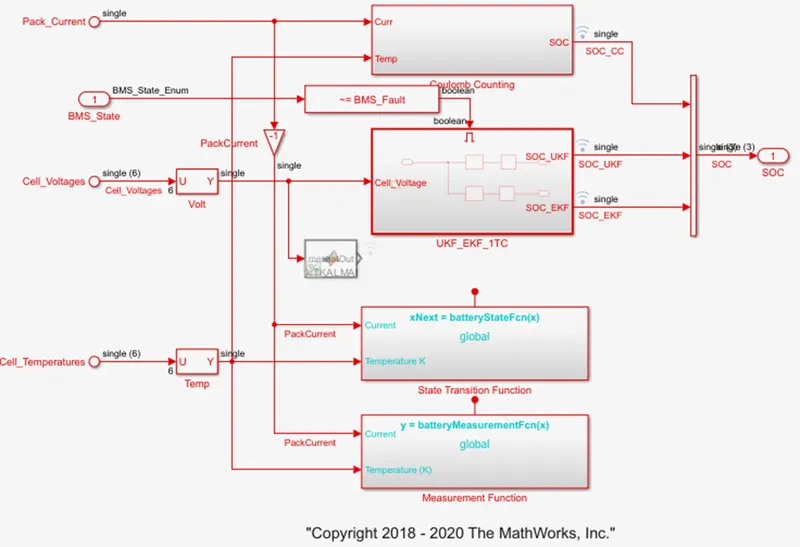
SOC estimations are performed using three distinct formats. The initial block corresponds to coulomb counting, while the subsequent block involves an Unscented Kalman Filter (UKF) and Extended Kalman Filter (EKF) algorithms for SOC calculations through Kalman filtering. The Extended Kalman Filter (EKF) and Unscented Kalman Filter (UKF) are widely used algorithms for estimating the state-of-charge (SOC) in battery management systems. The EKF extends the traditional Kalman filter by approximating nonlinear systems through linearization around the current SOC estimate, offering simplicity but potentially lower accuracy for highly nonlinear systems. In contrast, the UKF uses the Unscented Transform to capture system uncertainty without linearization, resulting in better accuracy for highly nonlinear systems but higher computational complexity. The selection between EKF and UKF depends on the system's nonlinearity and the balance between computational resources and estimation accuracy.
Coulomb Counting Equation Subsystem
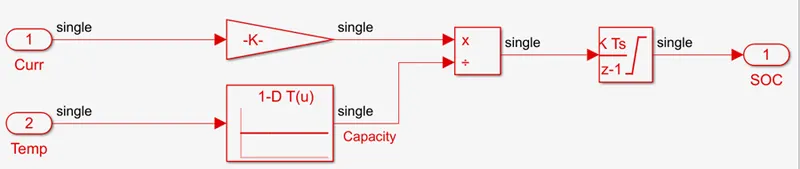
The process of coulomb counting entails integrating the current over a specific period using a discrete-time integrator. Notably, this integration accounts for the influence of temperature. The discrete-time integrator blocks operate within the Z-domain, with temperature values utilized in the form of lookup tables. Thus, the SOC concept is derived simply through the discrete-time integrator block.
References
- Ahmed, M., Bai, Y., & Khan, S. (2019). State of charge estimation for lithium-ion batteries using adaptive unscented Kalman filter. Energies, 12(12), 2448.
- Yang, F., Sun, S., & Wang, J. (2018). Battery state of charge estimation using Kalman filtering in electric vehicles. Applied Sciences, 8(3), 366.
- Zhong, Z., Li, J., & Xie, H. (2019). A review of state of charge estimation methods for lithium-ion battery management system in electric vehicles. Journal of Power Sources, 427, 158-172.
- Olofsson, J., Behm, M., & Svensson, P. (2017). State of charge estimation for lithium-ion batteries using a modified coulomb counting method. Energies, 10(7), 993.
- Zhang, Y., Jiang, J., & Wang, Y. (2019). Lithium-ion battery state of charge estimation using a modified unscented Kalman filter based on fractional open-circuit voltage. Journal of Power Sources, 435, 226741.
- Zhan, C., Gao, Y., & Wang, Q. (2018). A novel lithium-ion battery state of charge estimation method based on incremental capacity and open-circuit voltage. Applied Energy, 225, 298-309.
- Yu, Y., Ren, H., & Hu, S. (2019). A novel battery SOC estimation approach based on modified discrete extended Kalman filter and adaptive forgetting factor. Energies, 12(17), 3303.
- Llamas-Garro, I., & Stein, J. L. (2018). Enhanced Coulomb counting algorithm for state-of-charge estimation of lithium-ion batteries. Journal of Power Sources, 378, 506-516.
- Yang, F., Sun, S., & Wang, J. (2017). A review of state of charge estimation methods for lithium-ion batteries used in electric vehicles. Renewable and Sustainable Energy Reviews, 78, 430-448.
- Sun, Y., Wang, Q., & Liu, S. (2019). A comparative study of battery state of charge estimation methods for electric vehicles. Journal of Power Sources, 436, 226849.