Week 7 State of charge estimation
A}
Result of Simulink model – CASE 1
A lamp showing a green signal means that case one is fault free.
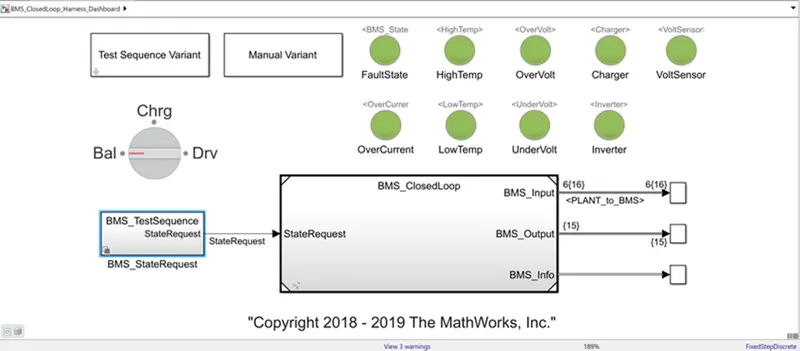
Graphs are shown below:
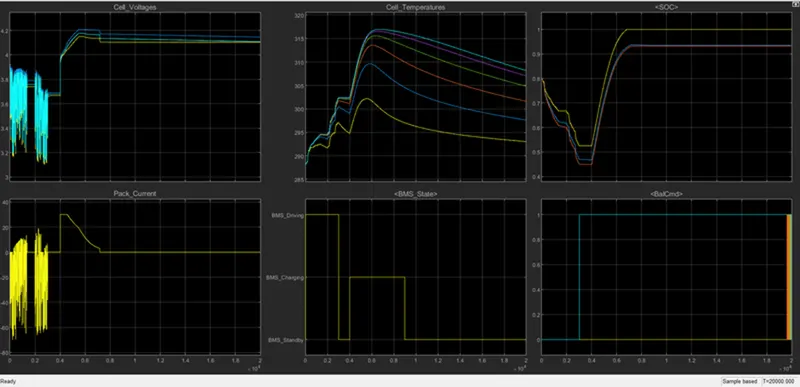
- Driving (Discharging) mode (0-3000 sec)
- All the cells for the first 3000 sec are in the driving mode so the discharge of all the cells occurs and it varies in the range of 3.1 to 3.9 V (min and max.).
- Cell temperature increases from 288K to 302 K.
- SOC also reduces from 80 % to 45% for EKF technique.
- Balancing mode (3000-4000 sec)
After 3000sec for 1000 sec, cell balancing occurs and the Modules are in standby mode and they are having constant voltage near about 3.7V.
Cell temperature reduces slowly as no current flow through the cells during balancing. SOC is also constant during this period i.e. 45% for EKF technique.
- Charging and Balancing (4000- 9000 sec)
After 4000 sec the charging occurs and the cell voltages increased from 3.7 to nearly about 4.2 V in Constant current mode with current of nearly 30A then the constant voltage charging starts and the current reduces from 30A to 2.6 A Charging and balancing of cells occur till 9000 sec.
Cell temperature also starts to increase exponentially up to the constant current region and reduces as current up to the reduces in constant voltage mode. SOC also increases from 45% to 94% in this mode for EKF technique.
- Post charge Balancing (9000- 20000sec)
After 9000 sec the post-cell balancing starts under standby mode. Cell temperature reduces in this mode and tries to reach the ambient temperature. SOC remains constant to 94%.
Result of Simulink model – CASE 2
A lamp showing a green signal means that case one is fault free.
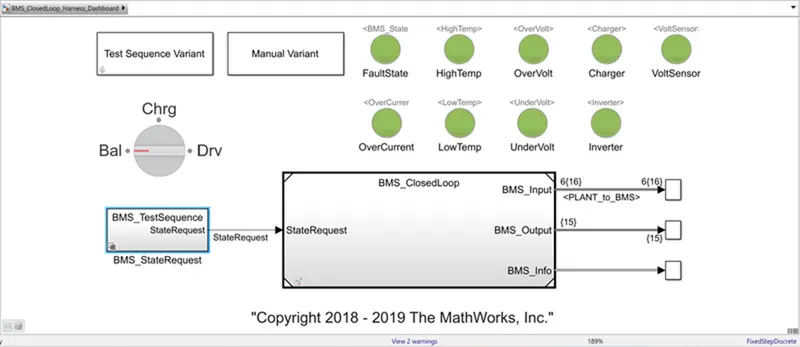
Graphs are shown below:
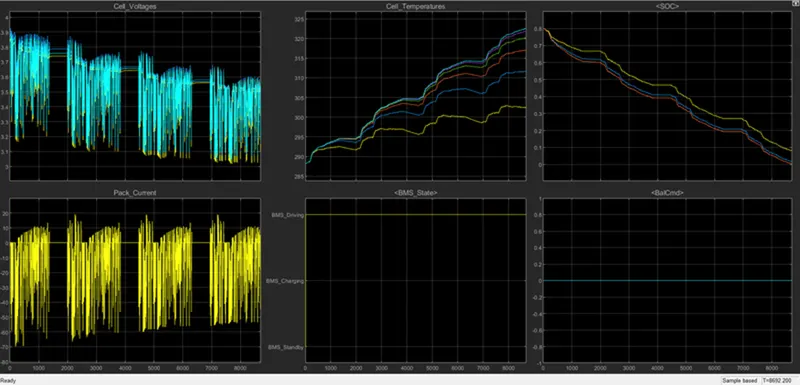
- In case 2 there is no cell balancing performed or not given any variations
- Cell voltage and current variation is more
- Temperature goes on continues increasing and also SOC is going from 100% to 0% its means that the battery fully discharged.
Result of Simulink model – CASE 3
A lamp showing a green signal means that case one is fault free.
Graphs are shown below:
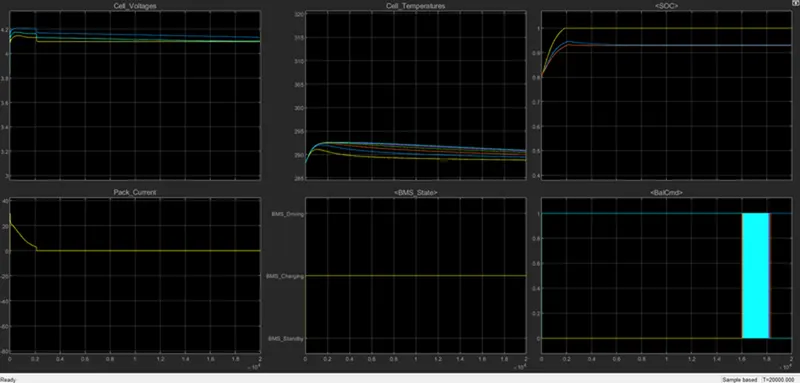
Results:
- Cell Voltages increase from their initial values and after 2000 sec they got constant.
- Pack current initially starts from 0 to 30A and then starts decreasing when the constant voltage mode is there to 2.5 A and got fully charged up to 2000 sec.
- SOC was initially 80% and in 2000 sec it got fully charged which is 100%.
- Cell temperature starts to increase initially and when the battery got fully charged then decreases down to the ambient temperature.
B}
The Coulomb counting method
The Coulomb counting method measures the discharging current of a battery and integrates the discharging current over time in order to estimate SOC. The coulomb counting method is done to estimate the SOC(t), which is estimated from the discharging current, I(t), and previously estimated SOC values, SOC (t-1). SOC is calculated by the following equation:
SOC(t) = SOC(t-1) + (I(t)/Qn) * Temp.Deff
But there are several factors that affect the accuracy of the Coulomb counting method including temperature, battery history, discharge current, and cycle life.
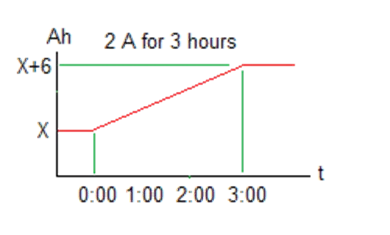
If the initial charge in the battery is known, from then on "Coulomb Counting" can be used to calculate its SOC. For example, a 2 A current into a battery, for 3 hours, will add 2 * 3 = 6 Ah to the battery charge. If the battery capacity is 24 Ah, that will increase its SOC by 6 / 24 = 25 %.
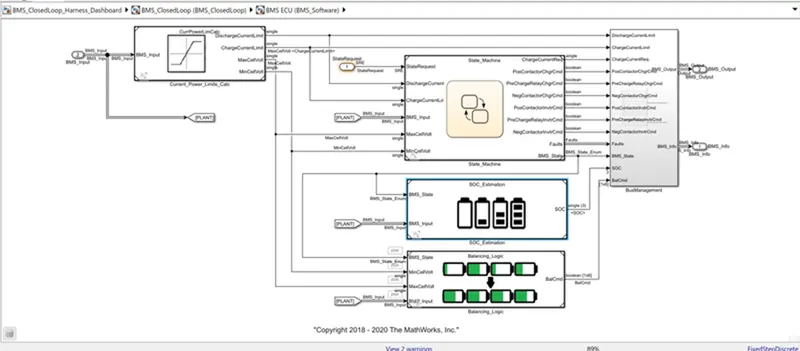
Here we see that there are three methods for calculation of SOC estimation and these are:-
- Coulomb counting
- Unscented Kalman filter
- Extended laman filter.