Week 7 State of charge estimation
ANS 1:
OBJECTIVE:
The objective here is to download a specified project mentioned in the question made by Matlab devs, open the project in Matlab, run the model in Simulink with three different scenarios and observe the results differences.
OPERATION:
- Step1: Download the project file from https://in.mathworks.com/matlabcentral/fileexchange/72865-design-and-test-lithium-ion-battery-management-algorithms
- Step2: Unzip the file.
- Step3: Open the project and model in Matlab.
- Step4: Open the model named BMS_Closedloop_Harness_dashboard.slx and wait till opens the model in Simulink.
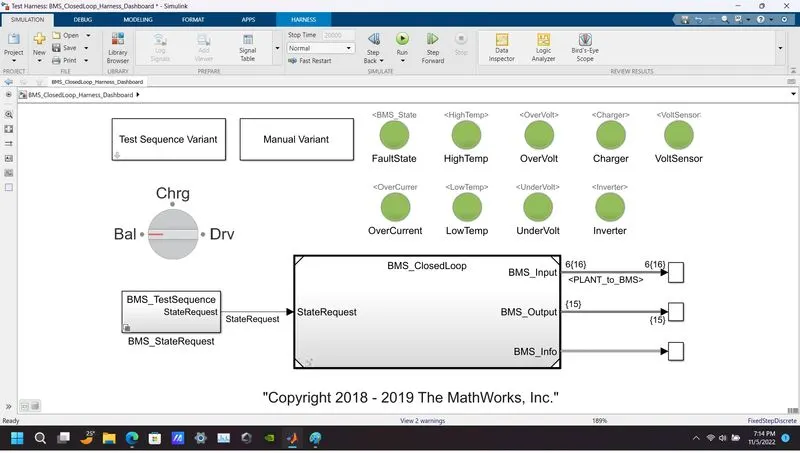
- Step5: Find a block named Test sequence variant and observe here test sequence can be changed to 1,2 & 3
- Step6: Now run the model for 20000 sec for all the three sequences mentioned above.
- Step7: Observe the difference between the results.
MODEL EXPLANATION:
In brief, this model explains,
- This model includes two variants of Battery Pack (1. One module with 6 cells in series, 2. 16 modules with 96 cells in total).
- Battery Pack is connected to Charger / Load via Precharge Circuit and contactors. Closing or opening precharge contactors is done by BMS.
- Each cell in the battery pack is connected to BMS.
- Required interlocking is done between BMS and Charger.
- Several indicators were added which were powered by a battery source and operated through BMS with the help of a signal module found inside BMS.
RESULTS:
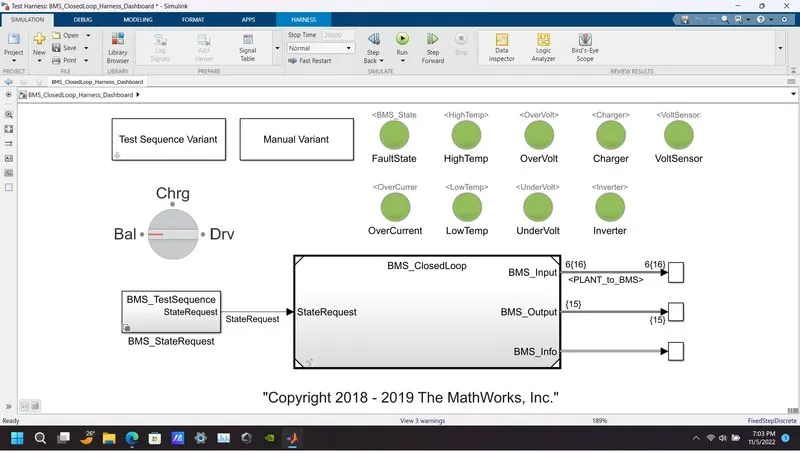
- BMS_Closed_Loop_Harness dashboard. slx is the full model. It consists of the test sequence variant subsystem which holds three different test cases.
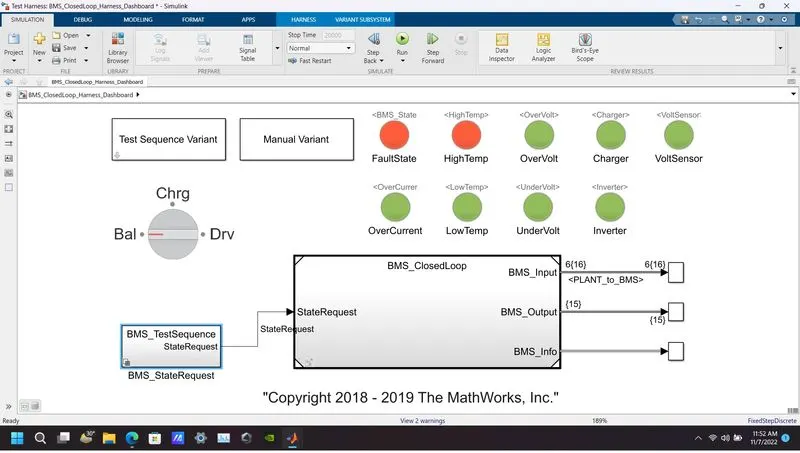
- This dashboard also helps in determining the fault states and other parameters. The green color indicates that the system is working without any errors while the red signal indicates a fault in the system.
- In order to change test sequence variant first find a block (subsystem) named test sequence variant then open it and choose test case appropriately.
Commencing first test sequence variant:
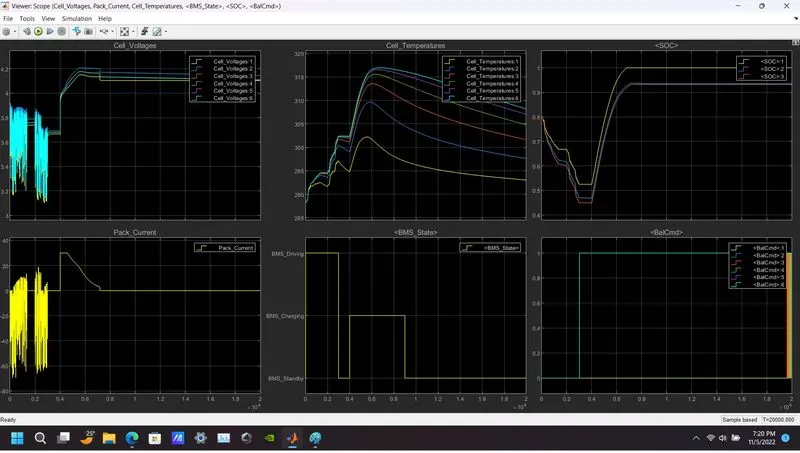
- No-Fault found.
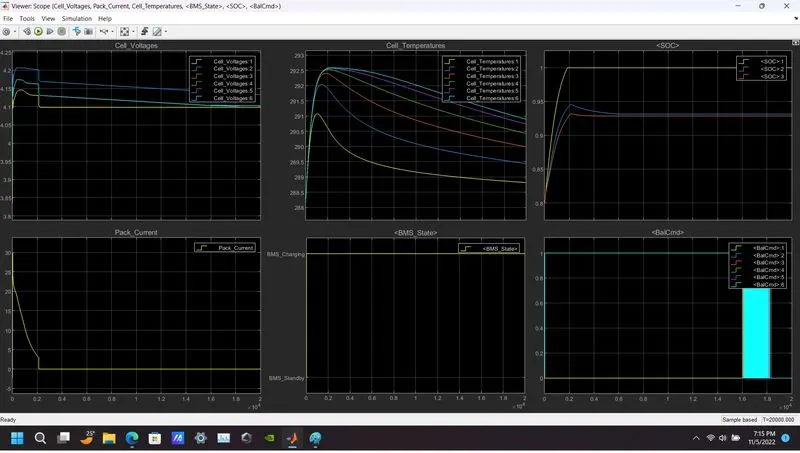
- In the output graph cell voltage, cell temperature, soc, battery pack current, BMS State, and balancing were shown.
Commencing second test sequence variant:
- Two Faults found. (BMS state fault and High temperature)
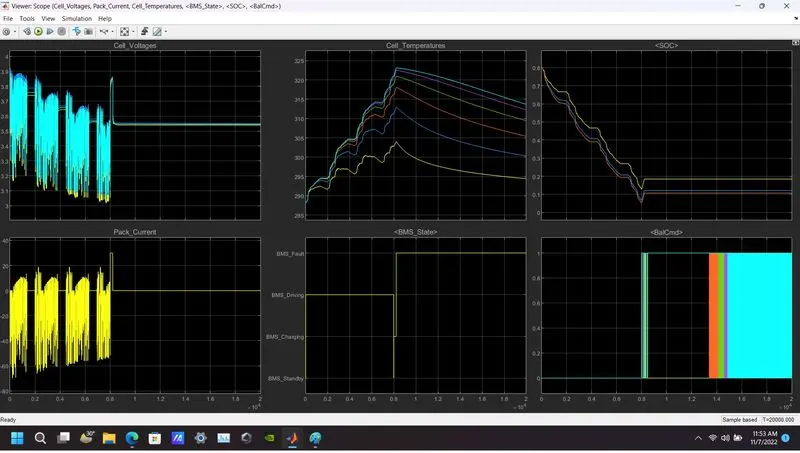
- In the output graph cell voltage, cell temperature, soc, battery pack current, BMS State, and balancing were shown.
Commencing third test sequence variant:
- No-Fault found.
- In the output graph cell voltage, cell temperature, soc, battery pack current, BMS State, and balancing were shown.
OBSERVATION:
Observation of all test sequences:
| STATE SEQUENCE | BMS STATE | PACK CURRENT | CELL VOLTAGE(1 TO 6) | CELL TEMPERATURE (1 TO 6) IN kELVIN | SOC(%) |
| 1 | DRIVING (0 TO 3000 SEC) | 60 AMP APPROX. (BATTERY DISCHARGING) | DISCHARGING FROM 3.9VDC TO 3.1 VDC APPROX. | INCREASING FROM 285k TO 300k | REDUCING FROM 80% TO 45% |
| 1 | STAND BY (3000 TO 4000 SEC) | 0 AMP | 3.7 VDC EACH APPROX | 300K | 45% |
| 1 | CHARGING(4000 TO 9000 SEC) |
CONSTANT 30 AMP (4000 TO 4500 SEC) GRADUALLY DECREASED FROM 30 TO 3 AMP (4500 TO 9000 SEC) |
CHARGING FROM 3.7 TO 4.2 VDC APPROX | INCREASING FROM 300k TO 317k | INCREASING FROM 45% TO 100% |
| 1 | STAND BY (9000 TO 20000 SEC) | 0 AMP | 4.1 VDC APPROX | DECREASING FROM 317k TO 295k | 100 TO 99% |
| 2 | DRIVING (0 TO 8000 SEC) | 52 AMP APPROX. (BATTERY DISCHARGING) | DISCHARGING FROM 3.6 TO 3.0 VDC | INCREASING FROM 285k TO 320k | REDUCING FROM 100% TO 0.5% |
| 2 | CHARGING ( 8000 TO 8200 SEC) | CONSTANT 30 AMP (BATTERY CHARGING) | CHARGING FROM 3.0 TO 3.85 VDC | INCREASING BEYOND 325 K THUS THERMAL TRIP FROM BMS WHICH CAUSING BMS STATE FAULT | INCREASING FROM 0.5% TO 19% |
| 2 | FAULTY (8200 TO 20000 SEC) | 0 AMP | 3.85 VDC | DECREASING FROM 325K TO 295K | 19% APPROX. |
| 3 |
CHARGING (0 TO 20000) [CV CHARGING] |
MAX CHARGING AT 25 AMP MIN CHARGING AT 3 AMP |
CHARGING FROM 4.1VDC TO 4.2VDC | INCREASING FROM 288K TO 290K | FROM 80% TO 100% |
There is one small change in the model that is required for perfect results after simulation. I have noticed that BMS test case 2 has two steps,
- Driving (0-10000sec)
- Charging(10001-20000sec)
But During the driving state one of the cell among six cells died(SOC reaches 0%) at 8692 sec. and causing cut off the battery from the load through BMS thus Matlab is unable to simulate the model beyond 8692sec even though the simulation run time is fixed at 20000sec by this project devs. As a result the battery never gets to the charging state which starts from 10000sec so I have changed the transition time from driving to charging at 8000sec to avoid the battery soc hitting 0%.
ANS 2:
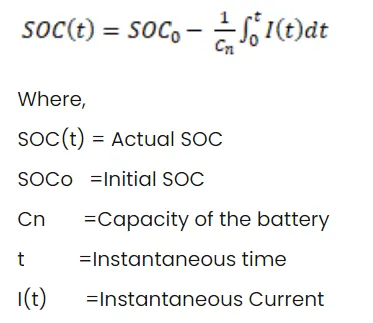
COULOMB COUNTING: The Coulomb counting method measures the discharging current of a battery and integrates the discharging current over time in order to estimate SOC. Coulomb counting method is done to estimate the SOC values, which is estimated from the discharging current and previously estimated SOC values, SOC is calculated by the following equation:
The below mentioned subsystem can be found ine the SOC estimation subsystem inside BMS ECU
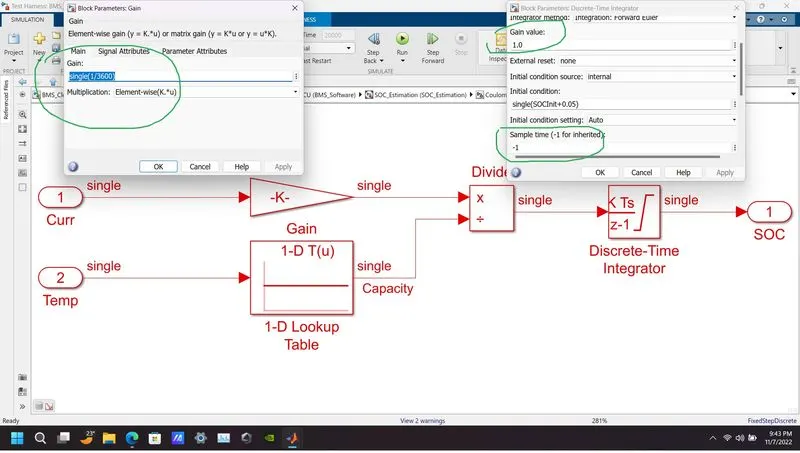
Blocks used:
- GAIN BLOCK
- DIVIDE BLOCK
- DESCRETE TIME INTEGRATOR BLOCK
- 1-D LOOK UP TABLE
Model explanation:
- Current and Temperature as inputs and SOC as output.
- In gain current is multiplied by 1/3600 to get amphour.
- That current is divided by the capacity due to temperature change and then intregrated with the gain value of 1 with sample time of -1 as discrete type integrator is used here.
- The saturation limits are given which are 1 to 0. So that we get the SOC value from 0 to 1 multiplied with 100 to get percentage of SOC