Week 7 State of charge estimation
Simulation of closed-loop BMS-
The BMS model consist of a BMS ECU (electrical control unit) and a plant. The control unit with its various monitoring and control algorithms is connected to a block with the representation of the battery pack and associated circuitry and peripherals.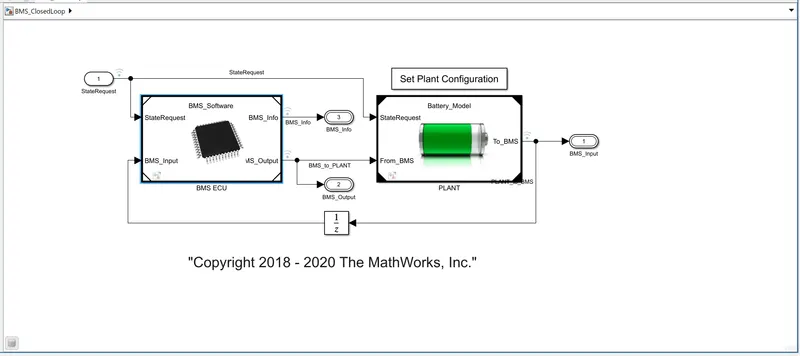
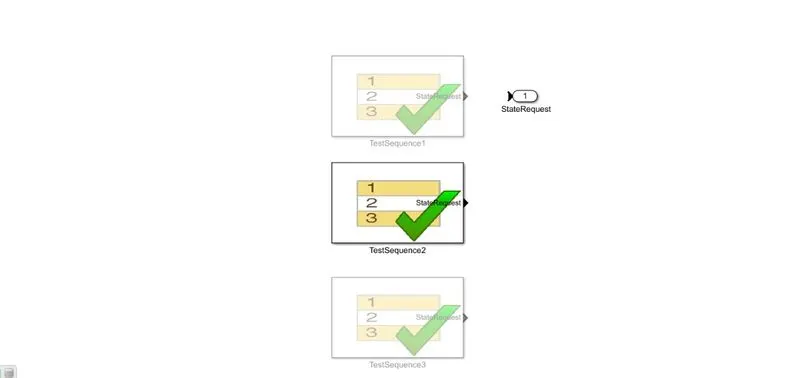
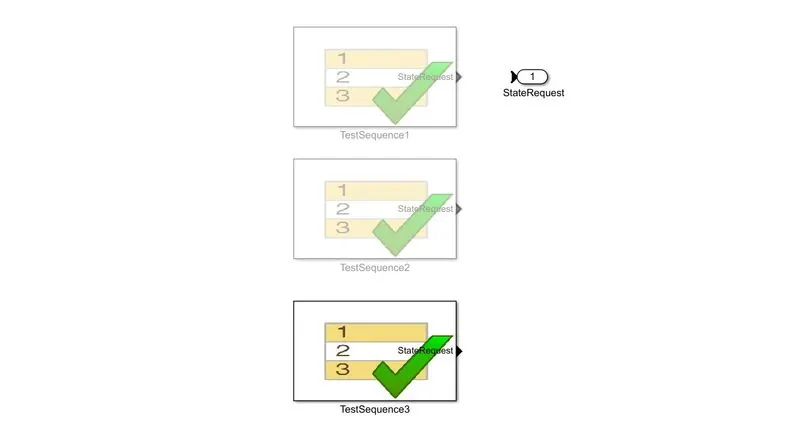
The harness dashboard is used to control and identify the test case states in the state machine. It consists of the test sequence variant subsystem which holds three differant test cases. This dashboard also helps in determining the fault state and other parameters as shown in the diagram below. The green color indicates that the system is working without any errors while the red signal will indicate that there is a fault in the system.
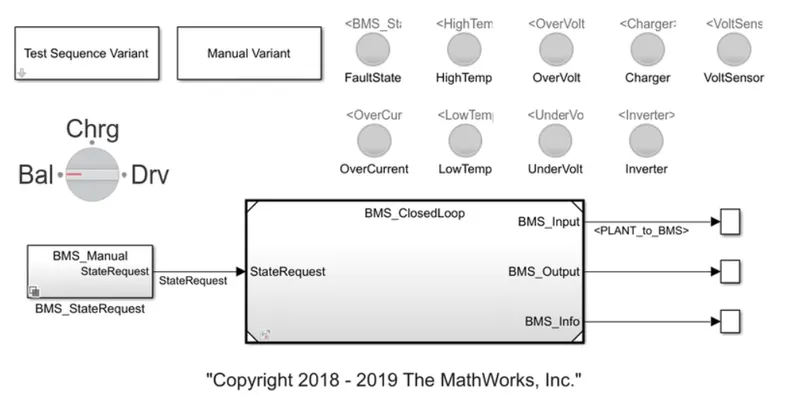
CASE-1: drive-balance-charge-balance, there are no errors and faults
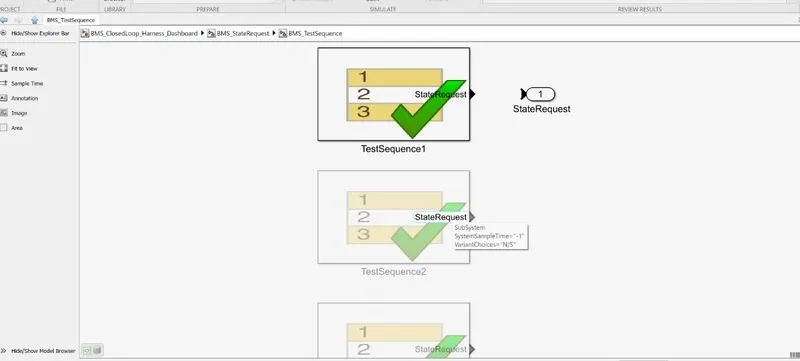
When the simulation begins, initially the vehicle is in a driving state and the SOC will decrease for this time period. After a time period of 3000 seconds. the next step is balancing mode and the vehicle is in standby condition. After another 1000 seconds, the vehicle is in the charging phase and the batterys SOC increases almost to 100%. The next phase is the post charging phase in which the vehicle again goes for the stanfby mode.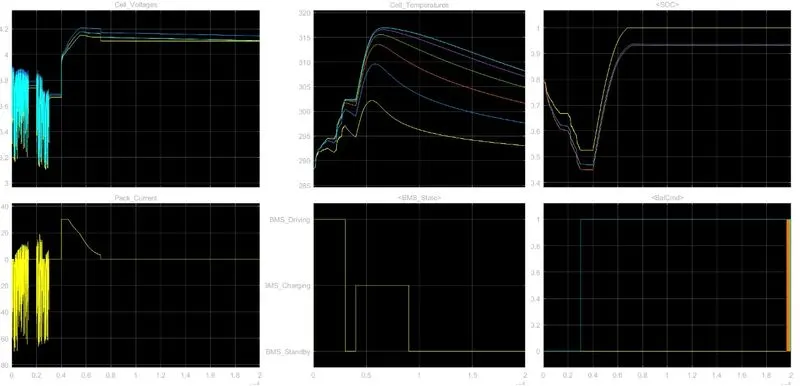
* The input cycle can be seen in the BMS_State plot in which the vehicle initially udergoes driving, then charging till SOC=90% and then later in the standby state.
*During charging the battery pack voltage is increased up to 4.2 V
*The cell temperature increases during the driving and charging cycle and starts falling off in standby mode.
*The SOC drops to less than 50% after the driving cycle and then later put into charging untill SOC reaches 100%.
CASE-2 : Drive-charge, High-temperature fault
After 10000 sec when the driving cycle is over, the fault condition occurs and so the soc does not increase even for the charging phase.
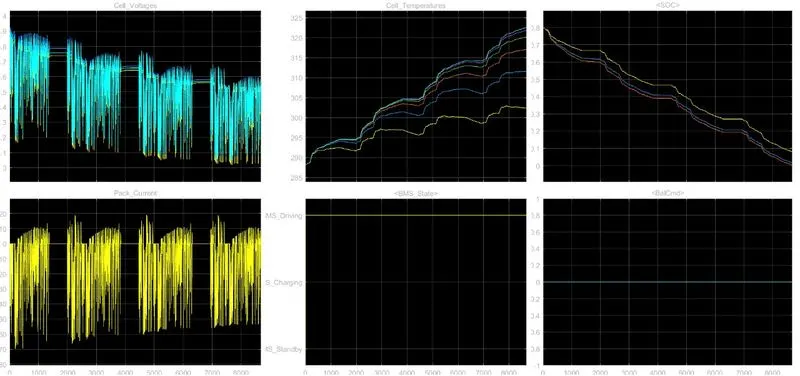
Cell temperature increases during driving, and since it is higher than recommended BMS stops the battery from charging, so we can see a gradual decrease in temperature.
CASE -3:Charging, there is a no fault
The SOC increases from 80 to 100% and then remains in standby mode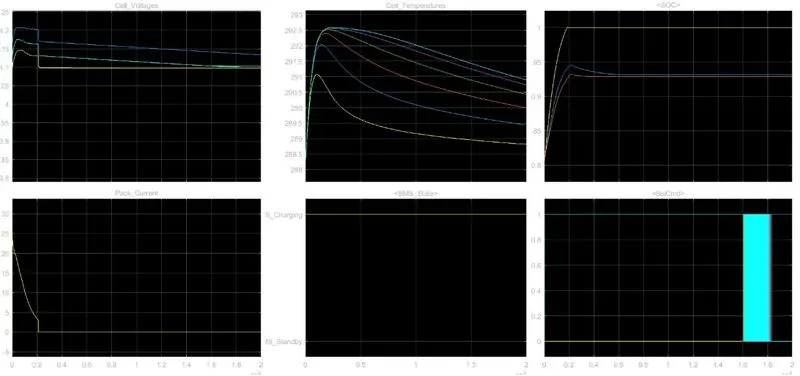
temperature increases during charging and is reduced in the standby state of the BMS.
ANS 2
Coulomb counting
coulomb counting is a technique used to track the state of charge of a battery pack. It works by integrating the active flowing current over over time to derive the total sum of energy entering or leaving the battery pack. This produces a capacity that is typically measured in Amp-hour.
The coulomb counting technique measures the discharging current of a battery and integrates the discharging.
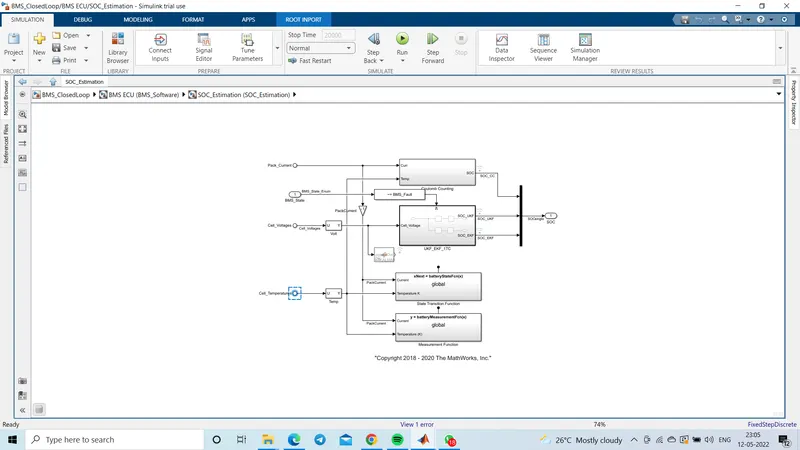
The coulomb counting technique measures the discharging current of a battery and integrates the discharging current over time in order to estimate the SOC. Coulomb counting method is done to estimate the, discharging current and previously estimated SOC values. Integrating the current into or out of battery gives the relative value of its charge.
IMPLEMENTATION OF COULOMB COUNTING FOR SOC ESTIMATION IN THE BMS:
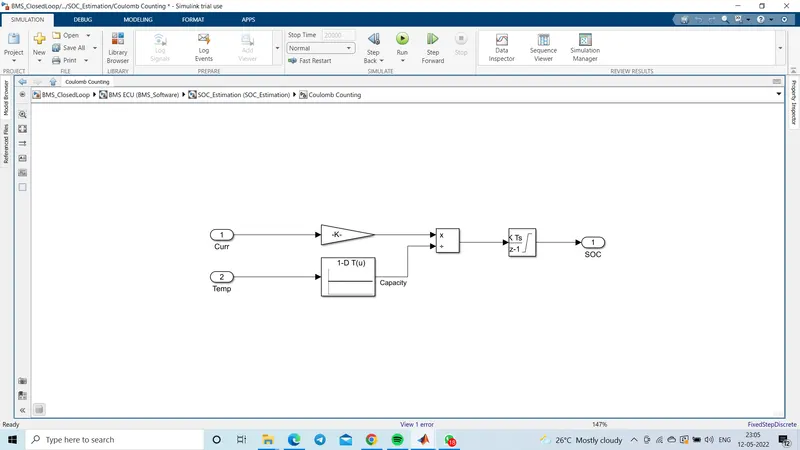
* The discharge current signal is converted from the physical system using a gain block.
* The gain block is integrated and is applied to the integrated signal which gives us the discrete data.
*The temperature data is divide by using a lookup table with the discharge current rate.
* The output is then integrated with a discrete-time integrater block with a sample time to calculate the SOC of the battery pack.