Project 1 - Parsing NASA thermodynamic data
% Project 1 Parsing NASA thermodynamic data
clear all
close all
clc

f1 = fopen('THERMO.dat','r');
for i = 1:5
    a = fgetl(f1);
end

for z = 1:53
Header = fgetl(f1);

b = strsplit(Header,' '); % split the header line
species_name = b{1};
local_low_temp = str2double(b{end-3});
local_High_temp = str2double(b{end-2});
local_medium_temp = str2double(b{end-1});

% Extracting coefficient from first line
line_1 = fgetl(f1); % to get the first line of data
a01 = strfind(line_1,'E');
a1 = str2double(line_1(1:a01(1)+3)); % str2double- convert strings to double precision values
a2 = str2double(line_1(a01(1)+4:a01(2)+3));
a3 = str2double(line_1(a01(2)+4:a01(3)+3));
a4 = str2double(line_1(a01(3)+4:a01(4)+3));
a5 = str2double(line_1(a01(4)+4:a01(5)+3));

% Extracting coefficient from second line
line_2 = fgetl(f1);
a02 = strfind(line_2,'E');
a6 = str2double(line_2(1:a02(1)+3));
a7 = str2double(line_2(a02(1)+4:a02(2)+3));
a8 = str2double(line_2(a02(2)+4:a02(3)+3));
a9 = str2double(line_2(a02(3)+4:a02(4)+3));
a10 = str2double(line_2(a02(4)+4:a02(5)+3));

% Extracting coefficient from third line
line_3 = fgetl(f1);
a03 = strfind(line_3,'E');
a11 = str2double(line_3(1:a03(1)+3));
a12 = str2double(line_3(a03(1)+4:a03(2)+3));
a13 = str2double(line_3(a03(2)+4:a03(3)+3));
a14 = str2double(line_3(a03(3)+4:a03(4)+3));

T = linspace(local_low_temp,local_High_temp,500); % temperature
R = 8.314 ;  % universal gas constant

for j = 1:length(T)
    if T(j)>= local_medium_temp
        cp(j) = (a1+a2*T(j)+a3*T(j)^2+a4*T(j)^3+a5*T(j)^4)*R;
        h(j) = (a1+(a2*T(j))/2+(a3*T(j)^2)/3+(a4*T(j)^3)/4+(a5*T(j)^4)/5+(a6/T(j)))*R*T(j) ;
        s(j) = (a1*log(T(j))+a2*T(j)+(a3*T(j)^2)/2+(a4*T(j)^3)/3+(a5*T(j)^4)/4+a7)*R ;
    else
        cp(j) = (a8+a9*T(j)+a10*T(j)^2+a11*T(j)^3+a12*T(j)^4)*R;
        h(j) = (a8+(a9*T(j))/2+(a10*T(j)^2)/3+(a11*T(j)^3)/4+(a12*T(j)^4)/5+(a13/T(j)))*R*T(j) ;
        s(j) = (a8*log(T(j))+a9*T(j)+(a10*T(j)^2)/2+(a11*T(j)^3)/3+(a12*T(j)^4)/4+a14)*R ;

    end
end
MW(z)=mole_weight(species_name);
mkdir('C:\Users\DELL\OneDrive\Desktop\temp_programe',species_name) % make a new folder(manage files and folders)
cd(species_name) % include directories description specify a list of folder paths

%plotting
% plot between Temperature and Specific Heat
figure(1)
plot(T,cp,'LineWidth',3,'Color','b')
title(species_name)
xlabel('TEMPERATURE')
ylabel('SPECIFIC HEAT')

% plot between Temperature and Enthalpy
figure(2)
plot(T,h,'LineWidth',3,'Color','g')
title(species_name)
xlabel('TEMPERATURE')
ylabel('ENTHALPY')

% plot between Temperature and Entropy
figure(3)
plot(T,s,'LineWidth',3,'Color','r')
title(species_name)
xlabel('TEMPERATURE')
ylabel('ENTROPY')

%saving the the figures of specific heat, enthalpy, entropy of each species
saveas(figure(1),'specific_heat.png')
saveas(figure(2),'enthalpy.png')
saveas(figure(3),'entropy.png')
cd('C:\Users\DELL\OneDrive\Desktop\temp_programe') % change the current folder


end
Calculation of thermodynamic Properties:
% Function Program : calculating thermodynamic properties
% (specific heat, Enthalpy, Entropy)

T = linspace(local_low_temp,local_high_temp,500)
function [cp,h,s] = coeff(a1,a2,a3,a4,a5,a6,a7,a8,a9,a10,a11,a12,a13,a14,T)

R = 8.314   % universal gas constant

for j = 1:lenght(T)
if T(j)>= local_medium_temp
        cp(j) = (a1+a2*T(j)+a3*T(j)^2+a4*T(j)^3+a5*T(j)^4)*R;
        h(j) = (a1+(a2*T(j))/2+(a3*T(j)^2)/3+(a4*T(j)^3)/4+(a5*T(j)^4)/5+(a6/T(j)))*R*T(j) ;
        s(j) = (a1*log(T(j))+a2*T(j)+(a3*T(j)^2)/2+(a4*T(j)^3)/3+(a5*T(j)^4)/4+a7)*R ;
    else
        cp(j) = (a8+a9*T(j)+a10*T(j)^2+a11*T(j)^3+a12*T(j)^4)*R;
        h(j) = (a8+(a9*T(j))/2+(a10*T(j)^2)/3+(a11*T(j)^3)/4+(a12*T(j)^4)/5+(a13/T(j)))*R*T(j) ;
        s(j) = (a8*log(T(j))+a9*T(j)+(a10*T(j)^2)/2+(a11*T(j)^3)/3+(a12*T(j)^4)/4+a14)*R ;


    end
end
end
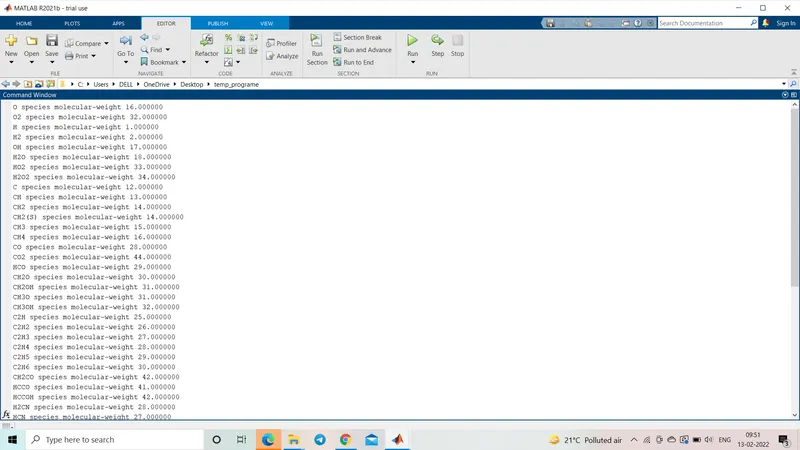
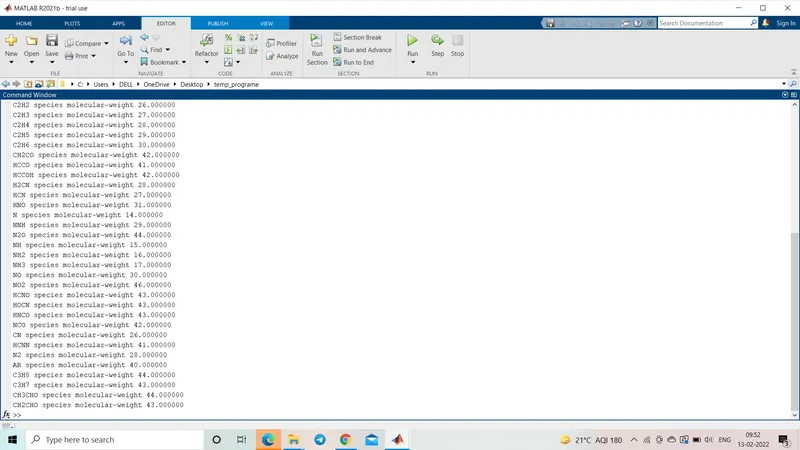
Molecular weight of each species :
% Function Program : Calculating molecular weight of species

function [molecular_weight] = mole_weight(species_name)
molecular_weight =0;
elements = ['H','C','N','O','A'];
atomic_weight = [1 12 14 16 40];

for i = 1 : length(species_name)
    for j = 1 : length(elements)

        if strcmp(species_name(i),elements(j))
            molecular_weight = molecular_weight + atomic_weight(j);
            b = j ;
        end
    end
    k = str2num(species_name(i)); % convert character array to numeric array
    if k > 1
        molecular_weight= molecular_weight + atomic_weight(b)*(k-1) ;
    end
end
fprintf('%s species %s %f \n',species_name,'molecular-weight',molecular_weight)
end
Molecular weight of each species :
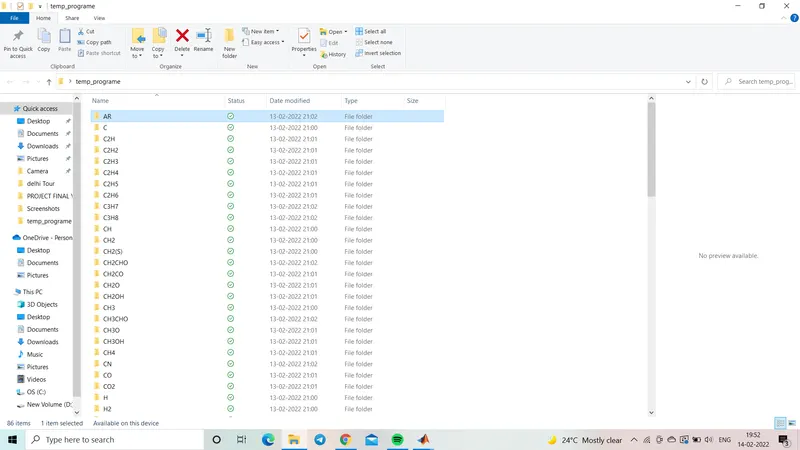
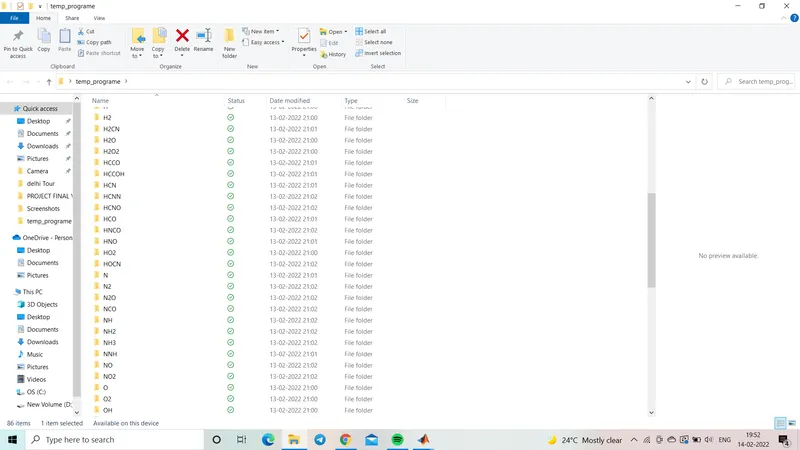
Folders with plottings
Report:
File parsing is done to extract data from the file, it should be as generic as possible to fetch the data from differant files.In this program we are getting the 14 coefficients from the data and by using this we calculate enthalpy, entropy and specific heat for differant species and the condition is that the first 7 coefficients are HIGH-temp coefficients and second 7 coefficients are low temp coefficients.
Calculated the specific heat,enthalpy and entropy using given formulae in the challenge.
Program explanation:
* THERMO.dat file is imported to the program by using the 'fopen' command and each and every line is read by using 'fgetl' command.
* In order to get the header information 'strsplit' command is used to split the string and the local temperature are fetched.
* Next five statements are irrelevant, hence its skipped by the 'fgetl' line inside the for loop.
* Now the species data is read, since there are 53 species and the logic remains the same hence 'for loop' for the 53 species is declared and the main program is given inside the for loop.
* Extracting the coefficients from first line, fgetl command is used to get the first line of data by which we can specify the line_1.
* The species first line contains the species name and the local temp the next three lines contains the coefficients.
* Hence by using the 'strsplit' command the species_name and the local temperatures are obtained.
* In order to get the co-efficients 'strfind' command is used to find the variable 'E' by using this as referance co-efficients are assigned.
* To create a seperate folder to save the plot for every species 'mkdir' command is used.
* For plotting we need a set of temp hence the local species temperature are splitted into a 500 points by using a 'linspace' command.
* To assign the high and low temperature co-efficients each and every local temp. is compared with the local mid temperature.
* Thus by using the formulae specific heat, entropy, enthalpy are calculated and plotting is carried out.
* For saving the plot saveas command is used.
* Cd command is used to change the current folder. Include directories description specify a list of folder paths that contain files to include in the compilled target.
* To find the molecular mass for each and every element atomic weight is assigned now by using the 'strcmp' command each species elements are compared and molecular mass is stored using two 'for loops', one to iterate the species element and to one to compare the elements.
* Finally, the fprintf command is used to display the statements.
Referance :
mathworks.com
http://techterms.com/definition/parse
Errors occured in solving the challenge but ressolved by taking help from support engineer and by doing some research on mathworks.com. Screenshots are attached below.