Week 7 State of charge estimation
1.Simulate the 3 test cases from harness dashboard and write a detailed report on the results
Here we gonna simulate 3 test cases of BMS closed loop harness dashboard by using project file from Matlab file exchange.
https://in.mathworks.com/matlabcentral/fileexchange/72865-design-and-test-lithium-ion-battery-management-algorithms
From this project file, we have to download and extract from zip file to desired folder.
Case1
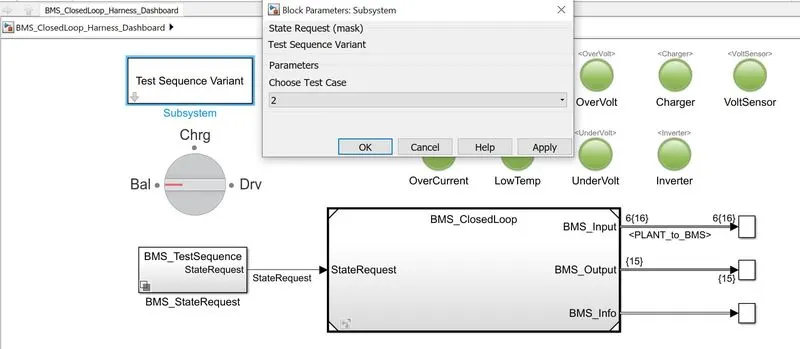
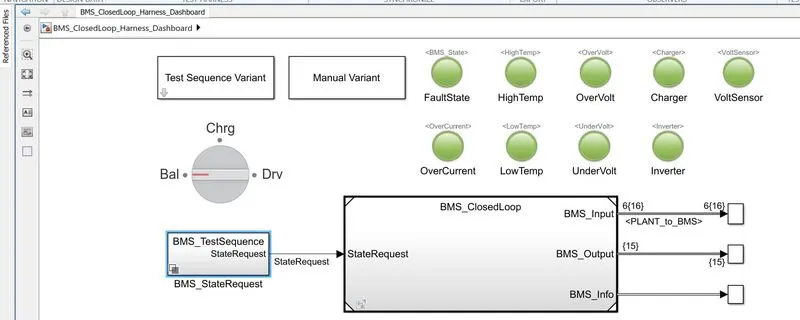
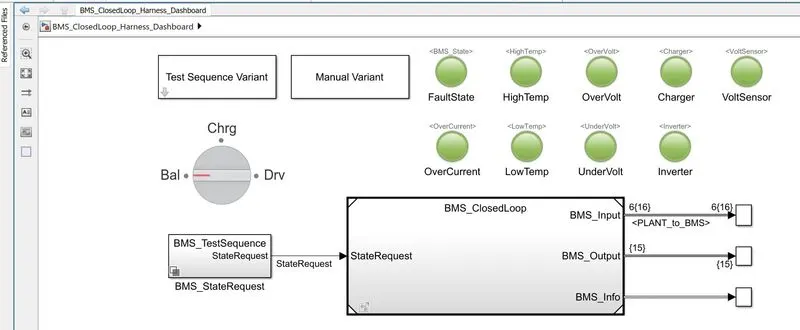
Here the model of BMS closed loop harness dashboard
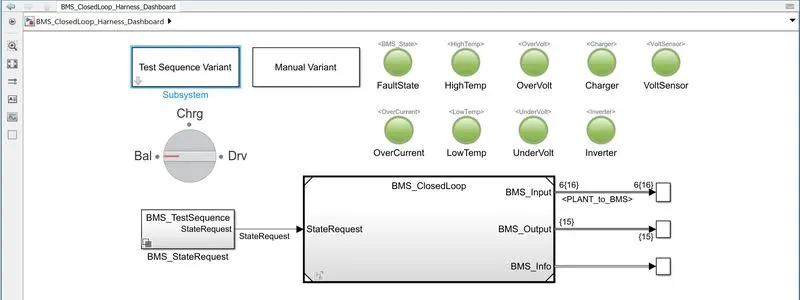
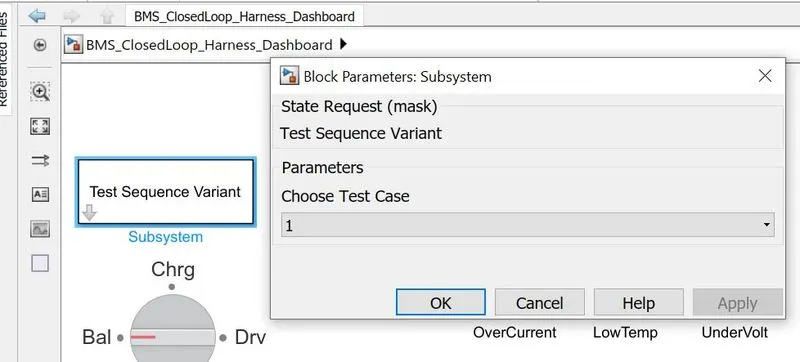
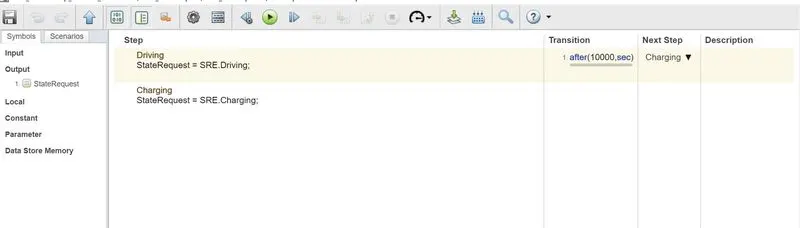
BMS state request block has three number of test sequence
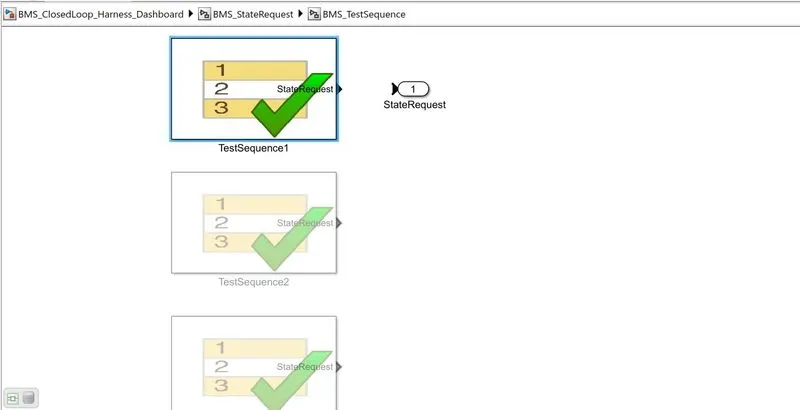
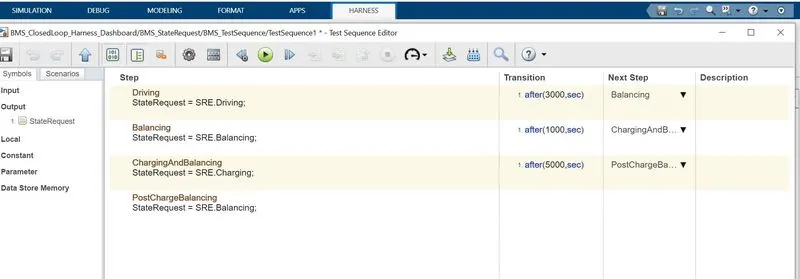
Simulation starts from driving condition for 3000sec, after that it will be in balancing mode for next 1000sec and after 1000sec it will be in charging mode for 5000sec and finally post charging mode occurs
Result:
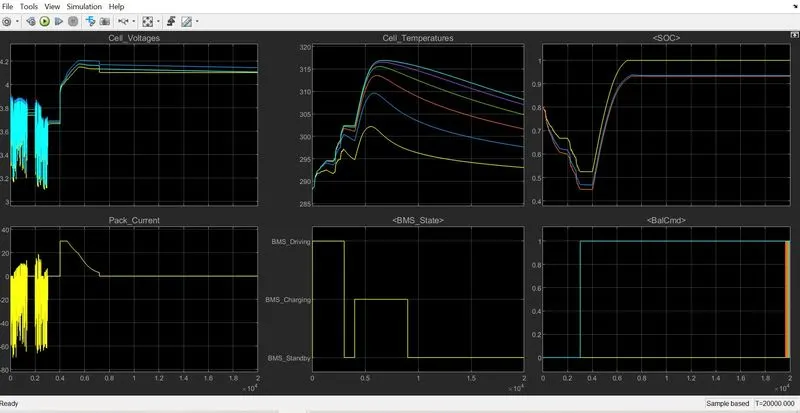
Plot debrief
While driving mode the battery pack discharging for 3000s, while discharging voltage varies from minimum to maximum and when it comes to balancing voltage is constant. afyer 4000s charging occurs here the voltage is rising to around 4.2v and the current is constant and after 4.2v voltage goes on constant but current reduces.
At the end of charging, balancing occurs upto 9000s, after that post charge balancing occurs. here the pack is in standby mode.
In temperature plot, the cell temperature inreases for 3000s for next 1000s temoerature reduces and slightly no current flows through the cell. After 4000s temoerature rises upto constant current region and start reduces as current flows reduces in constant voltage
Afetr 9000s temperature still reduces and remain stable.
In SOC graph battery module has 80% charge
Blue line represents SOC estimation using unscented kalman filter and the red line repesents soc estimated by extended kalman filter, UKF and EKF techniques are more accurate than coulomb counting
While drive mode SOC decreases because of discharging after 3000s SOC is constant, from 4000 to 9000s module in charging mode
CASE 2
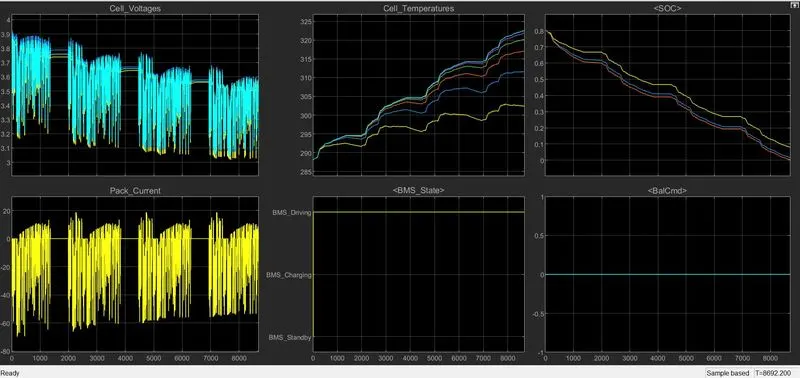
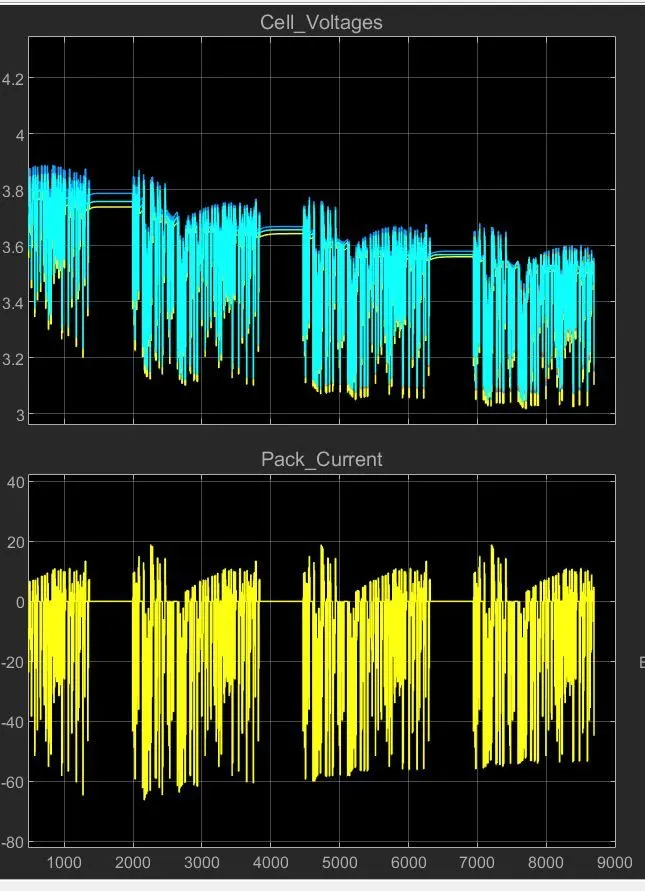
Here cell voltage reduces from maximum as cutoff voltage upto 9000s and the entire capacity drained at 9000s
Cell 1 having lesser temperature and cell6 is having little bit higher than cell1 around 323k
Inbetween the drive modes the cell temperatures are reducing.
Here the SOC reduces from 80 to 0% in entire drive mode as shown in above plot.
SOC remains constant at standby modes.
CASE 3
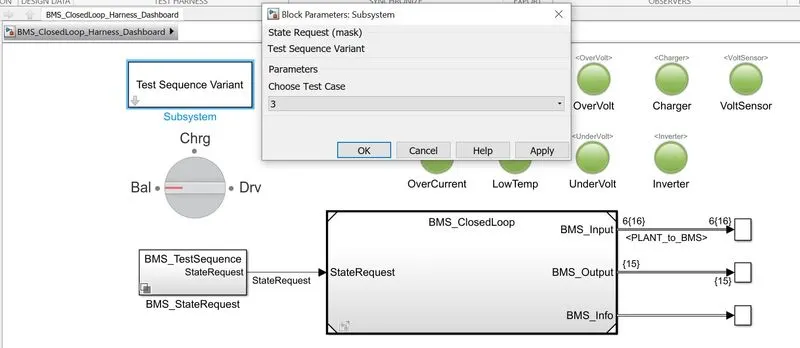

Result
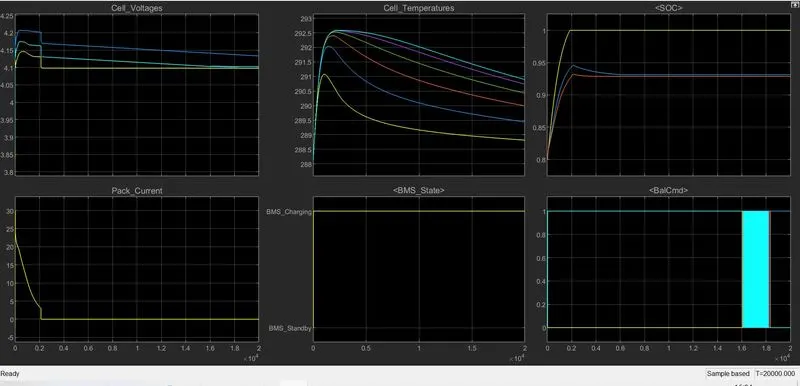
Cell1 rises to 4.2 and stabilised to 4.15v. and cell2 voltage also rises to maximum
The battery pack currrent rising from 0 to 30A and starts to reduce to 2.5 gradually at the end of full charging upto 2000s
At 2000s the pack is fully charged to 100%
After full charge current flow will be cutoff as shown in result plot.
The cell temperature increases upto full charge and after that the temperature started to reduces
In SOC plot SOC gets fully charged at 2000s and remain at full charge for rest of sequence.
The actual SOC is around 93% as shown as full charge shown by UKF and EKF techniques.
Conclusion
Hence from above three test cases performance of BMS on various factors are discussed and analysed.