Week 7 State of charge estimation
1.Simulate the 3 test cases from harness dashboard and write a detailed report on the results
2.What is coulomb counting? Refer to the above model and explain how BMS implements coulomb counting for SOC estimation ?
Matlab Simulik:
model 1:
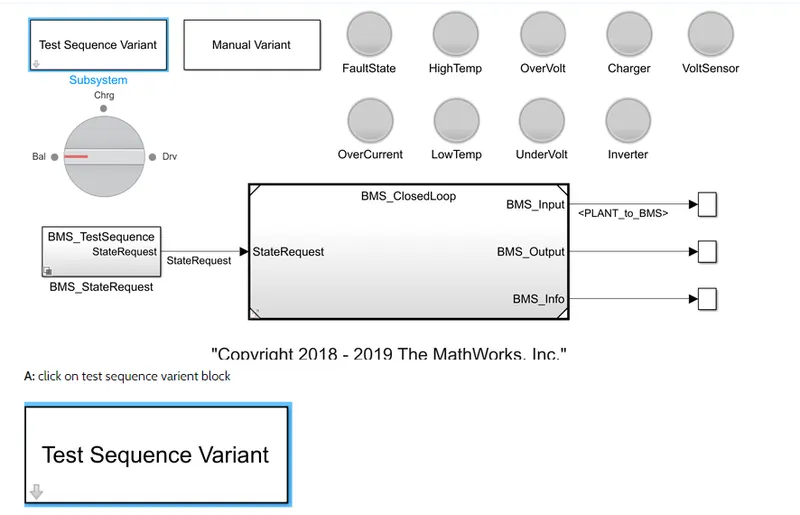
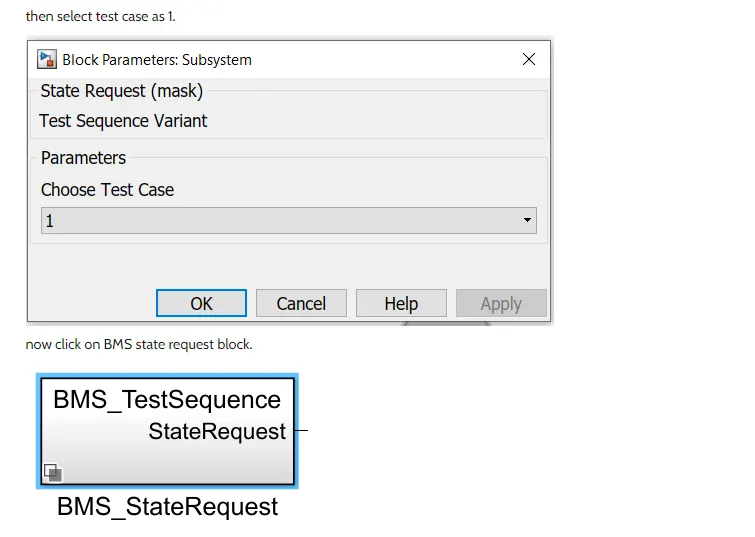
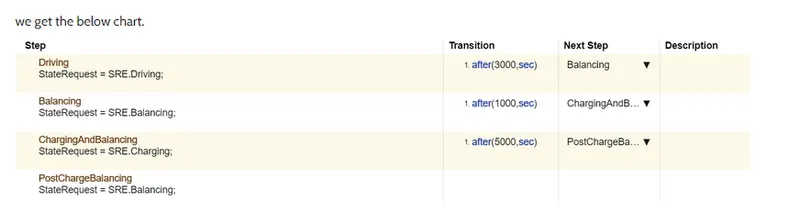
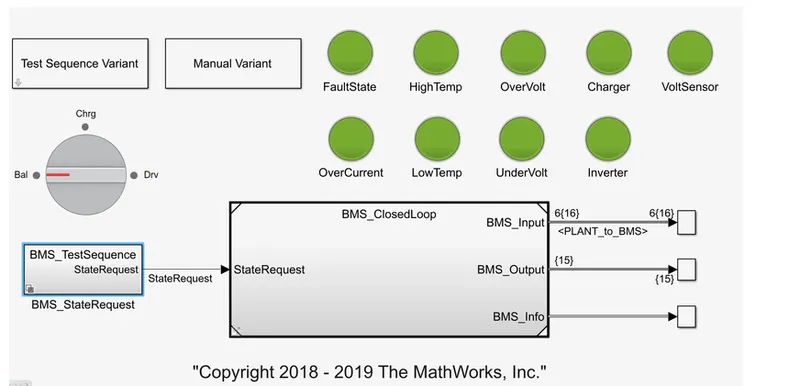
from the above figur we observe that,
driving is for 3000 sec.
then followed by balancing for 1000 sec.
followed by charging and balancing for 4000 sec.
then there is post charge balancing.
by running the simulation,
Results:
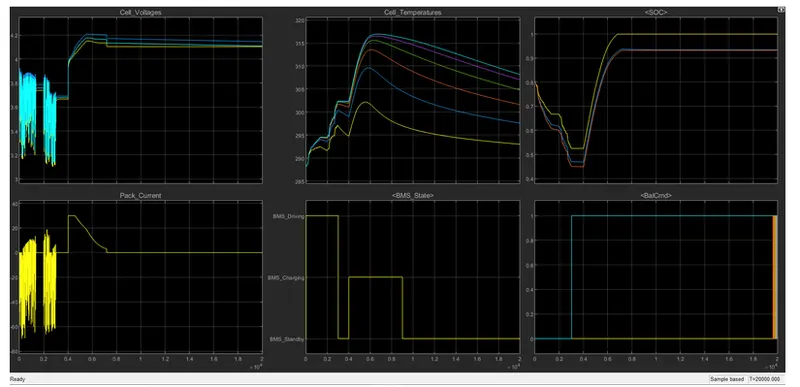
1) the first plot show individual cell voltage,the voltage fluctate between 3.2v to 3.7v between 0-3000 sec.
nominal voltage of cell is 3.7 volt and get decreases to 3.2 volts.
fluctuation of cell voltage from 0-3000 sec show that the vehical is in driving mode.
from 3000-4000 we have balancing mode.
thus cell voltage is get ballanced to 4 volts till 400 sec.
from 4000-8000 sec,there is charging and balancing state.
thus cell voltage is rises to 4.2 volt.
2)Entire battery pack current is shown in pack current graph.
as the current decreases while charging thus the current is -60Amp from 0-3000 sec.
now from 3000-4000 sec,there is cell balancing, thus pack current is get reduced to 0.
and from 4000-8000 sec, there is charging state,thus current increases to 30 Amp.
3) The thirsd graph is cell temp. graph,
the cell temp. increases in driving stage as vehcal is in driving mode then during balancing stage.
the temp. increases suddenly then latter at charging and post charge balancing, the cell temp. shows the reduced behaviour.
4)The BMS stste graph show that durring 0-3000 sec the vehical is in driving mode.
from 3000-4000 sec we have standby mode,
from 4000-8000 sec there is charging state.
5)The SOC graph shows that,
during driving state, SOC reduced from 80% to 45%
during balancing state, SOC is conststnt to 45%
during charging state, SOC increases to 100% and then remain constant..
5)
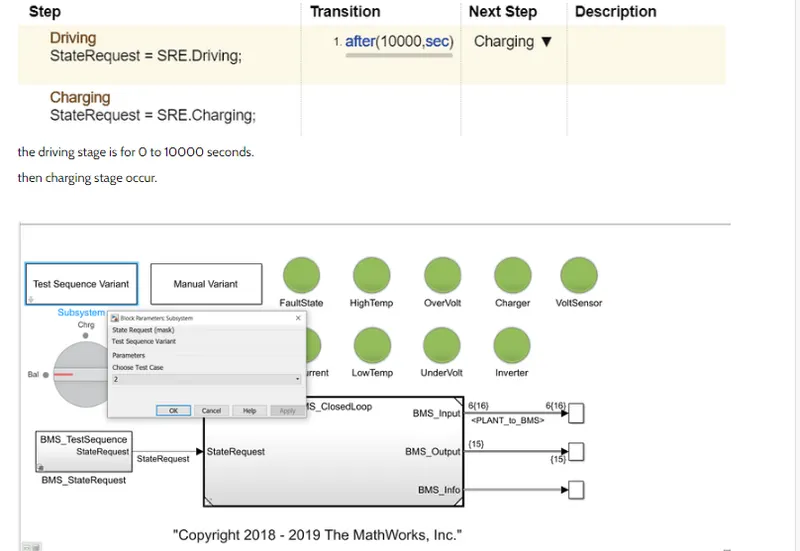
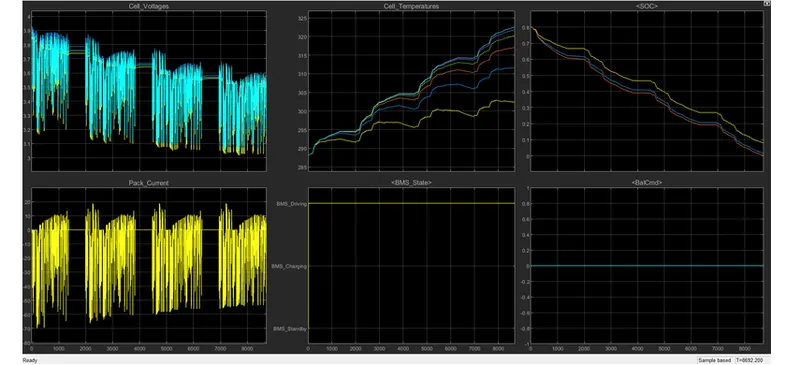
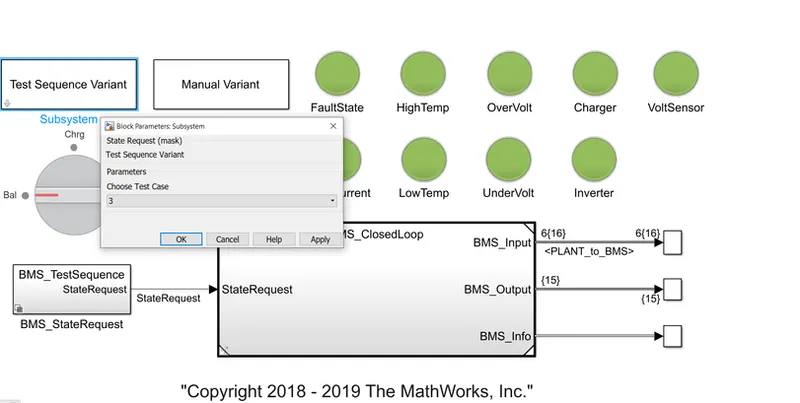
as there is only one stsge that is charging stage,
thus from 0-20000 sec only charging is taken place.
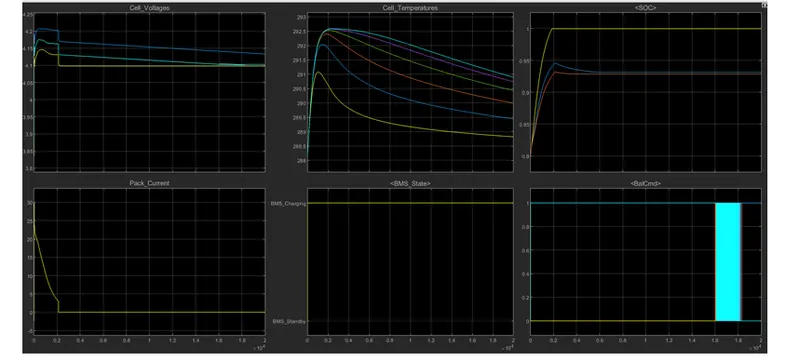
1) the cell voltage is varries till 20000 sec and then remain constant.
2) at start pack current increases to 30 A and tehn reduced to 0A at 2000 sec and then remain constat at 0A.
cell temp.varries as shows in graph
3)as there is only charging stage,thus BMS show only BMS charging.
4)As only charging takes place,thus SOC was 80% at first,then SOC increases to 100% in 2000 sec then SOC remain constatnt at 100%.
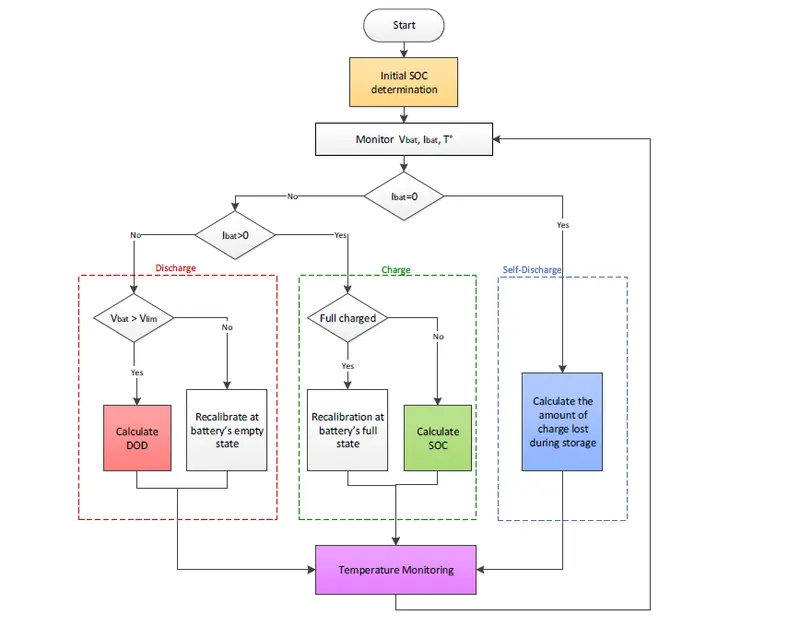
2.What is coulomb counting? Refer to the above model and explain how BMS implements coulomb counting for SOC estimation ?
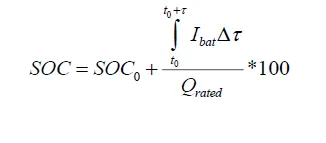
Coulomb-counting based algorithms are often used as a core technology for battery SOC estimation in BMS. They express the SOC as the ratio of available capacity to the
nominal one. The remaining capacity in a battery can be calculated by measuring the current flow rate (charging/discharging) and integrating it over the time interval Δτ.
The common equation to calculate the SOC is given by
where,





FLOW CHART FOR PROPOSED ALGORITHM