Week 7 State of charge estimation
Week 7: State of charge estimation
1.Simulate the 3 test cases from harness dashboard and write a detailed report on the results.
Simulation of Closed-loop BMS
Ans: In The below BMS model it consists of a BMS ECU (Electrical Control Unit) and a plant.
The control unit with its various monitoring and control algorithms is connected to a block with the representation of the battery pack and associated circuitry and peripherals.
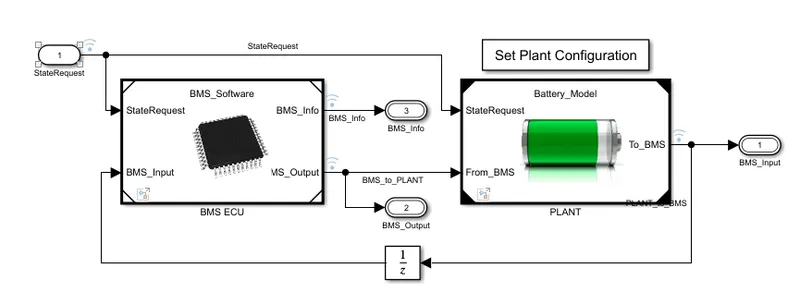
State Machine in the BMS ECU defines the main operating state of the BMS. The state machine has four parallel states (parallel meaning that they can be active at the same time):
- The first one defines the variable BMS_State which indicates standby, driving, charging, and fault. Charging comprises constant current and constant voltage stages.
- The second state switches the fault state ON in case a current, voltage, or temperature value reaches an unsafe level.
- The third and fourth states define the contactor ON and OFF switching sequence for the charger and inverter. This is needed to avoid an excessively large current inrush at the beginning of the charging stage.
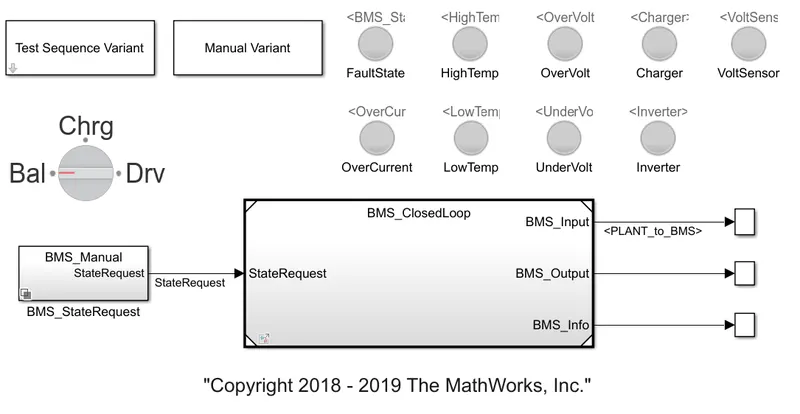
The harness dashboard is used to control and identify the test case states in the state machine. It consists of the test sequence 1 2 and 3 variant subsystem which holds three different test cases. This dashboard also helps in determining the fault states and other parameters as shown in the diagram below. The green color indicates that the system is working without any errors while the red signal will indicate that there is a fault in the system.
CASE-1: drive-balance-charge-balance , there are no errors and faults.
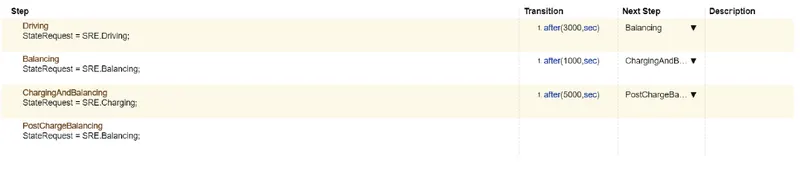
When the simulation begins, initially the vehicle is in a driving state and the SOC will decrease for this time period. After a time period of 3000seconds, the next step is balancing mode and the vehicle is in standby condition. After another 1000 seconds, the vehicle is in the charging phase and the battery's SOC increases almost to 100%. The next phase is the post charging phase in which the vehicle again goes for the standby mode.
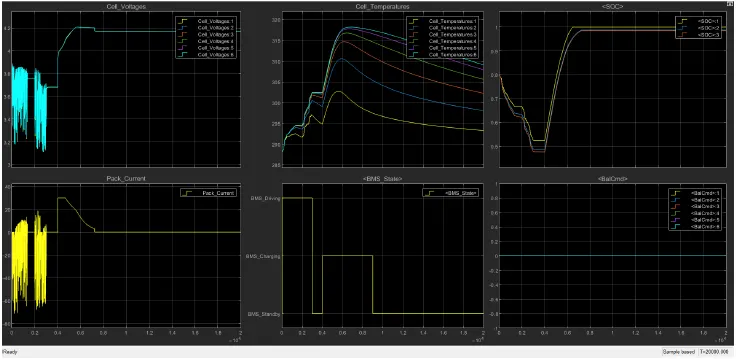
- The input cycle can be seen in the BMS_State plot in which the vehicle initially undergoes driving, then charging till SOC= 90% and then later in the standby state.
- During Charging the Battery pack voltage is increased up to 4.2V.
- The cell temperature increases during the driving and charging cycle and starts falling off in standby mode.
- The SOC drops to less than 50% after the driving cycle and then later put into charging until SOC Reaches 100%.
- The current supplied to the EV during the driving phase can be seen in the current plot.
CASE-2:Drive-charge , High-temperature fault

After 10,000 sec when the driving cycle is over, the fault condition occurs and so the SOC does not increase even for the charging phase.
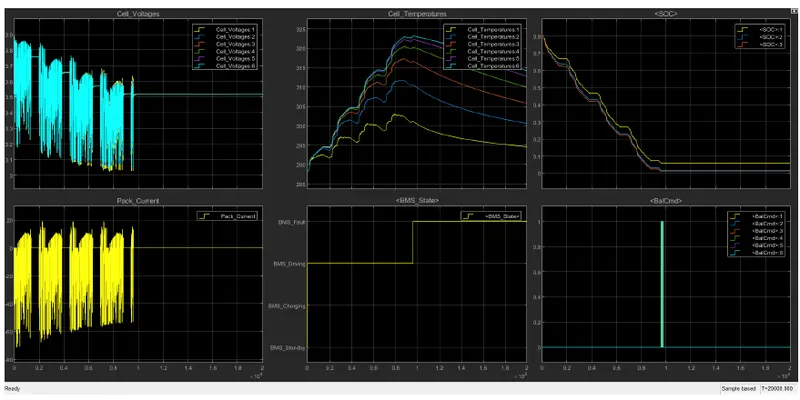
- While driving the cell temperature increases because the continusly driving the temperature changes, and since it is higher than recommended, BMS stops the battery from charging, so we can see a gradual decrease in temperature
CASE-3:charging, there is no fault

the SOC increases from 80 to 100% and then remains in standby mode.
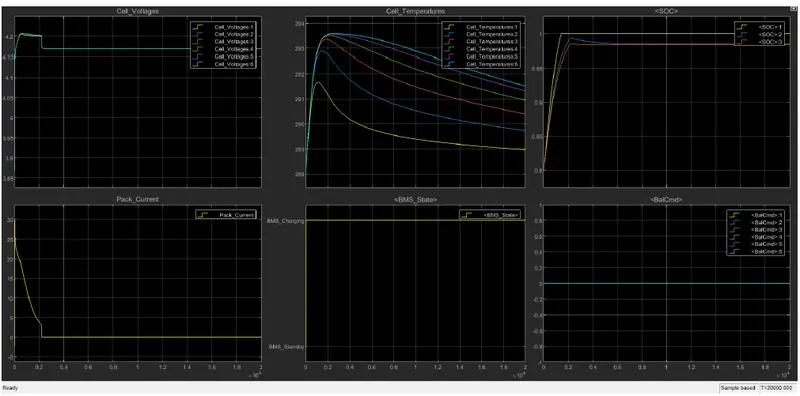
- While charging SOC increases from 80 to 100% because charge is getting added in the cell and capacity of the is increases soc is increases to 100% that means full charging of the battery , temperature increases during charging and is reduced in the standby state of the BMS.
2.What is coulomb counting? Refer to the above model and explain how BMS implements coulomb counting for SOC estimation.
Ans: coulomb counting:
Coulomb counting is a technique which is used to track the State of Charge of a battery pack. It works by integrating the active flowing current over time to derive the total sum of energy entering or leaving the battery pack. This produces a capacity that is typically measured in Amp-hours.
The coulomb counting method, also known as ampere hour counting and current integration, is the most common technique for calculating the SOC. This method employs battery current readings mathematically integrated over the usage period to calculate SOC.
The SOC estimation in the coulomb counting method is done using the below equation, This method is accurate and reliable than the voltage translational method but does not take into account the discharge rate, temperature, hysteresis, age of the battery, etc. The above is a generalized form of how a BMS works for SOC estimation.
The coulomb counting method, also known as ampere hour counting and current integration, is the most common technique for calculating the SOC. This method employs battery current readings mathematically integrated over the usage period to calculate SOC values given by SOC
SOC = SOC(t0) + 1Crated∫t0 + τ t0(Ib – Iloss) dt (1)
In our case temperature is not needed since the Coulomb counting method is independent of the working temperature of the battery.
Coulomb counting is a technique which is used to track the State of Charge of a battery pack. It works by integrating the active flowing current over time to derive the total sum of energy entering or leaving the battery pack. This produces a capacity that is typically measured in Amp-hours.
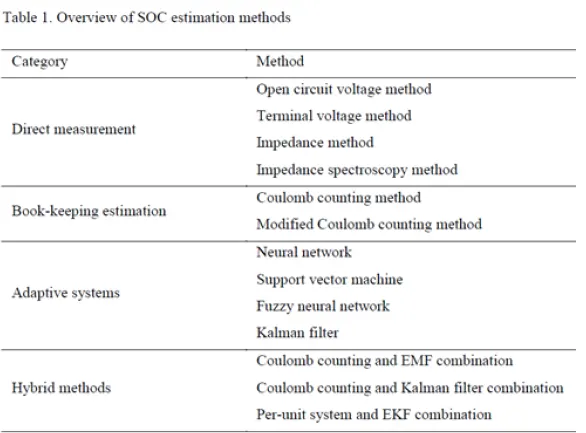
The Coulomb counting technique measures the discharging current of a battery and integrates the discharging current over time in order to estimate SOC. Coulomb counting method is done to estimate the, discharging current, and previously estimated SOC values. Integrating the current into or out of a battery gives the relative value of its charge.
Coulomb counting needs a starting point. If the initial charge in the battery is known, from then on coulomb counting can be used to calculate the charge.
During charging the voltage of the cell discharging is less than the charge. so the energy discharged is lower than the energy during charging, even though the charge in and out is the same.
STATE OF CHARGE SOC: State of charge (SoC) is the level of charge of an electric battery relative to its capacity. The units of SoC are percentage points (0% = empty; 100% = full). An alternative form of the same measure is the depth of discharge (DoD), the inverse of SoC (100% = empty; 0% = full). SoC is normally used when discussing the current state of a battery in use, while DoD is most often seen when discussing the lifetime of the battery after repeated use.
Limitations of coulomb counting
Coulomb Counting can be a very accurate technique, with two limitations:
- Leakage current within a cell does not go through the current sensor and is therefore not taken into account.
- The offset in the measurement of the battery current will result in the SOC drifting up (or down) over time.
Coulomb counting works well with Li-Ion cells because they have low leakage. Drift remains a major limitation due to the offset in the current sensor, especially Hall effect sensors.
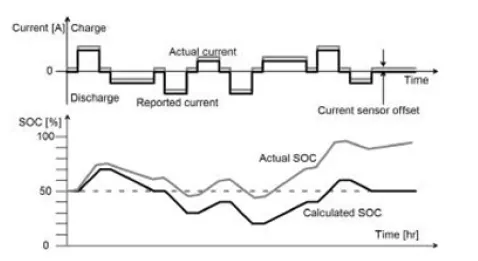
Drift can become significant in applications that, for long periods, use very little battery current or shuttle current back and forth. In particular:
Standby Batteries: Even if the battery is full, a small offset in the current sensor in the discharging direction will result in the reported SOC drifting all the way to 0% SOC over time.
HEV pack: Uses energy from the battery when it needs it, and replenishes it when it can, trying to maintain a 50% SOC. While the reported SOC may very well stay around 50%, over time the actual SOC will drift due to the small offset in the current sensor. Eventually, the actual battery charge will approach either the full or the empty state.
Implementation of coulomb counting in BMS
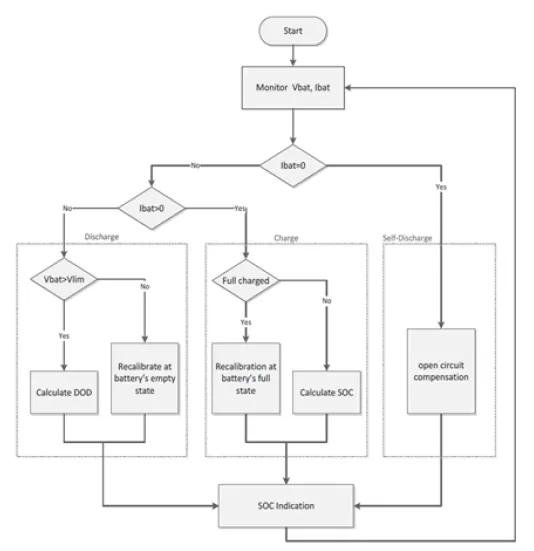
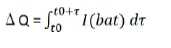
The estimation of the SOC of a Li-Ion battery in this method is based on monitoring both the voltage and the current. The operation mode of the battery is recognized by the direction of current through the battery system. When the battery is in open-circuit mode, I(bat) = 0. The information needed to carry monitoring is the measurement of the battery voltage, the current flowing through it, and the operating temperature. Coulomb counter ΔQ is used to track the SOC when the battery is charged or discharged. The amount of charges ΔQ in an operating period τ is obtained by temporal integration of a measured charging/discharging current as
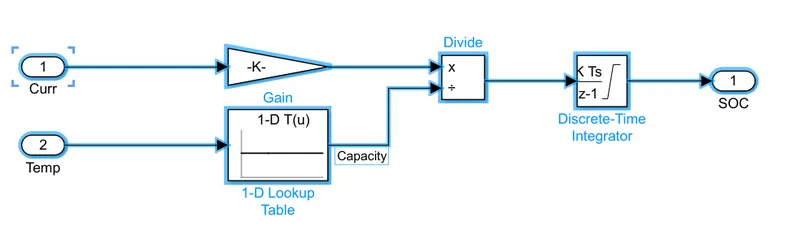
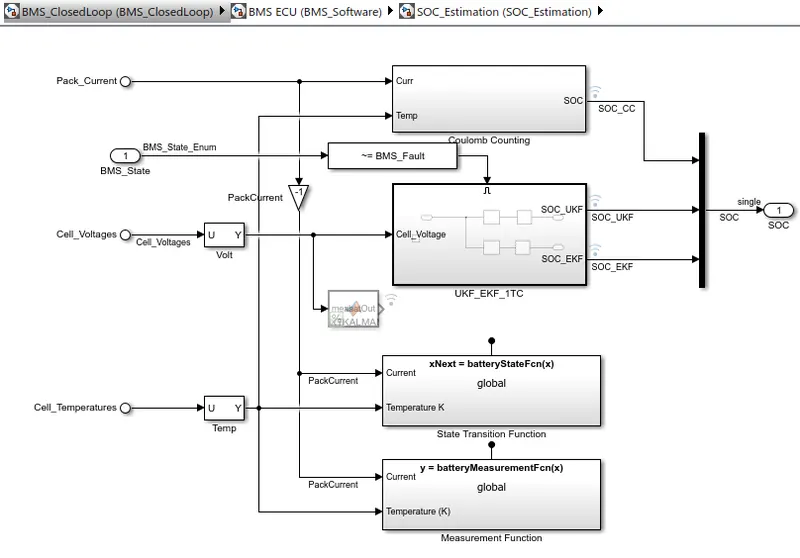
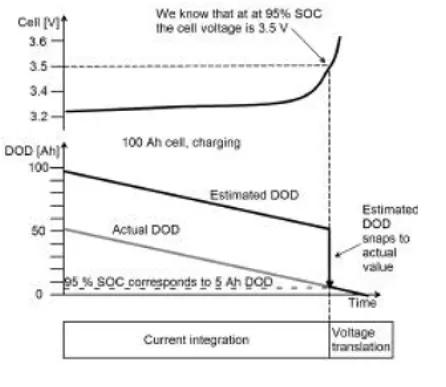
In the below model graph the estimation of the SOC of a Li-ion battery by the developed method is based on monitoring the temperature, voltage, and current. The operation mode of the battery is recognized by the direction of the current through the battery system. We know that at 95% SOC the cell voltage is 3.5v, this is drawn between cell voltage and Time. Estimated DOD snaps to actual value it is drwan between DOD and Time. 95% SOC is corresponding to 5Ah DOD. In the below model the estimated SOC nad Actual DOD is represented.