Week 7 State of charge estimation
AIM:
To simulate the 3 test cases form harness dashboard and write a detailed report on the results and to refer to the given model and explain how BMS implements coulomb counting for SOC estimation.
REQUIREMENTS:
Matlab Simulink
SIMULATION OF 3 TEST CASES FROM HARNESS DASHBOARD:
- initially we have to simulate 3 test cases form the harness dashboard.
- we can use the reference link provided https://in.mathworks.com/matlabcentral/fileexchange/72865-design-and-test-lithium-ion-battery-management-algorithms.
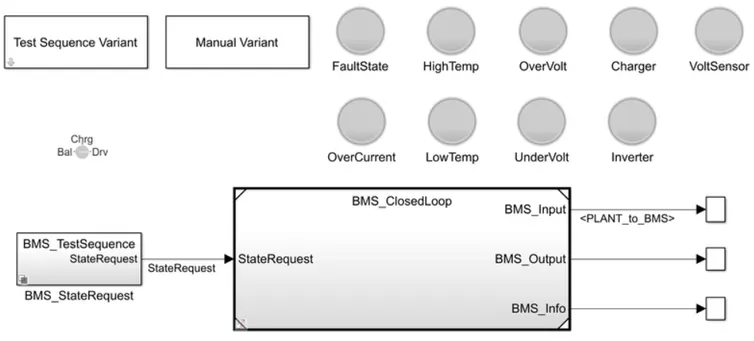
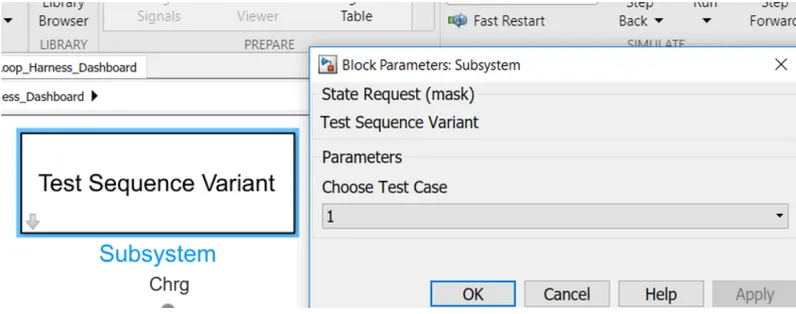
- click on the test sequence varient block and select test case 1
- now by clicking on the BMS sequence block we get the chart.
- on start of the simulation, the model will be in operating condition.
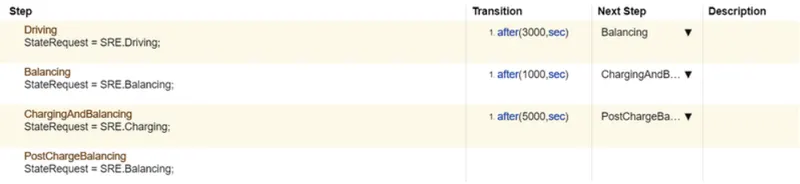
- after 3000 seconds it will be in standby mode and after 1000 seconds it will be in charging mode.
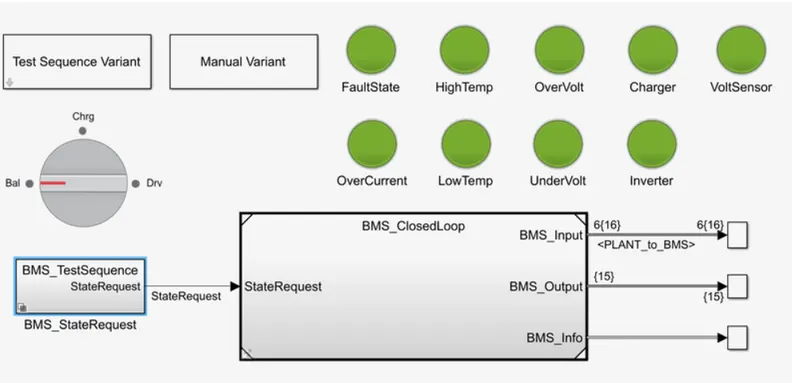
OUTPUT:
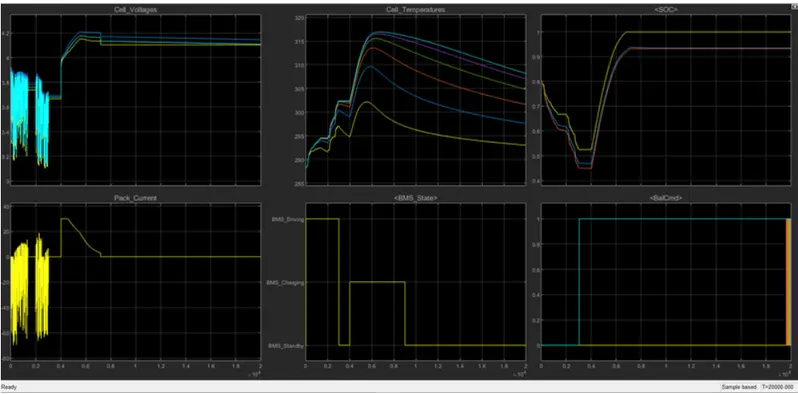
OBSERVATION:
- here all the indicators are gree. so we can see no errors shown below.
- from the plot we can see the vehicle is initially in driving state and charging was done till 90%.
- After charging it reaches to standby mode. It can be seen in BMS state plot. Battery temperature increases in driving and charging.
- Battery voltage was increased to 4.2V while charging.
- the value of current supplied to vehicle while driving is shown in current plot. SOC decreased up to 50% in driving condition and it was increased while charging.
2)Now lets change the test sequence varient to Case 2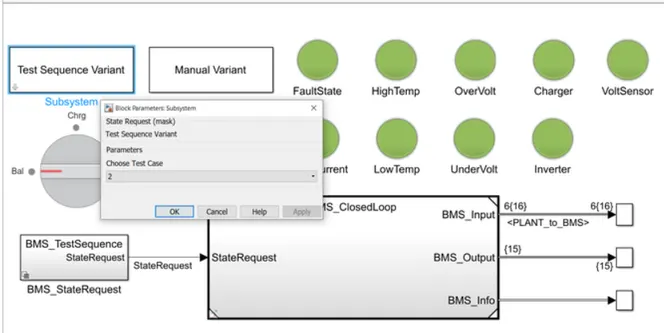

- the driving stage is for 0 to 10000 seconds.
- after that charging stage occur.
OUTPUT:
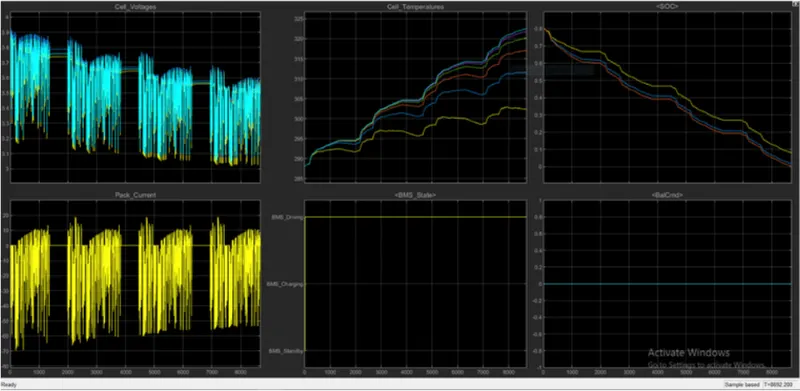
OBSERVATION:
- from the above graph, it is observed that a fault condition is occured.
- the SOC has not increased even after charging was started, it continues to decrease.
3) Now lets change the test sequence varient to Case 3.
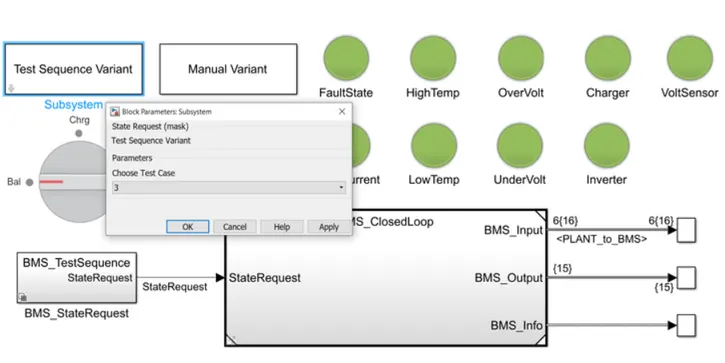
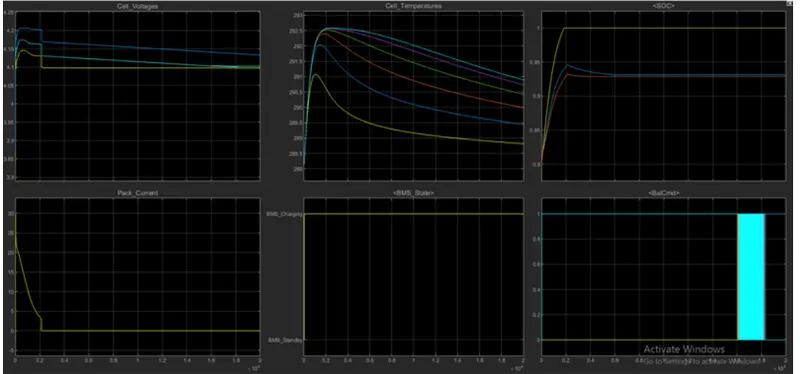
- this condition has only one phas and that is charging. thus 0 to 20000 seconds simulation runs.
OUTPUT:
OBSERVATION:
- here we can see that the soc reached 100% in charging and remained in stand by mode.
- Cell temperature also decreased when standby mode was achieved.
RESULT:
- From the above 3 cases we observe that only charging takes place so SOC was 80% initally, and then Gradually increased to 100% in 2000 seconds.
- then SOC remains Constant at 100%
COLUMB COUNTING:
- the coulomb counting method measures the discharging current of a battery and interfrates the discharging current over time in order to estimate SOC.
- it is done by estimating the current, which is estimated form the discharging current and previously estimated SOC values.

- but there are several factors that affect the accuract of coulomb counting method including temperature, battery,history,discharge current and cycle life
- the modified coulomb counting method uses the corrected current to improve the accuracy of estimation.
- the corrected current is the function of discharging current. There is a quadratic relationship between the corrected current and discharging current of battery.

- where k0,k1,k2 are constant values.
- SOc is calcualted by the following equation.
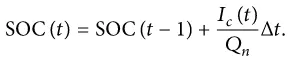
- the experimental results shows that the accuracy of the modified coulumb counting method is superior to the conventional coulomb counting method.
BMS IMPLEMENTATION WITH COULOMB COUNTING FOR SOC ESTIMATION:
- There are 2 main blocks in the cirucit one is the Battery management system electronic control unit and the other is Plant
- Plant is a battey source or power source while the BMS ECU is a software in a simulation environment.
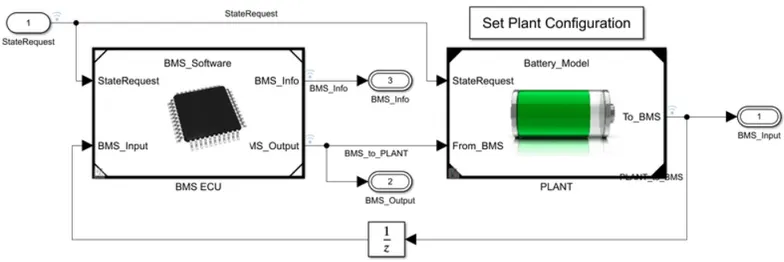
(i) Battery Management system Electronic control unit:
- represents the software and controls part of the model, showing how cell balancing is done, Soc is estimated and response to different states.
- it also protects and reports the measurements from the battery pack.
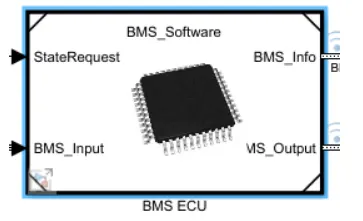
- by clicking on the BMS ECU we get this sub circuit.
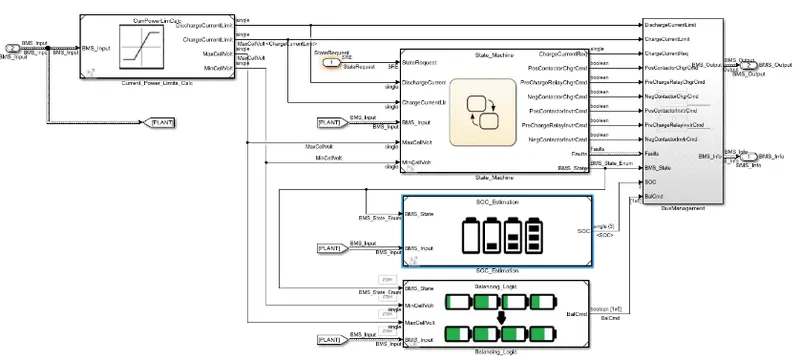
- by clicking on the SOC estimation block we get
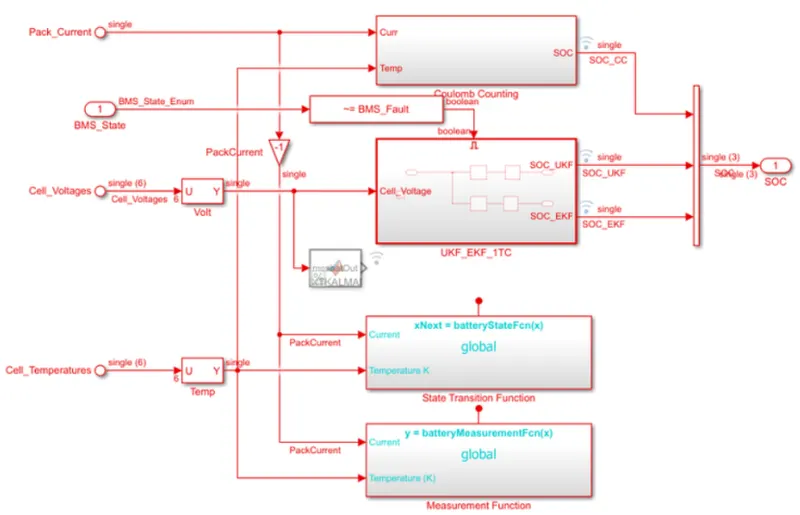
- from above figure we observe the coulomb counting block.
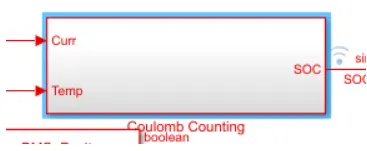
- a subsytem opens when we click on the coulomb counting block
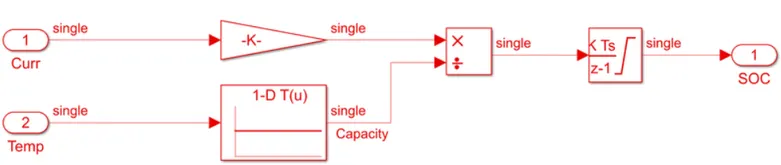
- the coulomb counting method is simplicity and low computational cost
- temperature and current from the battery is given as inputs.
- the temperature varies as the current signal is given to a gain block.
- hence the SOC is estimated.
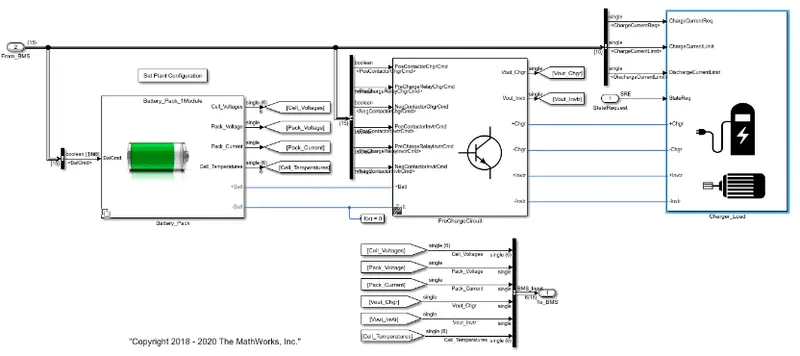
(ii) Plant:
- the plant is the battery source or the power source
- it consists of battery pack, precharge circuit which is connected to charge and load
- they are connected in paralled connection, there is a charger connection and inverter connection
- the Drive load will discharge like a motor and inverter.
- Charge load, we have current source, changes battery in other direction, changes happens in current rate.
RESULT:
- Thus the simulation of the 3 test cases form harness dashboard is completed and the report on the results with reference to the given model is Explained.
- the BMS implements coulomb counting for SOC estimation is also completed successfully and output is verified.