Week 7 - Simulation of a 1D Supersonic nozzle flow simulation using Macormack Method
Aim:Simulation of 1D Super-sonic nozzle flow simulation using the Macormack Method.
Objective:
Simulate isentropic flow through a Quasi 1D subsonic nozzle by deriving conservative and non-conservative forms of governing equations and solving them by implementing the MacCormack technique using MATLAB.
Problem Statement:
Compare the solutions of the two versions of the governing equations to the graphs below to ascertain the steady-state temperature distribution for the flow-field variables and investigate the distinction between the two forms.
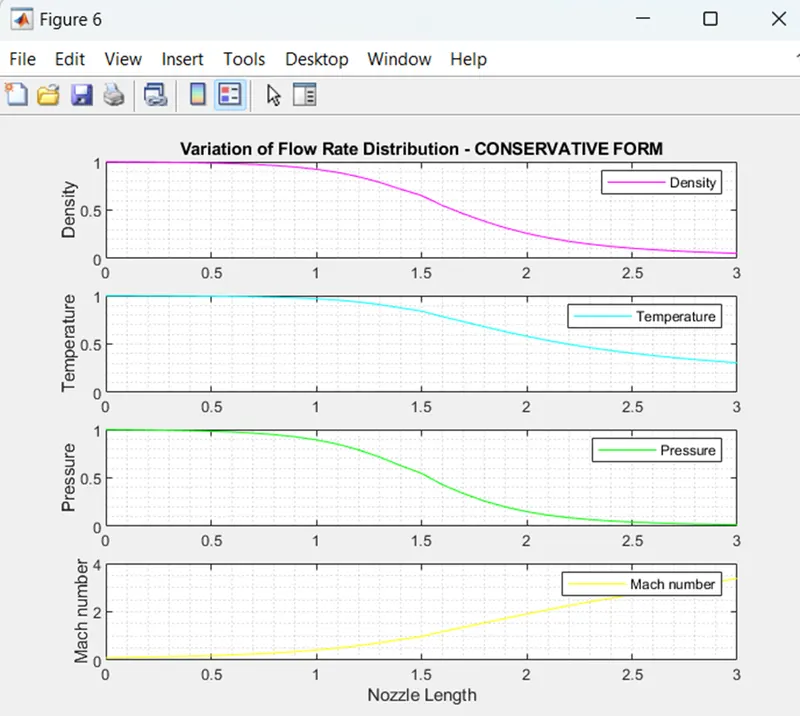
distribution of the primitive variable in a steady state inside the nozzle.
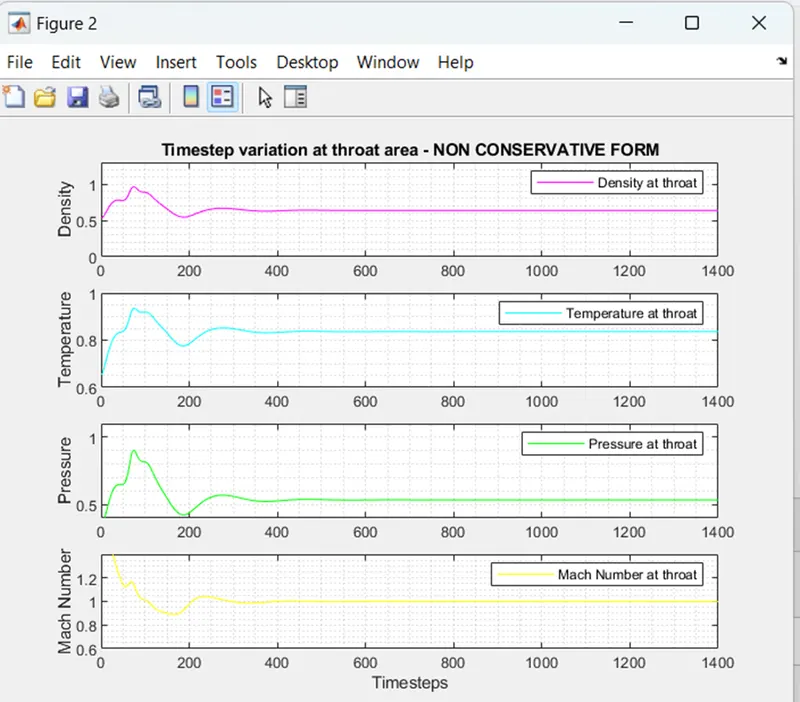
a basic variable's fluctuation over time.
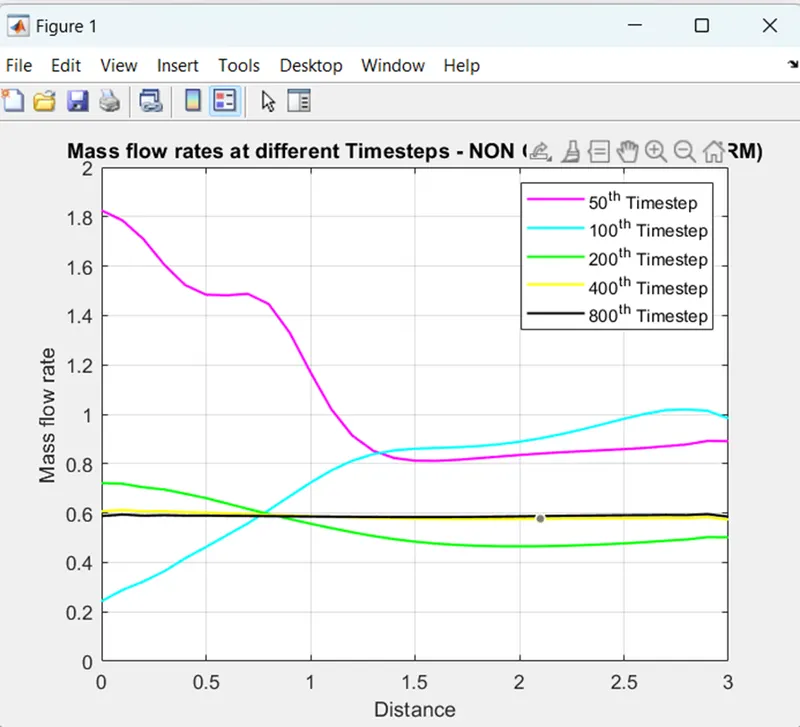
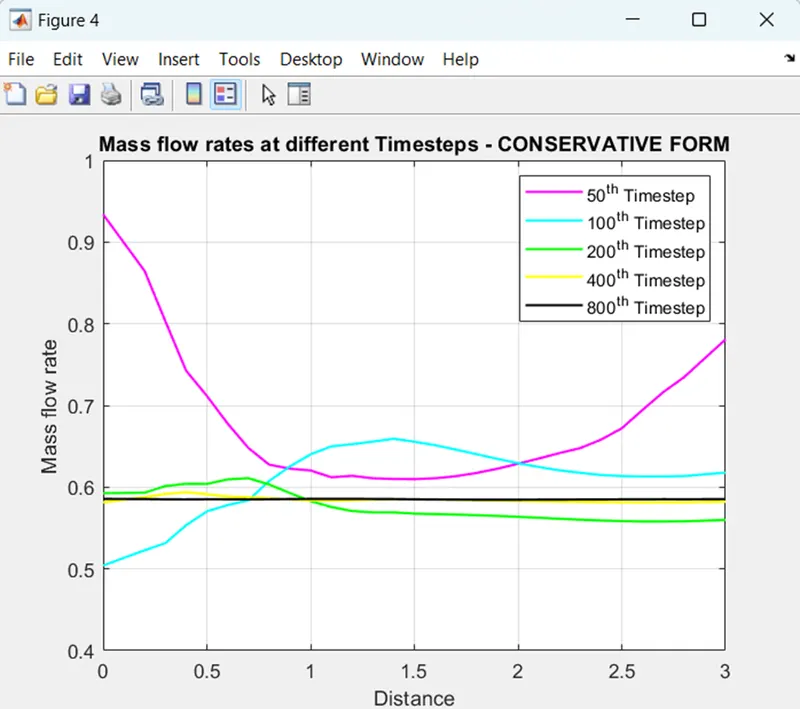
The mass velocity distribution inside the nozzle changes as the time marching process progresses.
Comparison of the two kinds' normalised mass flow distributions.
Theory:
Nozzle:
Step-1 - Governing equations
For Non Conservative :-
* Continuity Equation

* Momentum Equation

*Energy Equation

For Conservative :-
* Continuity Equation
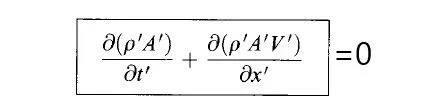
* Momentum Equation

*Energy Equation

Step-2- Finite difference expressions using MacCormack's explicit technique for the numerical solution
To implement a finite-difference solution, we divide the x axis along the nozzle into a number of discrete frid points,
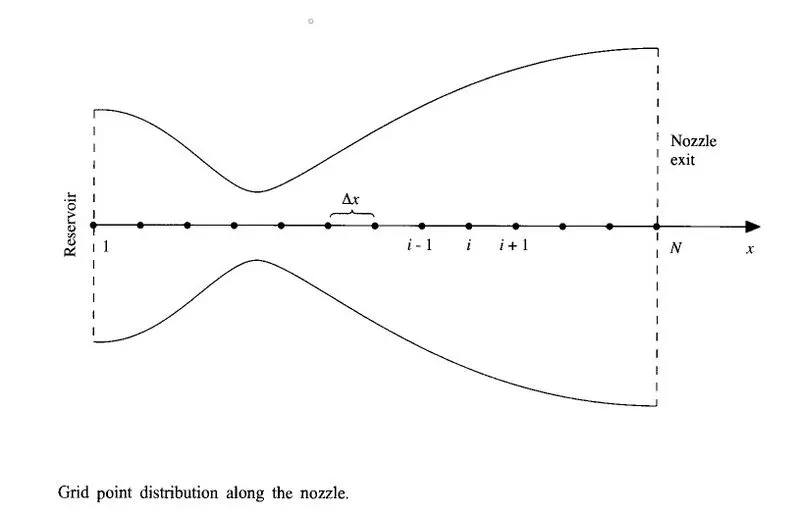
Non Conservasion form
First we consider the predictor step, we set up the spatial derivatives as forward differences.
Continuity Equation:-

Momentum Equation:-

Energy Equation :-

`Using the above values we will obtain the predicted values of ρ ,V and T`
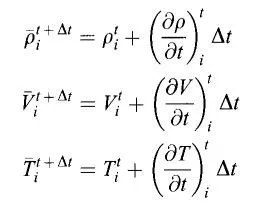
But these values are only First order accurate. So we do the corrector step to make it Second order accurate.
In the corrector step we first obtain a predicted values of the time derivative at time
by substituting the predicted values of ρ�, u, and v into the right side of the continuity equation, replacing the spatial derivatives with rearward differences.
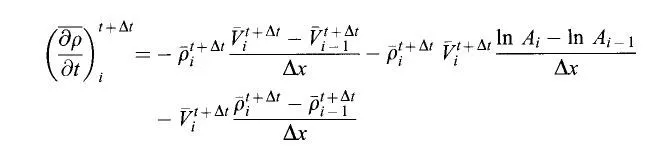
Likewise momentum and energy equations will be,

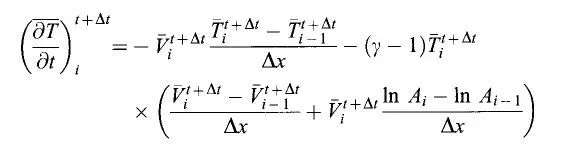
Using above equations, the average time derivatives are
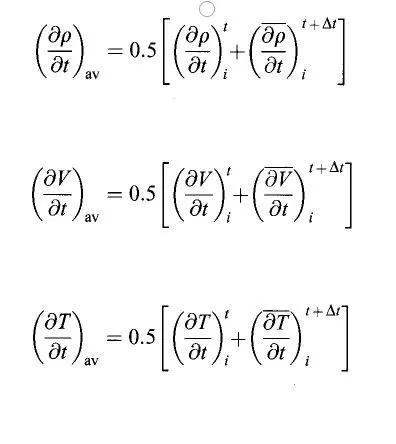
Then we can substitute the values into the below formula to find the corrected values of the flow-field variables at time t+△t
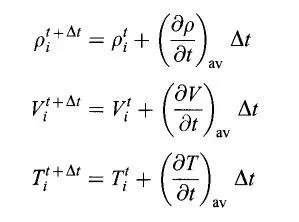
Conservasion form
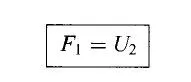
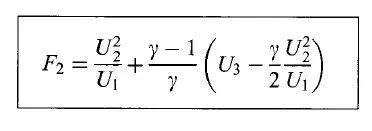
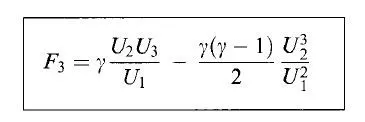
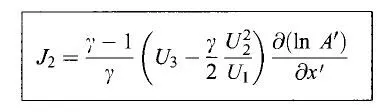
The equations for quasi-one-dimensional flow can be expressed in generic form. Let us define the elements of the solutions vector U, the flux vector F, and the source term J as follows
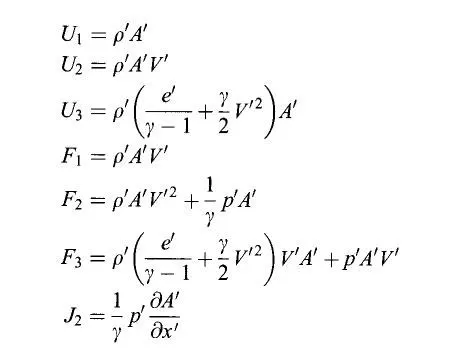
First we will find the source vectors with the above equations with initial condition, then with them we can find the flux vectors.
Predictor Step :-
Then we set up the spatial derivatives as forward differences .
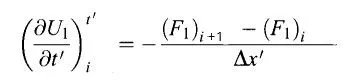

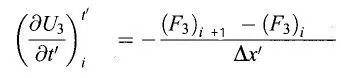
Then we find the predicted values of U1, U2 and U3
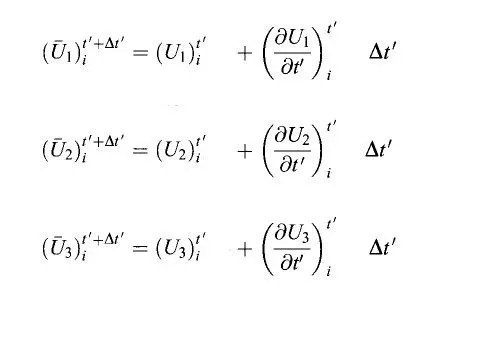
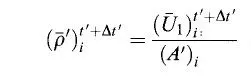
Using these values we will find the predicted values of the primitive variables
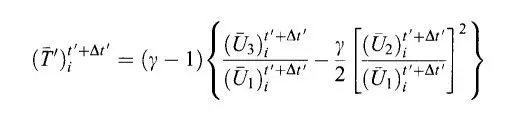
Now update the flux vector F1, F2, F3 with the new density , temperature and velocity.
Corrector Step :-
The predicted time derivatives of U1, U2 and U3 are obtained above. and Corrector time derivatives can be find using rearward differences for the x derivatives.
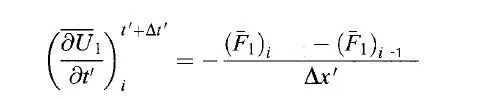


Then the average time derivatives are formed as follows :-
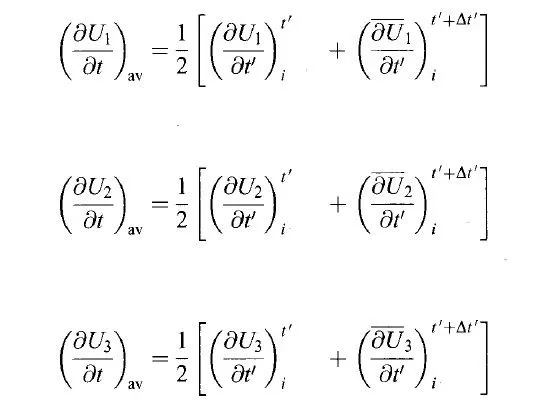
So, the final corrected values of U1, U2, U3 will become,
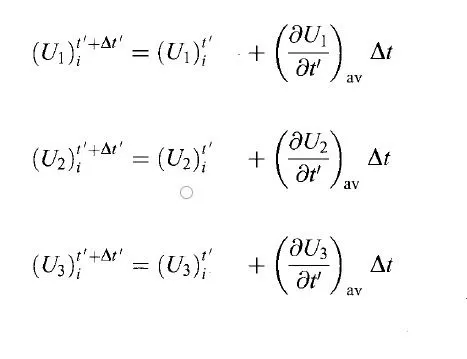
Finally the corrected values of the primitive variables are obtained by decoding U1, U2 and U3 obtained above.
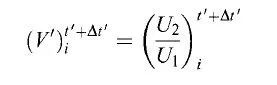
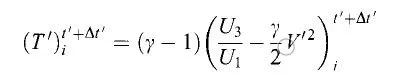
(ρ')t'+△t'i=(U1)t'+△t'i(A)t'+△t'i(�′)��′+△�′=(�1)��′+△�′(�)��′+△�′
Step-3- Setting Time step calculation , initial and boundary conditions
Time step can be calculated using the following formula :-
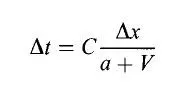
where,
C = Courant number
a = speed of sound
V= velocity
△x△� = Distance between to consecutive points.
Non Conservative form
Nozzle shape :-

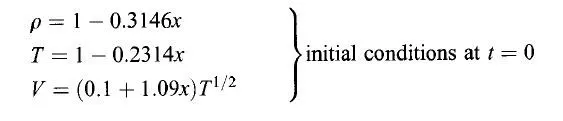
Initial conditions:-
Boundary condition at Inlet:-
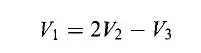
Boundary condition at outlet
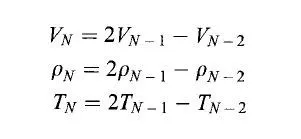
Conservative form
Nozzle shape:-
Initial condition :-
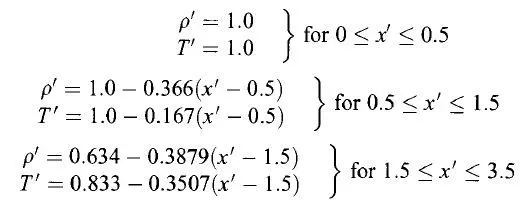
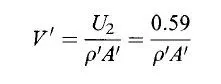
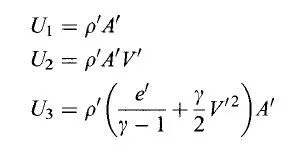
Boundary condition at inflow :-

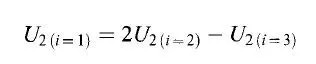
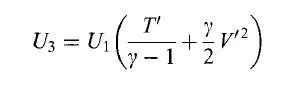
Boundary condition at outflow :-
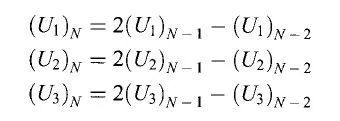
MAIN PROGRAM :
In order for the code to be modular, program is splited into three sections.
- Main Program of Quasi 1D subsonic-supersonic nozzle
Two functions namely
- Non Conservative form
- Consevative form.
clear all
close all
clc

%SOLVING QUASI 1D SUPERSONIC NOZZLE FLOW EQUATIONS
%INPUT PARAMETERS
%No. of grid points
n = 31;

gamma = 1.4;
x = linspace(0,3,n);
dx = x(2) - x(1);

%No. of time step
nt = 1400;

%Courant Number
C = 0.5;


%FUNCTION FOR NON CONSERVATIVE FORM
tic;
[Mass_flow_rate_NC, Pressure_NC, Mach_number_NC, rho_NC, v_NC, T_NC, rho_throat_NC, v_throat_NC, T_throat_NC, Mass_flow_rate_throat_NC, Pressure_throat_NC, Mach_number_throat_NC] = Non_conservative_form(x, dx, n, gamma, nt, C);
Time_elapsed_NC = toc;
fprintf('Time Elasped for Non Conservative form: %0.4f', Time_elapsed_NC);
hold on

%PLOTTING
%Timestep variation of properties at throat area in Non Conservative form
figure(2)

%Density
subplot(4,1,1)
plot(linspace(1,nt,nt),rho_throat_NC,'color','m')
ylabel('Density')
legend({'Density at throat'});
axis([0 1400 0 1.3]);
grid minor;
title('Timestep variation at throat area - NON CONSERVATIVE FORM')

%Temperature
subplot(4,1,2)
plot(linspace(1,nt,nt),T_throat_NC,'color','c')
ylabel('Temperature')
legend({'Temperature at throat'});
axis([0 1400 0.6 1]);
grid minor;

%Pressure
subplot(4,1,3)
plot(linspace(1,nt,nt),Pressure_throat_NC,'color','g')
ylabel('Pressure')
legend({'Pressure at throat'});
axis([0 1400 0.4 1.1]);
grid minor

%Mach Number
subplot(4,1,4)
plot(linspace(1,nt,nt),Mach_number_throat_NC,'color','y')
xlabel('Timesteps')
ylabel('Mach Number')
legend({'Mach Number at throat'});
axis([0 1400 0.6 1.4]);
grid minor;


%Steady state simulation for primitve values for Non Conservative form
figure(3);
%Density

subplot(4,1,1);
plot(x,rho_NC,'color','m')
ylabel('Density')
legend({'Density'});
axis([0 3 0 1])
grid minor;
title('Variation of Flow Rate Distribution - NON CONSERVATIVE')

%Temperature
subplot(4,1,2);
plot(x,T_NC,'color','c')
ylabel('Temperature')
legend({'Temperature'});
axis([0 3 0 1])
grid minor;

%Pressure
subplot(4,1,3);
plot(x,Pressure_NC,'color','g')
ylabel('Pressure')
legend({'Pressure'});
axis([0 3 0 1])
grid minor;

%Mach number
subplot(4,1,4);
plot(x,Mach_number_NC,'color','y')
xlabel('Nozzle Length')
ylabel('Mach number')
legend({'Mach number'});
axis([0 3 0 4])
grid minor;


%FUNCTION FOR CONSERVATIVE FORM
tic;
[Mass_flow_rate_C, Pressure_C, Mach_number_C, rho_C, v_C, T_C, rho_throat_C, v_throat_C, T_throat_C, Mass_flow_rate_throat_C, Pressure_throat_C, Mach_number_throat_C] = Conservative_form(x, dx, n, gamma, nt, C);
Time_elasped_C = toc;
fprintf('Time Elasped for Conservative form: %0.4f', Time_elasped_C);

%PLOTTING
%Timestep variation of properties at throat area in Conservative form
figure(5)

%Density
subplot(4,1,1)
plot(rho_throat_C,'color','m')
ylabel('Density')
legend({'Density at throat'});
axis([0 1400 0 1]);
grid minor;
title('Timestep variation at throat area - CONSERVATIVE FORM')

%Temperature
subplot(4,1,2)
plot(T_throat_C,'color','c')
ylabel('Temperature')
legend({'Temperature at throat'});
axis([0 1400 0.6 1]);
grid minor;

%Pressure
subplot(4,1,3)
plot(Pressure_throat_C,'color','g')
ylabel('Pressure')
legend({'Pressure at throat'});
axis([0 1400 0.2 0.8]);
grid minor

%Mach Number
subplot(4,1,4)
plot(Mach_number_throat_C,'color','y')
xlabel('Timesteps')
ylabel('Mach Number')
legend({'Mach Number at throat'});
axis([0 1400 0.6 1.4]);
grid minor;


%Steady state simulation for primitve values for Non Conservative form
figure(6);

%Density
subplot(4,1,1);
plot(x,rho_C,'color','m')
ylabel('Density')
legend({'Density'});
axis([0 3 0 1])
grid minor;
title('Variation of Flow Rate Distribution - CONSERVATIVE FORM')

%Temperature
subplot(4,1,2);
plot(x,T_C,'color','c')
ylabel('Temperature')
legend({'Temperature'});
axis([0 3 0 1])
grid minor;

%Pressure
subplot(4,1,3);
plot(x,Pressure_C,'color','g')
ylabel('Pressure')
legend({'Pressure'});
axis([0 3 0 1])
grid minor;

%Mach number
subplot(4,1,4);
plot(x,Mach_number_C,'color','y')
xlabel('Nozzle Length')
ylabel('Mach number')
legend({'Mach number'});
axis([0 3 0 4])
grid minor;


%COMPARISON PLOT of Normalized Mass Flow Rate of both forms
figure(7)
hold on
plot(x,Mass_flow_rate_NC,'r','linewidth',1.25)
hold on;
plot(x,Mass_flow_rate_C,'b','linewidth',1.25)
hold on;
grid on

legend('Non Conservative','Conservative');
xlabel('Length of the Domain')
ylabel('Mass Flow Rate')
title('Comparison of Normalized Mass Flow Rate of both forms')
Explanation:
• To enable a fresh run without changing the previously used values, the code is executed using the clear all, close all, and clc commands.
The input parameters for the variables x, dx, n, gamma, nt, and C are given.
• Using the essential inputs, which are listed below in this section, the non-conservative and conservative forms are created as distinct functions.
• To determine the amount of time that has passed between functions, use the tic toc command.
For the ensuing resolution, rendering is completed
1) Changes in the time step in both types' throat regions
2) Changes in both kinds' flow distribution
3) Evaluation of both types' normalised mass flow rates
Each graphic is computed using four simple variables, such as density, temperature, pressure, and throat Mach number, as well as convergent/divergent sections.
NON CONSERVATIVE FORM
%Function for Non-Conservative form

function [Mass_flow_rate_NC, Pressure_NC, Mach_number_NC, rho_NC, v_NC, T_NC, rho_throat_NC, v_throat_NC, T_throat_NC, Mass_flow_rate_throat_NC, Pressure_throat_NC, Mach_number_throat_NC] = Non_conservative_form(x, dx, n, gamma, nt, C)

%Intial boundary conditions
rho_NC = 1 - 0.3146*x;
T_NC = 1 - 0.2341*x;
v_NC = (0.1 + 1.09*x).*T_NC.^0.5;

%Area & Throat profiles
a = 1 + 2.2*(x - 1.5).^2;
throat = find(a==1);


%Outer Time Loop
for k = 1:nt

    %Time-step control
    dt = min(C.*dx./(sqrt(T_NC) + v_NC));

    %Saving a copy of Old Values
    rho_old = rho_NC;
    T_old = T_NC;
    v_old = v_NC;


    %Predictor Method
    for j = 2:n-1

        %Simplifying the Equation's spatial terms
        dv_dx = (v_NC(j + 1) - v_NC(j))/dx;
        drho_dx = (rho_NC(j + 1) - rho_NC(j))/dx;
        dT_dx = (T_NC(j + 1) - T_NC(j))/dx;
        dlog_a_dx = (log(a(j + 1)) - log(a(j)))/dx;

        %Continuity Equation
        drho_dt_P(j) = -rho_NC(j)*dv_dx - rho_NC(j)*v_NC(j)*dlog_a_dx - v_NC(j)*drho_dx;

        %Momentum Equation
        dv_dt_P(j) = -v_NC(j)*dv_dx - (1/gamma)*(dT_dx + (T_NC(j)*drho_dx/rho_NC(j)));

        %Energy Equation
        dT_dt_P(j) = -v_NC(j)*dT_dx - (gamma - 1)*T_NC(j)*(dv_dx + v_NC(j)*dlog_a_dx);


        %Solution Update
        rho_NC(j) = rho_NC(j) + drho_dt_P(j)*dt;
        v_NC(j) = v_NC(j) + dv_dt_P(j)*dt;
        T_NC(j) = T_NC(j) + dT_dt_P(j)*dt;

    end


    %Corrector Method
    for j = 2:n-1

        %Simplifying the Equation's spatial terms
        dv_dx = (v_NC(j) - v_NC(j - 1))/dx;
        drho_dx = (rho_NC(j) - rho_NC(j - 1))/dx;
        dT_dx = (T_NC(j) - T_NC(j - 1))/dx;
        dlog_a_dx = (log(a(j)) - log(a(j - 1)))/dx;

        %Continuity Equation
        drho_dt_C(j) = - rho_NC(j)*dv_dx - rho_NC(j)*v_NC(j)*dlog_a_dx - v_NC(j)*drho_dx;

        %Momentum Equation
        dv_dt_C(j) = - v_NC(j)*dv_dx - (1/gamma)*(dT_dx + (T_NC(j)*drho_dx/rho_NC(j)));

        %Energy Equation
        dT_dt_C(j) = - v_NC(j)*dT_dx - (gamma - 1)*T_NC(j)*(dv_dx + v_NC(j)*dlog_a_dx);

    end

    %Compute Average Time derivative
    drho_dt = 0.5.*(drho_dt_P + drho_dt_C);
    dv_dt = 0.5.*(dv_dt_P + dv_dt_C);
    dT_dt = 0.5.*(dT_dt_P + dT_dt_C);

    %Final Solution Update
    for i = 2:n-1
        rho_NC(i) = rho_old(i) + drho_dt(i)*dt;
        v_NC(i) = v_old(i) + dv_dt(i)*dt;
        T_NC(i) = T_old(i) + dT_dt(i)*dt;

    end

    %Applying Boundary Conditions
    %At Inlet
    rho_NC(1) = 1;
    v_NC(1) = 2*v_NC(2) - v_NC(3);
    T_NC(1) = 1;

    %At Outlet
    rho_NC(n) = 2*rho_NC(n-1) - rho_NC(n - 2);
    v_NC(n) = 2*v_NC(n - 1) - v_NC(n - 2);
    T_NC(n) = 2*T_NC(n - 1) - T_NC(n - 2);


    %Defining Mass flow rate, Pressure and Mach number
    Mass_flow_rate_NC = rho_NC.*a.*v_NC;
    Pressure_NC = rho_NC.*T_NC;
    Mach_number_NC = (v_NC./sqrt(T_NC));

    %Calculating Variables at throat section
    rho_throat_NC(k) = rho_NC(throat);
    T_throat_NC(k) = T_NC(throat);
    v_throat_NC(k) = v_NC(throat);
    Mass_flow_rate_throat_NC(k) = Mass_flow_rate_NC(throat);
    Pressure_throat_NC(k) = Pressure_NC(throat);
    Mach_number_throat_NC(k) = Mach_number_NC(throat);


    %PLOTTING
    %Comparison of non-dimensional Mass flow rates at different time steps
    figure(1);
    if k == 50
       plot(x, Mass_flow_rate_NC, 'm', 'linewidth', 1.25);
       hold on
    elseif k == 100
       plot(x, Mass_flow_rate_NC, 'c', 'linewidth', 1.25);
       hold on
    elseif k == 200
       plot(x, Mass_flow_rate_NC, 'g', 'linewidth', 1.25);
       hold on
    elseif k == 400
       plot(x, Mass_flow_rate_NC, 'y', 'linewidth', 1.25);
       hold on
    elseif k == 800
       plot(x, Mass_flow_rate_NC, 'k', 'linewidth', 1.25);
       hold on
    end

    %Labelling
    title('Mass flow rates at different Timesteps - NON CONSERVATIVE FORM)')
    xlabel('Distance')
    ylabel('Mass flow rate')
    legend({'50^t^h Timestep','100^t^h Timestep','200^t^h Timestep','400^t^h Timestep','800^t^h Timestep'})
    axis([0 3 0 2])
    grid on

end

end
Explanation:
• The for loop assigns the predictor and corrector techniques separately to compute the values.
• In the following phase, the computed values are averaged, and the solution is updated using the previous values.
• The for cycle applies the boundary conditions, which are then utilised to compute the mass flow rate, Mach number, and pressure as well as the throat portion of the values.
• Finally, a plot is created for mass flow (m) and distance (x) for various time steps.
Programme completion.
CONSERVATIVE FORM
%Function for Conservative form

function [Mass_flow_rate_C, Pressure_C, Mach_number_C,  rho_C, v_C, T_C, rho_throat_C, v_throat_C, T_throat_C, Mass_flow_rate_throat_C, Pressure_throat_C, Mach_number_throat_C] = Conservative_form(x, dx, n, gamma, nt, C)

%Determining Initial profile of Density and Temperature
for i = 1:n

    if (x(i) >= 0 && x(i) <= 0.5)
        rho_C(i) = 1;
        T_C(i) = 1;
    elseif (x(i) >= 0.5 && x(i) <= 1.5)
        rho_C(i) = 1 - 0.366*(x(i) - 0.5);
        T_C(i) = 1 - 0.167*(x(i) - 0.5);
    elseif (x(i) >= 1.5 && x(i) <= 3)
        rho_C(i) = 0.634 - 0.3879*(x(i) - 1.5);
        T_C(i) = 0.833 - 0.3507*(x(i) - 1.5);
    end

end

%Area & Throat profiles
a = 1 + 2.2*(x - 1.5).^2;
throat = find(a==1);

%Initial profile fot Velocity and Pressure
v_C = 0.59./(rho_C.*a);
Pressure_C = rho_C.*T_C;

%Calculate the Initial Solution Vectors(U)
U1 = rho_C.*a;
U2 = rho_C.*a.*v_C;
U3 = rho_C.*a.*(T_C./(gamma - 1)) + ((gamma/2).*v_C.^2);


%Outer Time Loop
for k =1:nt

    %Time-step control
    dt = min(C.*dx./(sqrt(T_C) + v_C));

    %Saving a copy of Old Values
    U1_old = U1;
    U2_old = U2;
    U3_old = U3;

    %Calculating the Flux vector(F)
    F1 = U2;
    F2 = ((U2.^2)./U1) + ((gamma - 1)/gamma)*(U3 - (gamma/2)*((U2.^2)./U1));
    F3 = ((gamma*U2.*U3)./U1) - (gamma*(gamma - 1)*((U2.^3)./(2*U1.^2)));


    %Predictor Method
    for j = 2:n-1

        %Calculating the Source term(J)
        J2(j) = (1/gamma)*rho_C(j)*T_C(j)*((a(j + 1) - a(j))/dx);


        %Continuity Equation
        dU1_dt_P(j) = -((F1(j + 1) - F1(j))/dx);

        %Momentum Equation
        dU2_dt_P(j) = -((F2(j + 1) - F2(j))/dx) + J2(j);

        %Energy Equation
        dU3_dt_P(j) = -((F3(j + 1) - F3(j))/dx);


        %Updating New values
        U1(j) = U1(j) + dU1_dt_P(j)*dt;
        U2(j) = U2(j) + dU2_dt_P(j)*dt;
        U3(j) = U3(j) + dU3_dt_P(j)*dt;

    end

    %Updating Flux vectors
    F1 = U2;
    F2 = ((U2.^2)./U1) + ((gamma - 1)/gamma)*(U3 - ((gamma*0.5*(U2.^2))./(U1)));
    F3 = ((gamma*U2.*U3)./U1) - ((gamma*0.5*(gamma - 1)*(U2.^3))./(U1.^2));


    %Corrector Method
    for j = 2:n-1

        %Updating the Source term(J)
        J2(j) = (1/gamma)*rho_C(j)*T_C(j)*((a(j) - a(j - 1))/dx);

        %Simplifying the Equation's spatial terms
        dU1_dt_C(j) = -((F1(j) - F1(j - 1))/dx);
        dU2_dt_C(j) = -((F2(j) - F2(j - 1))/dx) + J2(j);
        dU3_dt_C(j) = -((F3(j) - F3(j - 1))/dx);

    end

    %Compute Average Time derivative
    dU1_dt = 0.5*(dU1_dt_P + dU1_dt_C);
    dU2_dt = 0.5*(dU2_dt_P + dU2_dt_C);
    dU3_dt = 0.5*(dU3_dt_P + dU3_dt_C);

    %Final Solution Update
    for i = 2:n-1
        U1(i) = U1_old(i) + dU1_dt(i)*dt;
        U2(i) = U2_old(i) + dU2_dt(i)*dt;
        U3(i) = U3_old(i) + dU3_dt(i)*dt;

    end


    %Applying Boundary Conditions
    %At Inlet
    U1(1) = rho_C(1)*a(1);
    U2(1) = 2*U2(2) - U2(3);

    v_C(1) = U2(1)./U1(1);
    U3(1) = U1(1)*((T_C(1)/(gamma - 1)) + ((gamma/2)*(v_C(1)).^2));

    %At Outlet
    U1(n) = 2*U1(n - 1) - U1(n - 2);
    U2(n) = 2*U2(n - 1) - U2(n - 2);
    U3(n) = 2*U3(n - 1) - U3(n - 2);

    %Final Primitive value update
    rho_C = U1./a;
    v_C = U2./U1;
    T_C = (gamma - 1)*((U3./U1 - (gamma/2)*(v_C).^2));

    %Defining Mass flow rate, Pressure and Mach number
    Mass_flow_rate_C = rho_C.*a.*v_C;
    Pressure_C = rho_C.*T_C;
    Mach_number_C = (v_C./sqrt(T_C));

    %Calculating Variables at throat section
    rho_throat_C(k) = rho_C(throat);
    T_throat_C(k) = T_C(throat);
    v_throat_C(k) = v_C(throat);
    Mass_flow_rate_throat_C(k) = Mass_flow_rate_C(throat);
    Pressure_throat_C(k) = Pressure_C(throat);
    Mach_number_throat_C(k) = Mach_number_C(throat);

    %PLOTTING
    %Comparison of non-dimensional Mass flow rates at different time steps
    figure(4)
    if k == 50
       plot(x, Mass_flow_rate_C, 'm', 'linewidth', 1.25);
       hold on
    elseif k == 100
       plot(x, Mass_flow_rate_C, 'c', 'linewidth', 1.25);
       hold on
    elseif k == 200
       plot(x, Mass_flow_rate_C, 'g', 'linewidth', 1.25);
       hold on
    elseif k == 400
       plot(x, Mass_flow_rate_C, 'y', 'linewidth', 1.25);
       hold on
    elseif k == 800
       plot(x, Mass_flow_rate_C, 'k', 'linewidth', 1.25);
       hold on
    end


    %Labelling
    title('Mass flow rates at different Timesteps - CONSERVATIVE FORM')
    xlabel('Distance')
    ylabel('Mass flow rate')
    legend({'50^t^h Timestep','100^t^h Timestep','200^t^h Timestep','400^t^h Timestep','800^t^h Timestep'})
    axis([0 3 0.4 1])
    grid on

end

end
Explanation:
- The purpose of the function is to calculate values
Mass Flow, Pressure, Mach Number, Density, Velocity, Temperature, Throat Density, Throat Velocity, Throat Temperature, Throat Mass Flow, Throat Pressure, Throat Mach Number according to known equations for all grid points. - A for loop is used to specify the known conditions in an else-if statement to determine the initial density and temperature profile.
- The initial values of area, throat, velocity and pressure are calculated using formulas.
- To simplify and eliminate errors, the equation is divided into Solution Vector(U), Flux Vector(F) and Source Term(J).
- Now the outer while loop is calculated for the for loop to calculate all the grid points for the various formulas inside the loop.
- The MacCarmack technique is used to numerically solve governing equations such as the continuity, momentum, and energy equations.
- The technique includes two solution methods, a predictor method followed by a corrector method.
- The predictor and corrector methods are assigned within the for loop individually to calculate the values.
- The calculated values are averaged in the next step and the solution is updated with the old values.
- The boundary conditions are applied within the for cycle and subsequently used to calculate the mass flow rate, Mach number and pressure, as well as to calculate the throat part of the values.
- Finally, a plot is made for distance (x) and mass flow for different time steps.
The program is closed. -
Outputs:
Time steps variation of primitive variable at Throat area
Non-Conservative Form
Conservative Form
Observation:
From the above graphs, we can conclude that the initial deviations observed in the non-conservative form over a period of time require a higher amount of time to reach a stable solution compared to the conservative form.
Variation of Flow Rate Distribution
Non Conservative form
Conservative Form
Observation:
by observing the above plots wecan see that both the forms are in same phase giving the exact same solution for all the values.
Mass flow rates at different Timesteps:
Non Conservative form:
Conservative form:
Observation:
Above plots shows that Mass Flow Rate at different Time steps along the Distance oscillates initially, however the solution becomes stable after the 400th Timestep for both the forms attaining a constant value.
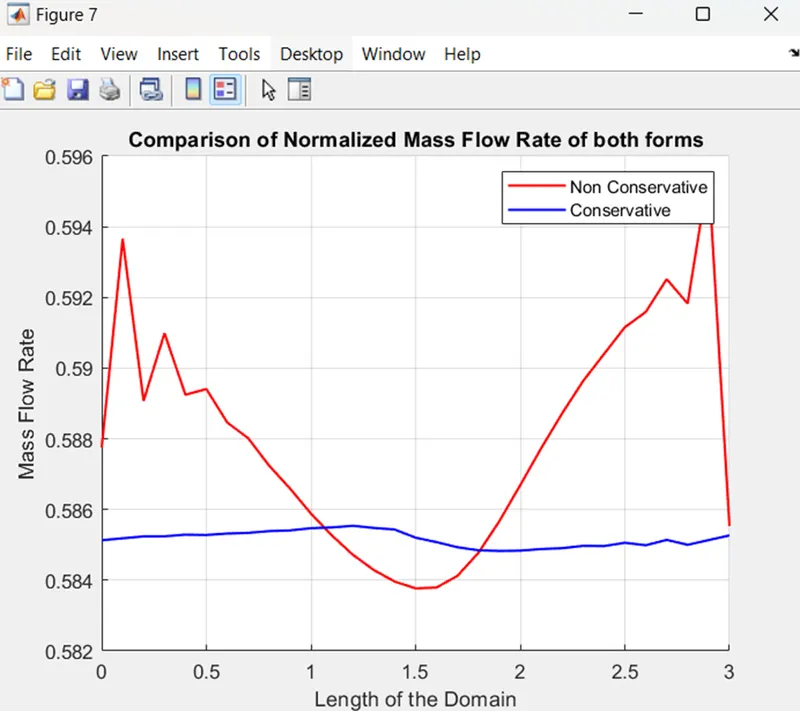
Observation:
Although the final solutions of the two forms are almost similar, the non-conservative form oscillates considerably compared to the conservative form. The latter also provides an almost stable solution along the entire length. From this we can conclude that the conservative form reaches stability in fewer iterations with the earliest possible time.
GRID DEPENDENCE TEST:
GRID DEPENDENCE TEST(comparision of solution after 1400 steps)
|
Types of forms |
Grid numbers(n) |
Density |
pressure |
temperature |
mach number |
Time elapsed(in sec) |
|
Non-conservative form |
n=31 n=61 |
0.638690887 0.637558551 |
0.534239917 0.532609261 |
0.836460842 0.83538878 |
0.9999372 0.9996991 |
155.4 140.7 |
|
Conservative form |
n=31 n=61 |
0.651619331 0.63830571 |
0.547765088 0.533075405 |
0.8406221298 0.835141214 |
0.979517537 0.999245249 |
130.7 122. |
|
Solution to be expected |
0.639 |
0.534 |
0.836 |
0.99 |
Observation:
• Grid reliance has a significant role in deciding how quickly a problem may be handled. Therefore, we filled the page with 61 grid points instead of the previous 31.
It is evident from the table above that even if the grid points (n) change from 31 to 61, the values are nearly same for all basic variables for both forms, demonstrating that the increase in grid points is unaffected.
• Therefore, it is acceptable to say that the aforementioned issue is grid-dependent.
CONCLUSION:
When all of the aforementioned findings are put together, it is clear that the conservative form converges a little bit quicker than the non-conservative form, which provides a stable solution throughout the simulation. However, both methods are trustworthy for calculating a result that is almost accurate.