Week 7: Shock tube simulation project
Shock Tube Simulation
Introduction
Explosion is a physical phenomenon in which chemical energy is transformed into very wide pressure gradient or shock waves. It is a very active research subject in various field. Among many such fields, study of explosion in a pipe is very commonly pronounced in automotive industry. Pipe, or cylinder explosion is of great importance as it relates with the cylinder of engine, in which fuel and air under immense pressure explodes to deliver energy.
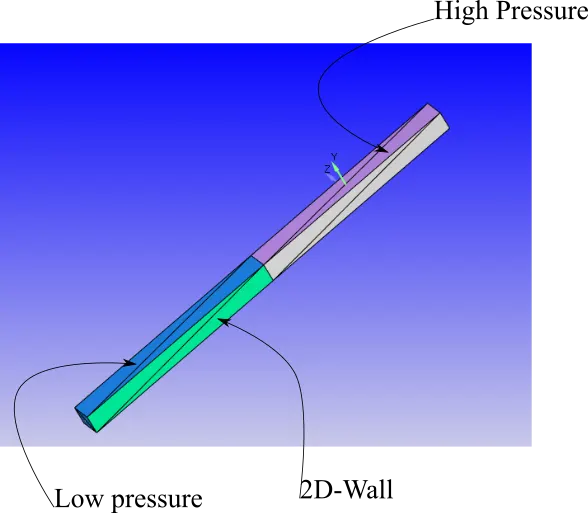
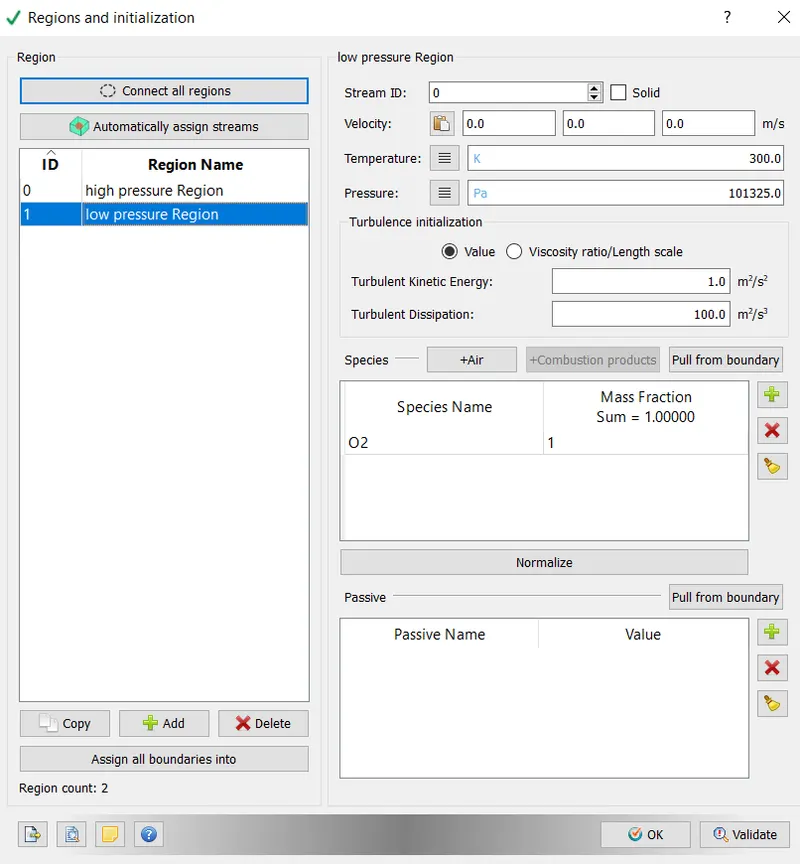
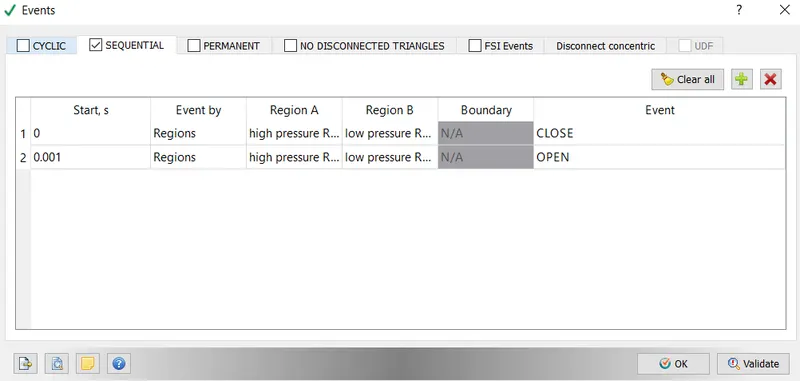
The topic of study is very much applicable to the automotive use except, we are not going to simulate any combustion or chemical reaction, instead mixing of Nitrogen or Oxygen gas has been simulated. In our simulation setup, a rectangular pipe as been divided into high-pressure region and low-pressure region. The high-pressure region contains Nitrogen gas at 600000Pa and on low pressure Oxygen gas is stored at 101325Pa pressure. Both the gases are separated by a diaphragm (physical term) or an event (simulation term). After some time, the diaphragm is to be removed leading to complete mixing of both the gases.
Objective
Simulate the shock wave generation in a pipe when high pressure gas mixes with low pressure gas, or in presence of huge pressure gradient keeping total volume constant.
Outline
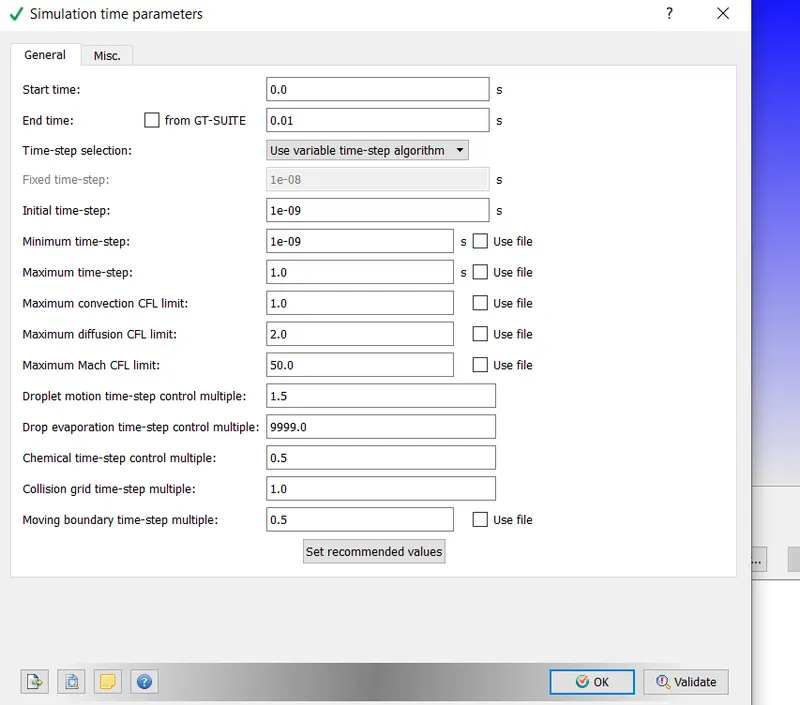
A transient simulation of mixing of Nitrogen gas at 600000Pa and Oxygen gas at 101325Pa is simulated for 0.01 seconds.
The mixing is started at time 0.001s.
Simulation
The geometry has been adapted from the given source with certain modification as discussed below.
Material
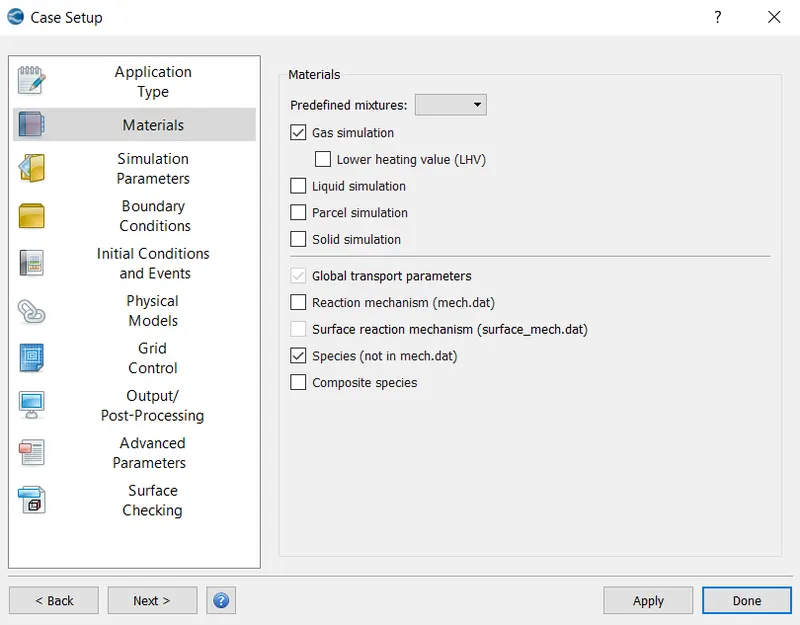
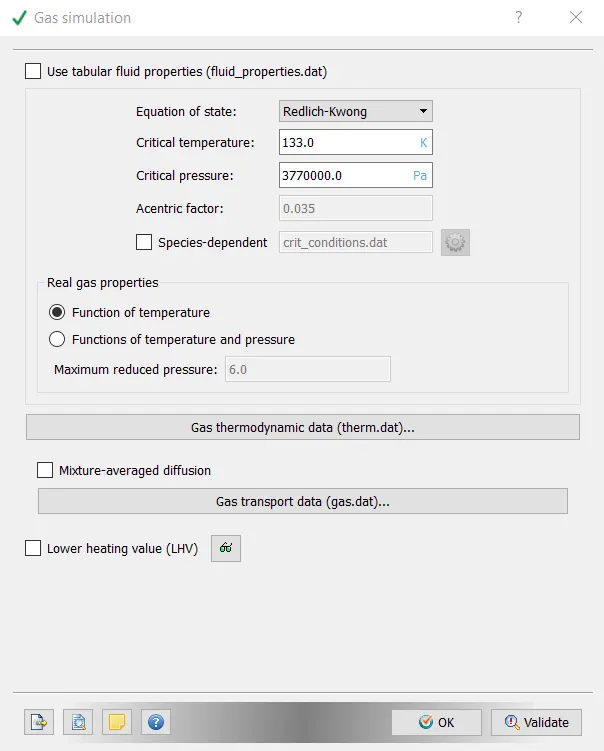
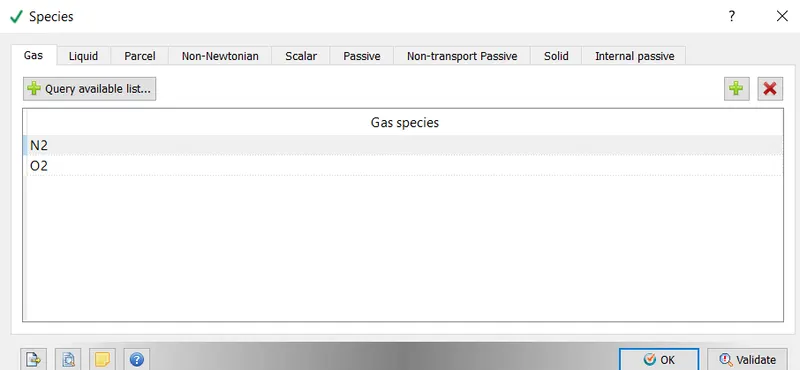
Air with the species of Nitrogen and Oxygen is used in the present simulation
Geometry
The imported geometry had diaphram geometry which led to non manifold problems. The geometry has been deleted. Als, the simulation of diaphram has been done using events.
Boundary
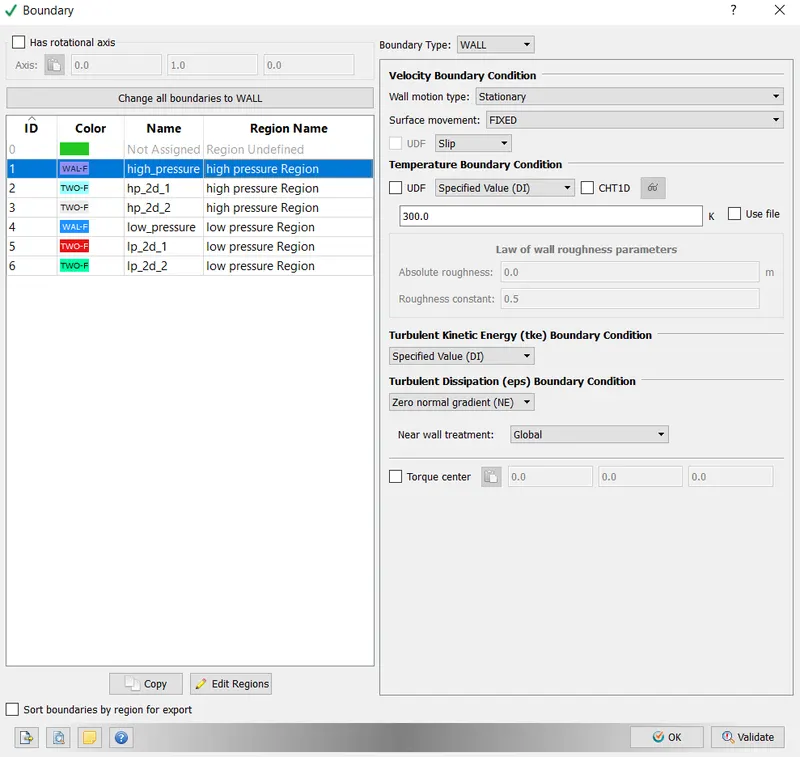
High Pressure Region
Low Pressure Region
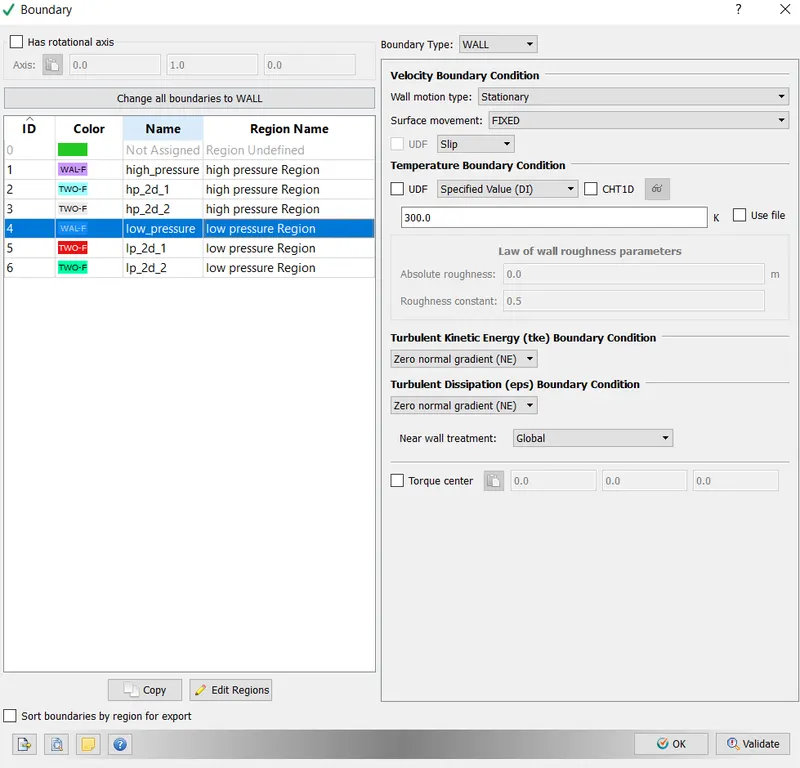
2-D Walls has been given a 2D Boundary Condition.
Regions and Initializations
High Pressure Region
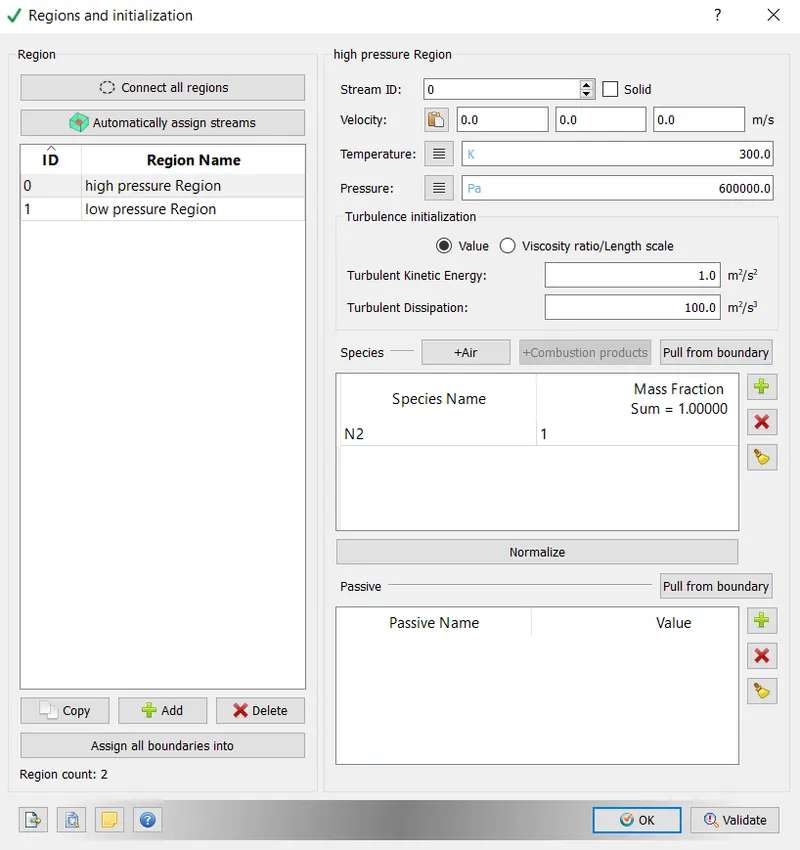
Low Pressure Region
Events
Simulation Parameters
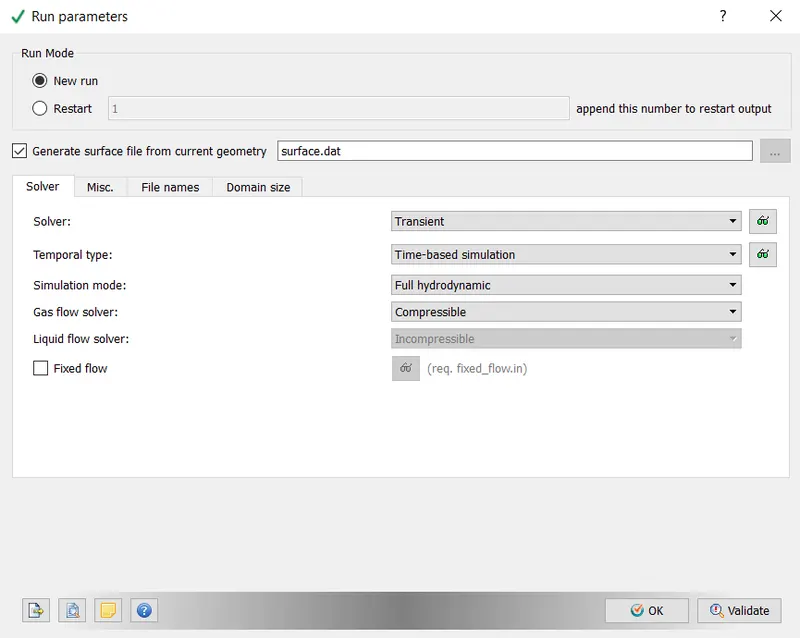
Run Parameter
Simulation Time Parameter
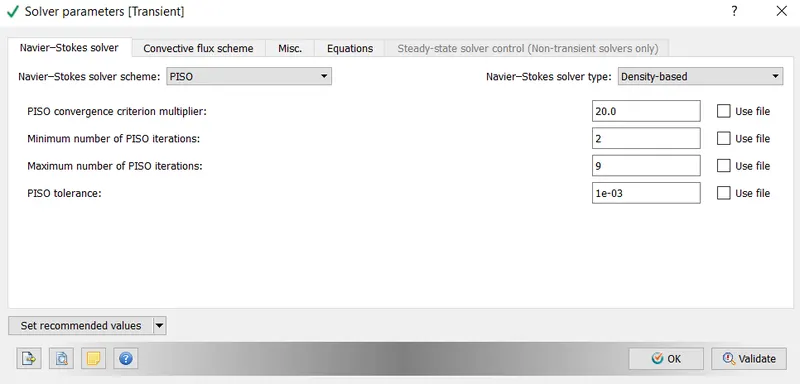
Solver Parameter
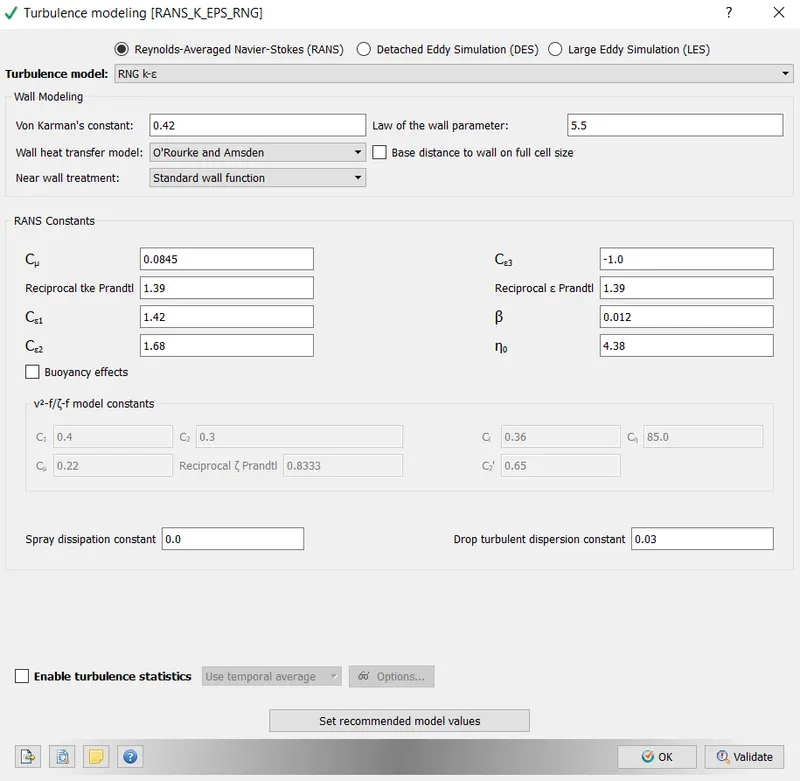
Turbulence Modelling
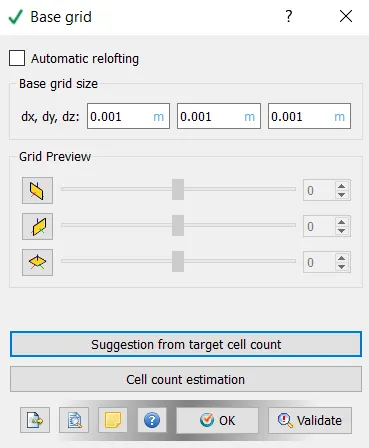
Base Grid
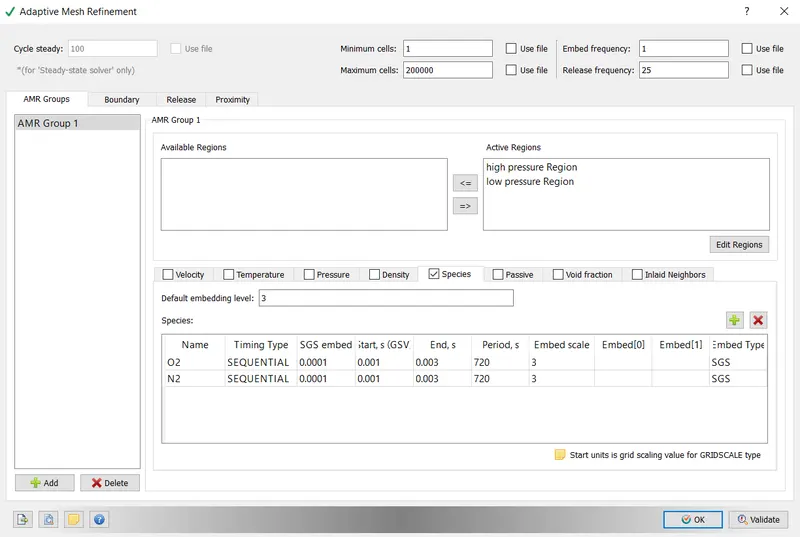
Adaptive Mesh Refinement
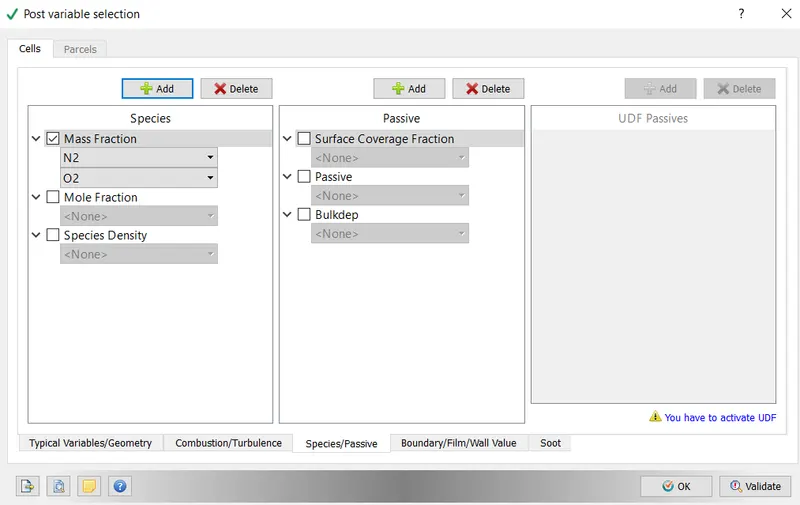
Post variable Selection
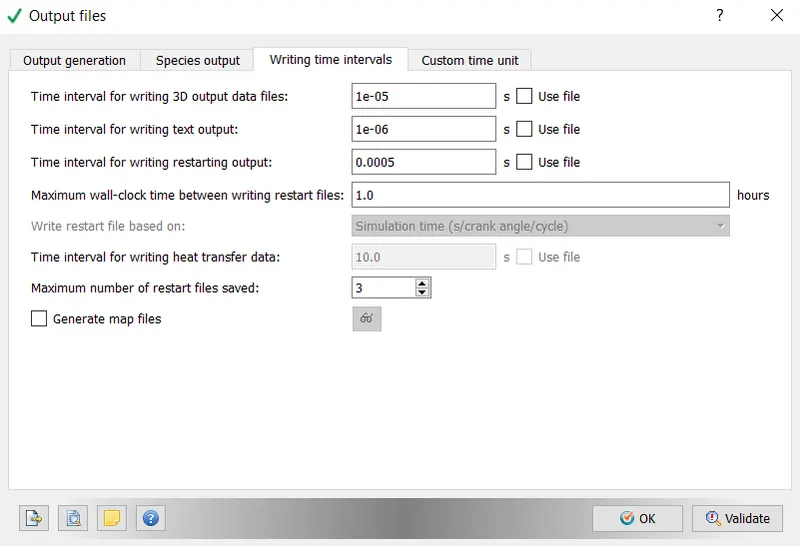
Output Files
Results and Discussions
Pressure Contour Animation
Mass Fraction of Nitrogen Contour Animation
Mean Pressure in Regions vs Time Line Plot
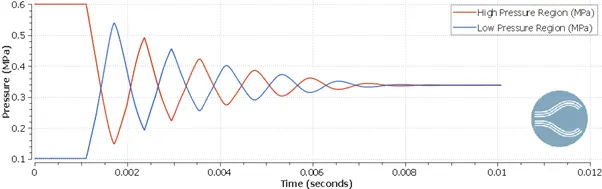
It can be observed from the above plot that, initially there exist a big pressure difference which later stabilizes with time. There is a wavy pattern in pressure variation with time. The wavy pattern signifies the shock waves.
Mean Temperature in Regions vs Time Line Plot
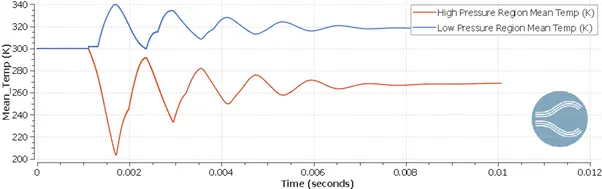
It can be observed from the above plot that the higher and lower pressure regions have same temperature from start till the mixing is allowed. When the gases start mixing, there is a decrease in pressure in the high-pressure region and increase in pressure in low region. Since the difference in pressure is fairly proportional to the temperature, so low pressure region experiences a rise in temperature and high-pressure region experiences temperature drop.
Total Cell Count
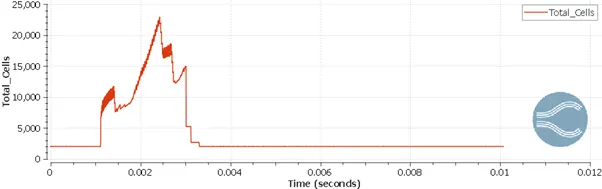
From the above plot, it can be seen that cell count changes when mixing was allowed. This happens as the Additive mesh refinement was enabled for the species mass fraction variation of 0.0001. After change in mass fraction during the simulation goes below the level of 0.0001 there is no mesh refinement.