Week 7: Shock tube simulation project
#Aim:1.To set up Transient shock tube simulation using Converge and Paraview.
2.Plot pressure and temperature plot w.r.t time.
#Introduction:Shock tube experiment is performed to calculate Ignition delay of fuel inside the equipment consist of stainless steel tubes .It is having two sections driver and driven section.Driver section is set at high pressure and driven section is at low pressure.There is diaphragm present between two sections.
Diaphragm set to rupture at certain pressure.Driven section contains Fuel-air mixture along with around 90-95 % dilution gas.(Argon is used as a dilutant).Say Helium used in driver section.
As the diaphragm rupture,high pressure gas moves to low pressure section containing Fuel-air and dilution gas.This causes reflection of waves from the end of tube.There are pressure sensors placed inside the tube.So ignition delay is the time from which the pressure started increasing to onset of combustion.
---------------------------------------------***************--------------------------------------------------
#Geometry:
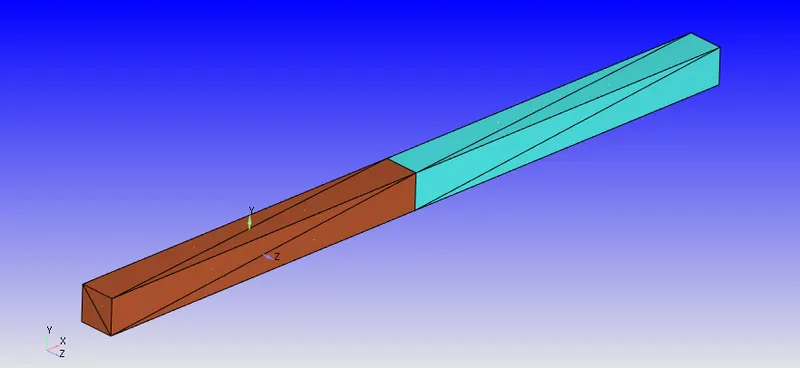
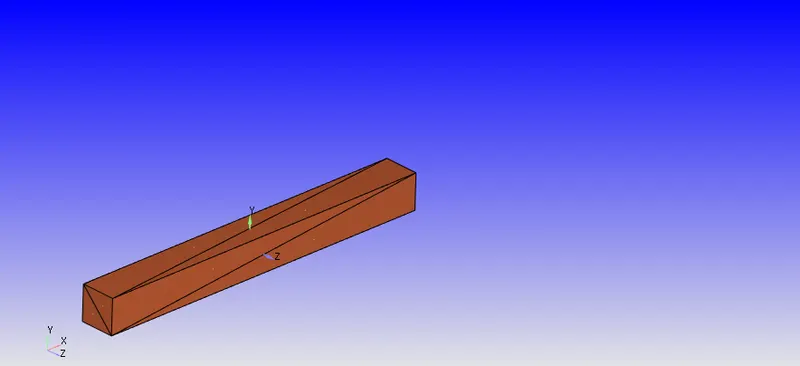
1.Given 3D geometry imported in Converge studio.
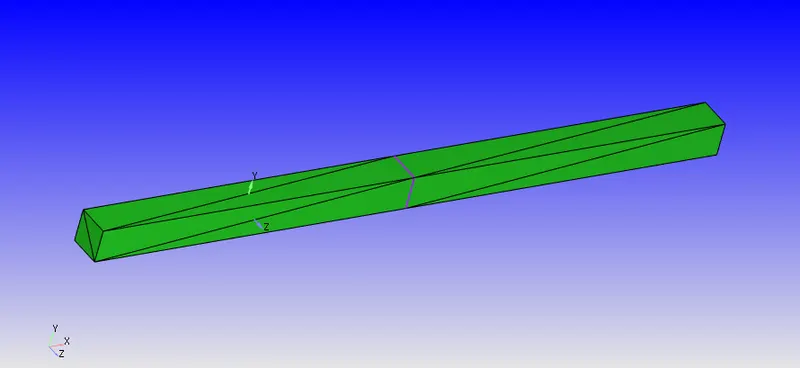
2.Geometry shown by hiding faces.
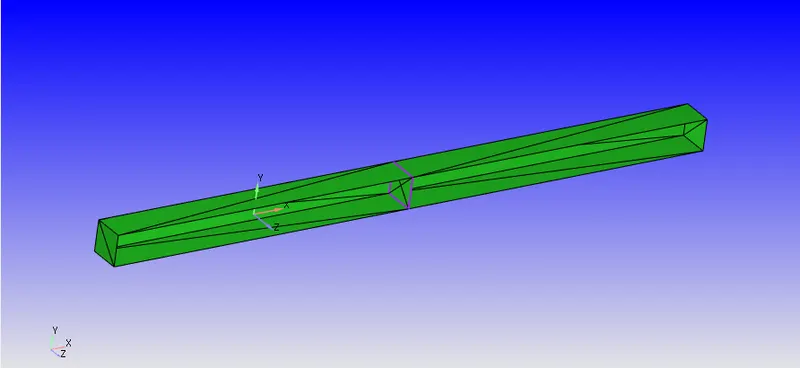
3.Delete the Non manifold problems error.
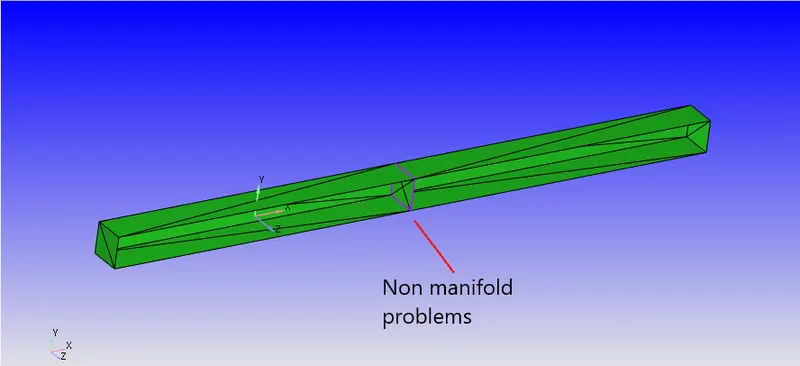
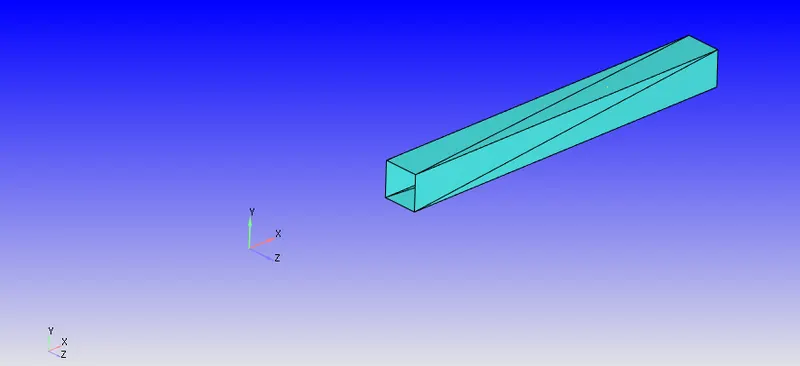
4.Cleaned geometry without any error.
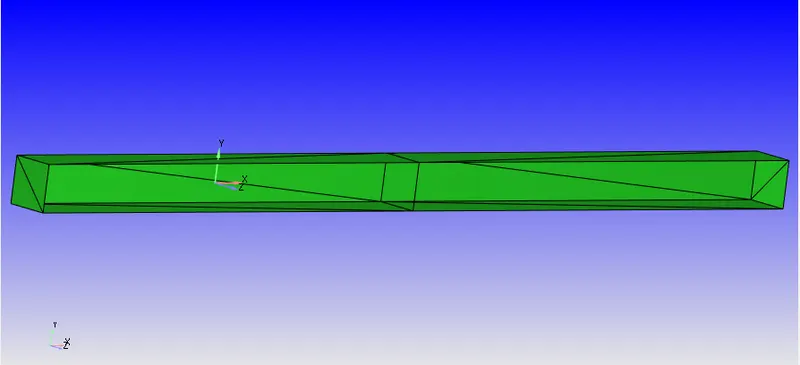
5.Geometry flagged with boundaries.
----------------------------------------**************----------------------------------------------
#Case Setup:
1.Application type-Time based.
2.Materials:-->>Select-->> Gas Simulation and species.
Gas simulation-Air (default setting)
Global transport properties-Default
Species- Gas-N2,O2
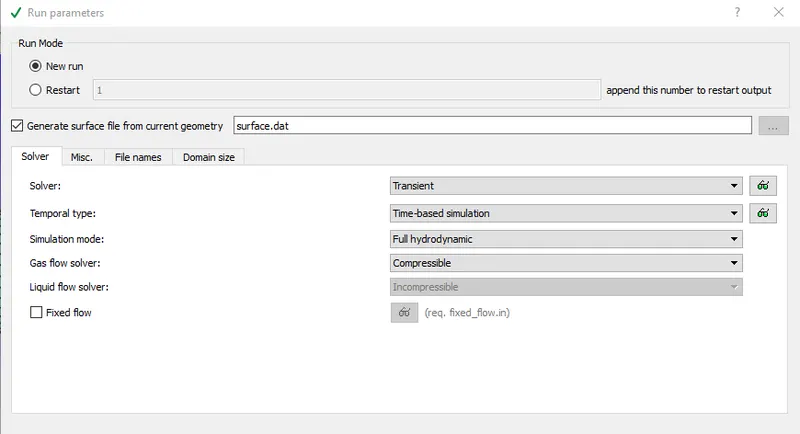
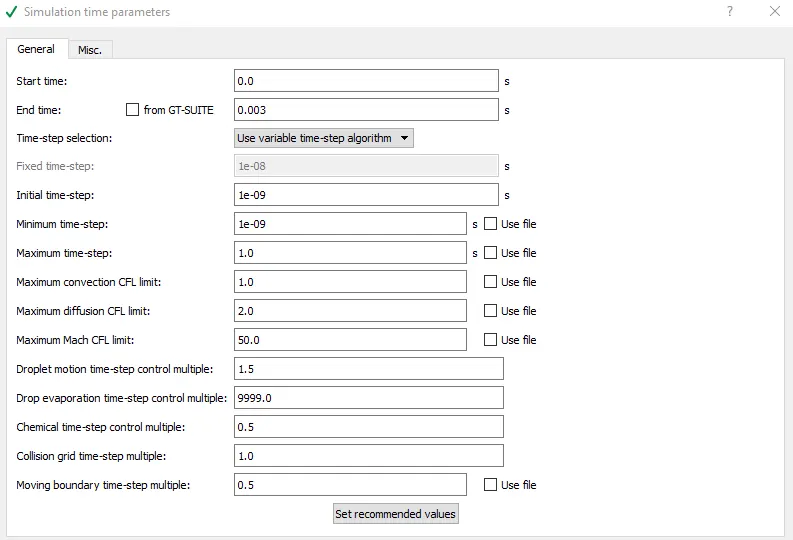
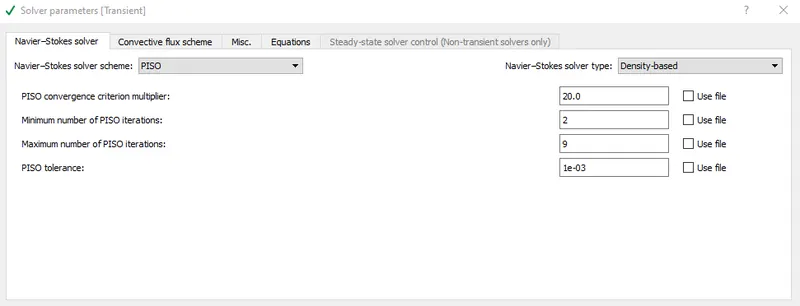
3.Simulation Parameters:
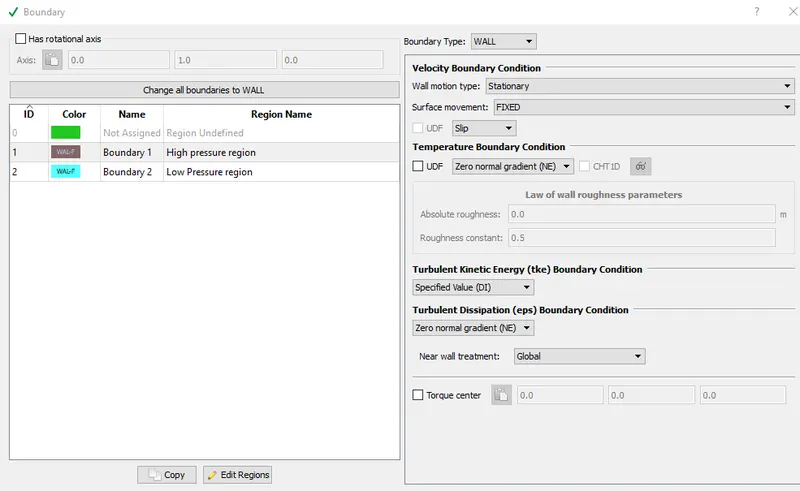
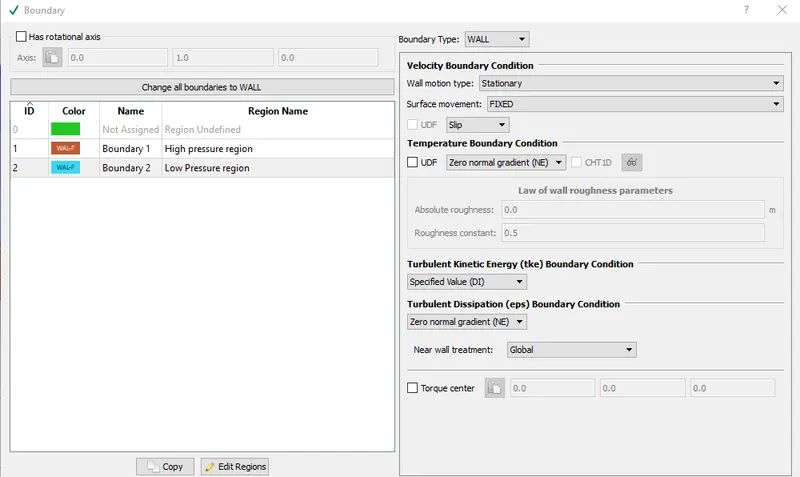
4.Boundary Condition:
1.High pressure boundary:
2.Low pressure boundary:
5.Initial conditions and events:
#Regions and initialization:
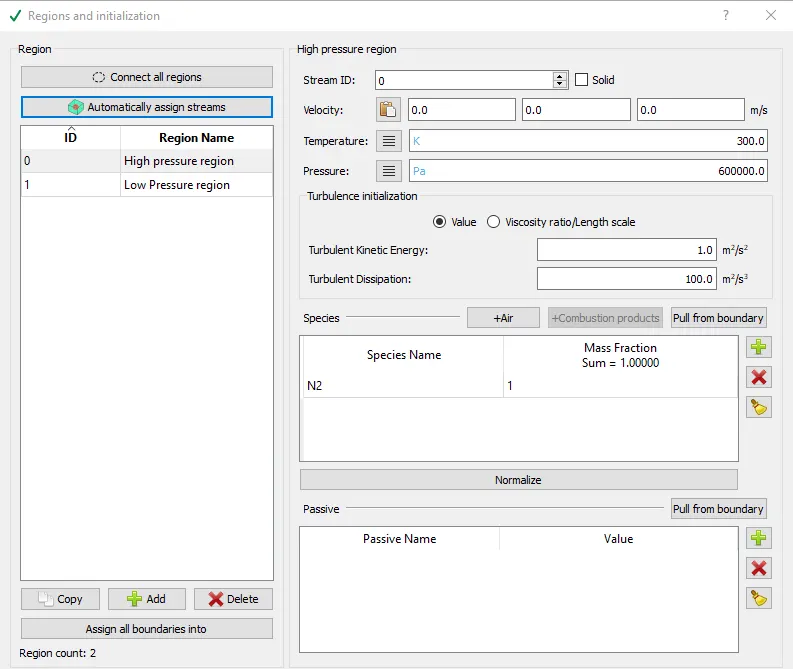
1.High pressure region initialize with N2:
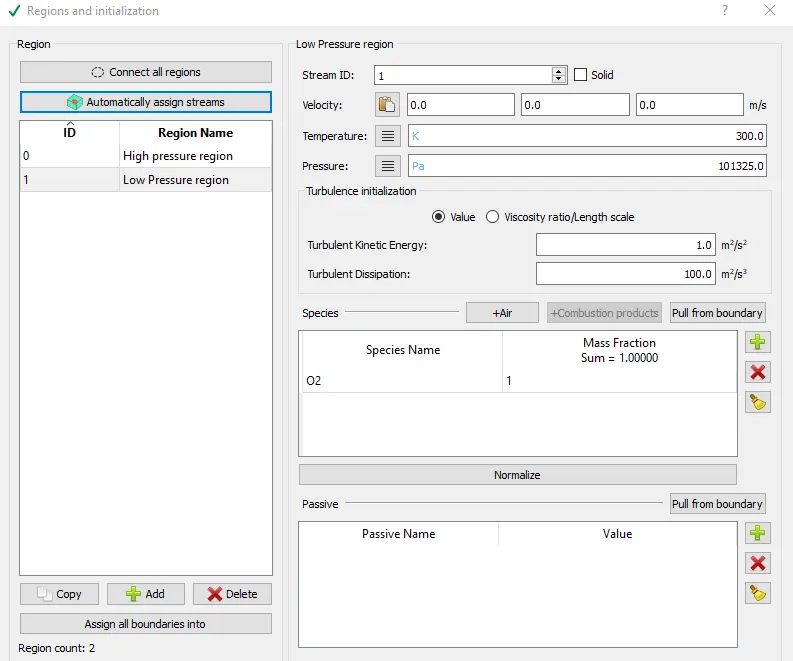
2.Low pressure region initialize with O2:
6.Physical Models:
#Turbulence Model-RNG K-epsilon
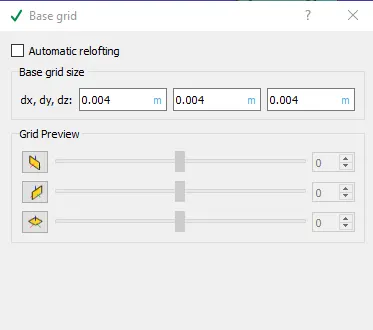
7.Grid control:
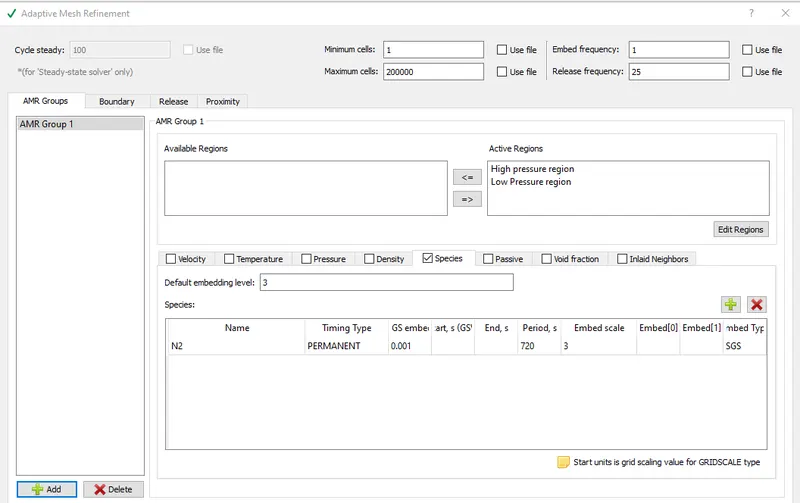
#Adaptive Mesh Refinement:
#8.Output and Post process variables:
1.Post process variable:
Add Mass fractions of N2 and O2.
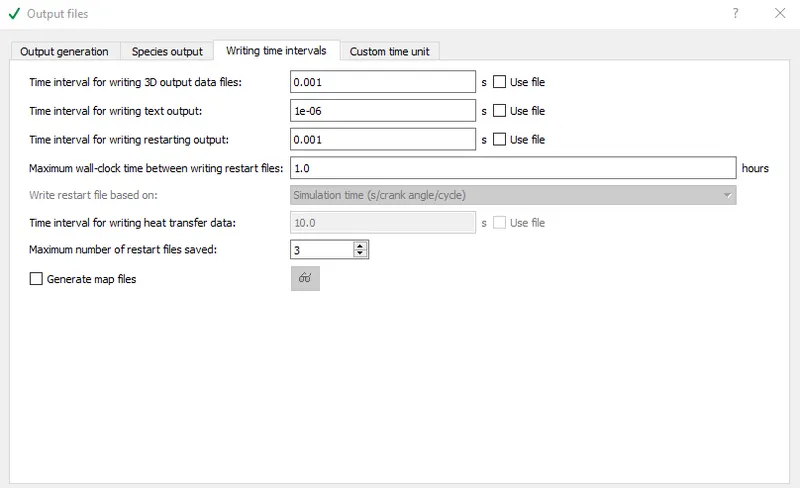
2.Output files:
---------------------------------------------******************--------------------------------------
#Results:
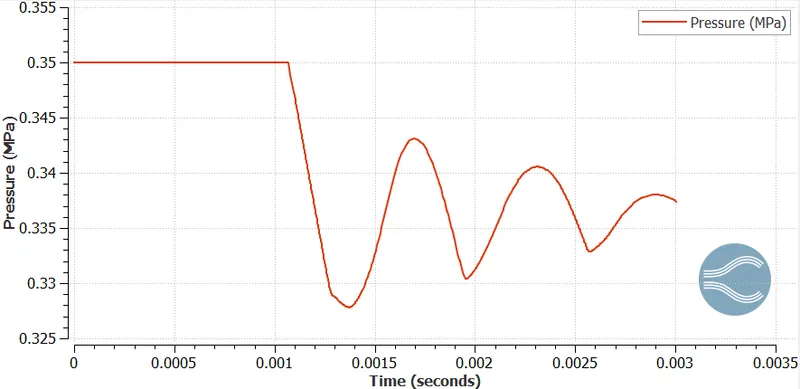
1.Mean Pressure variation with Time plot:
2. Mean Temperature variation with Time plot:
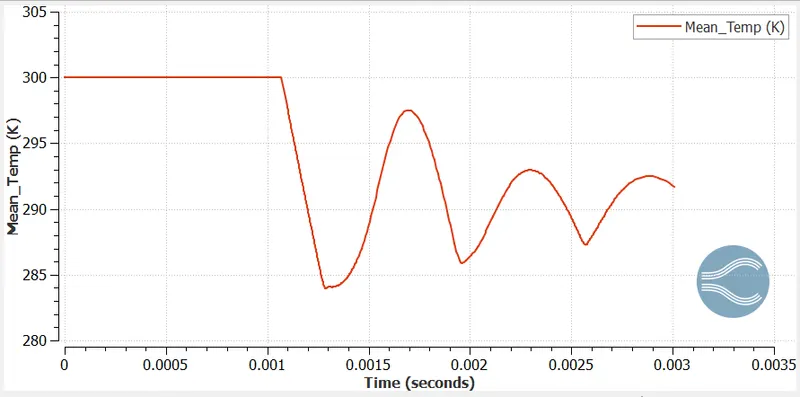
#From the above Temperature and Pressure plot we can see that, when the diaphragm was holding both gases separately,Mean pressure was 0.35 Mpa(0.6 Mpa in N2 region and 0.101325 Mpa).
When diaphragm ruptured at 0.001 sec,shock wave moves towards low pressure region ,after that pressure drops and temperature too.
High pressure N2 gas moves towards low pressure O2 ,and start compressing it.As it compresses it more and more pressure and temperature increase continuously.(we can see @ 0.0017 sec Pressure and temperature is maximum because it has compressed it to max limit)
After that reflective wave formed , and pushes N2 away from the end,so both Pressure and Temperature again drops.
This continue after that too.
---------------------------------------------**************--------------------------------------------
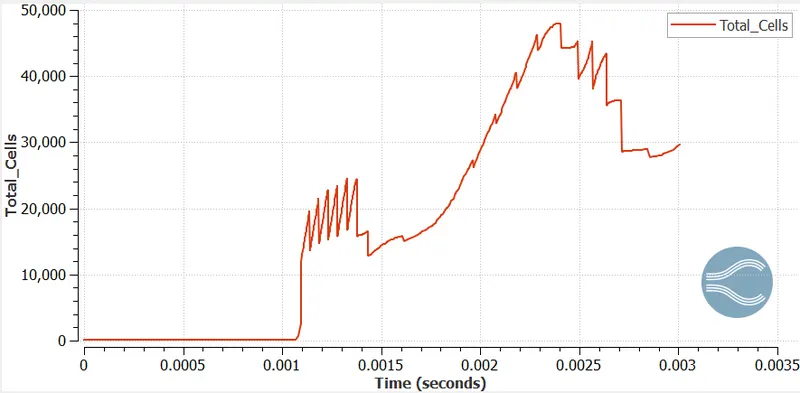
3.Total cells variation with time plot:
#Link to Animations:
#Conclusion:
From the above velocity Animations we can also explain Pressure and Temperature plot.
As the shock wave expand Pressure and Temperature drops and when it compress Pressure and Temperature increases.
---------------------------------********************************------------------------------