Shock tube simulation project using CONVERGE CFD
Aim:
- To run a transient shocktube simulation using CONVERGE CFD.
Shock tubes are devices used to replicate exposions and their effects on an object in small scales by subjecting the test object to direct blast waves. The blast waves are usually generated by the buildup of high pressures which cause diaphragm(s) to burst and a shock wave to propagate down the shock tube.
Objectives:
- To set-up and run transient shock tube simulation and post process the results using PARAVIEW.
- To observe the pressure and temperature history in the entire domain.
- To observe the mesh generation with adaptive mesh refinement enabled.
Set-up:
- Geometry:
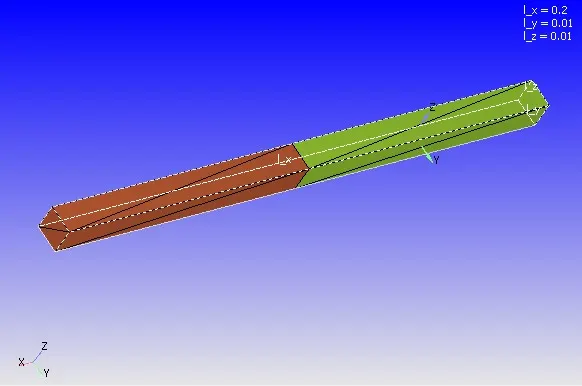
Fig.1 Geometry
- Materials: Air
- Simulation parameters:
Transient simulation with PISO scheme and density based solver
Total simulation time: 0.003 seconds
Minimum time step: 1e-9 seconds
- Boundary conditions:
All walls except front and back marked Slip boundary. Front and back walls marked 2D boundary.
- Initial conditions & events:
1) High pressure region-
Pressure 600000 Pa
Species N2(Mass fraction 1.00)
2) Low pressure region -
Pressure 101325 Pa
Species O2(mass fraction 1.00)
Sequential event set with two regions closed for initial 0.001 seconds of simulation and open for interaction for remaining 0.002 seconds.
- Turbulence model: RNG K-epsilon
- Grid control:
Base grid- 0.002 m (dx,dy,dz)
Adaptive mesh refinement- Sequential type refinement set for both regions, based on change in N2 species throughout the simulation run time with embed scale of 3.
For the remaining setup of simulation, default values were used.
Results:
The simulation ran successfully for 0.003 seconds. The results are discussed below.
- Mesh Generation:
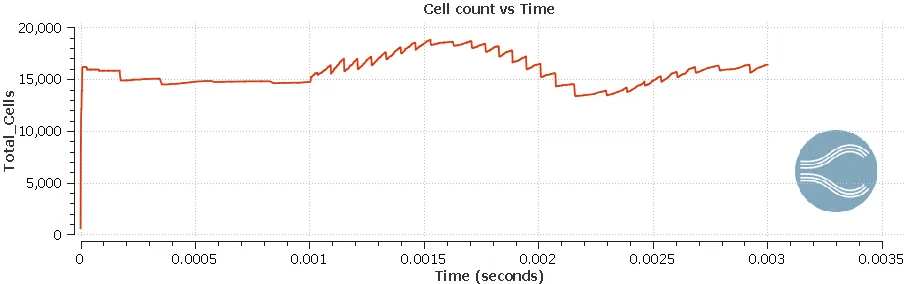
Plot.1 Cell count vs Time
From the above plot, it can be seen that the cell count is varying with time. In the first 0.001 s of simulation when two regions are closed, the initial cell count was fairly constant and near 15000. When the two regions were open, the cell count changed vigourously reaching a peak value of over 19000 and also decreased to less than 14000 cells. The below animation shows the changes in mesh throughout the simulation.
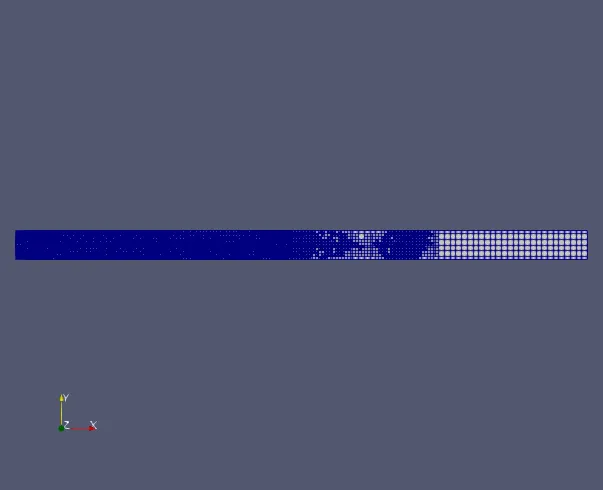
Fig.2 Mesh generated over the domain
As the simulation proceeds, the mesh refinement takes place over the domain thanks to adaptable mesh refinement. As the mesh is refined at regions of concentrations of N2 in the domain as visible in the figure. A closer look at the different embed levels which resulted in the refined mesh is shown below.
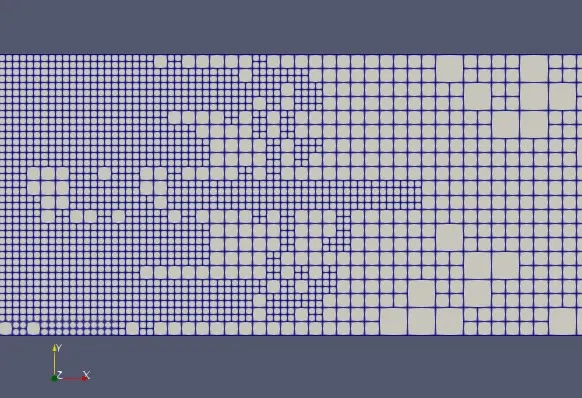
Fig.3 Different embed levels
- Temperature and pressure Contous:
The variations in temperature and pressure observed inside the domain while conducting the simulation is shown below
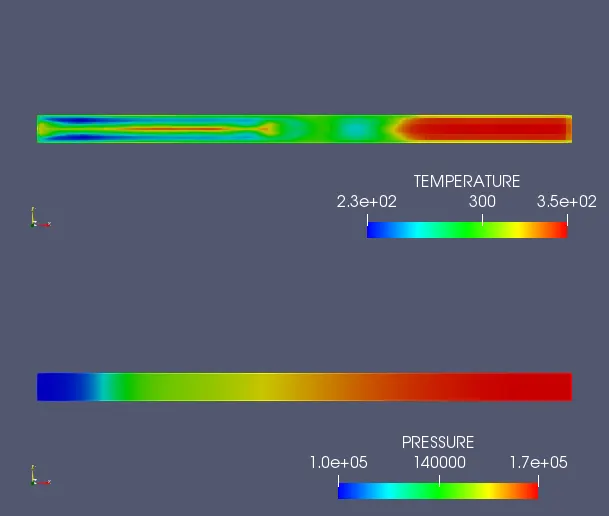
Fig.4 Temperature & Pressure contours
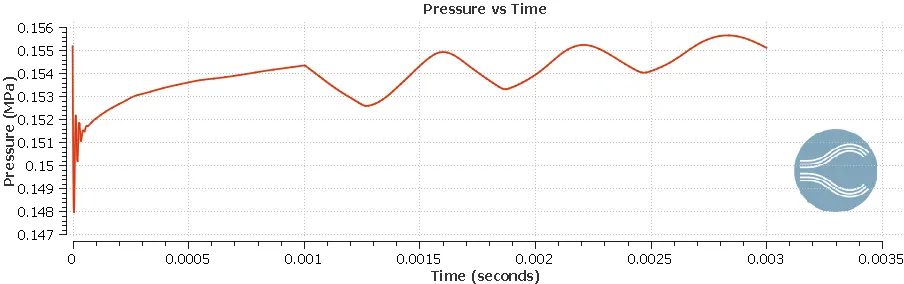
During the initial 0.001s, the regions were closed and high pressure was maintained in high pressure region. As the regions were opened up, a shock wave was generated which dropped the pressure at the high pressure region started dropping as it moved towards low pressure region in the right hand side. As the shock wave struck the wall at the end, it reflected back generating a high pressure in the right hand side. Then again the shock wave struck the left hand side wall creating a high pressure region over there and the cycle continued. A damping effect was noticeable while the shockwave moved periodically from wall to wall.
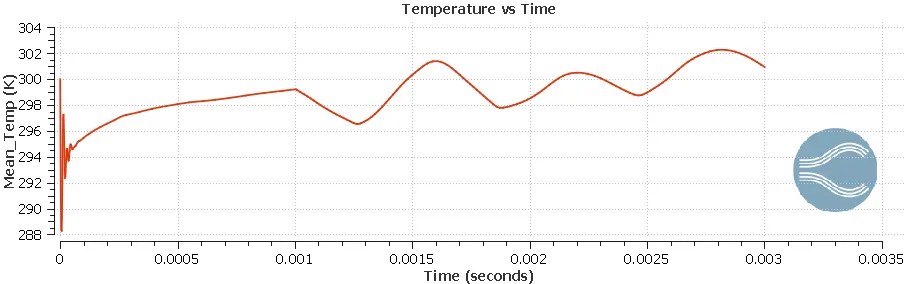
While observing the changes in temperature in the domain, it was seen that temperature rose whenever the shockwave struck the walls owing to the rise in pressure at the instant. Also, the shockwave can be seen causing a ripple effect in temperature as it passes over the domain.
Plot.2 Mean Temperature inside domain vs Time
Plot.3 Mean Pressure inside domain vs Time
The pressure and temperature plots shown above are in coherence with the above discussed contours of pressure and temperature. Also, the plot indicates direct proportionality between pressure and temperature as expected. It can be seen that pressure and temperature inside the domain dropped when the diaphram ruptured and shock wave started propagating towards low pressure region. Also rose when the shock wave struck the wall and rebounded, both the properties rose up again. As the shock wave propagated towards the other side, the same phenmenon repeated and it continued periodically as discussed above with a noticeable damping effect in the amplitude of the cycle.
Conclusion:
Simulation of shock tube was carried out using CONVERGE studio and post processed results using Paraview. Utilized adaptive refinement in grid control for effective refinement of mesh. Observed and examined the changes in temperature and pressure inside the shocktube during the propagation of shock waves inside the shock tube.