Week 7: Shock tube simulation project
Aim: To do transient state simulation for flow in shock tube with the help of converge cfd software.
Objective: 1.To setup a transient shock tube simulation using converge CFD software.
2. To plot the pressure and temperature history in the entire domain.
3. To plot the cell count as a function of time.
4. To discuss and explain the results obtained.
Introduction:
Shock tube
The shock tube is a device to produce high speed flow with high temperatures, by traversing normal shock waves which are generated by the rupture of a diaphram separating a high pressure gas from a low pressure gas. The shock tube is a very useful research tool for investigating not only the shock phenomenon, but also the behaviour of materials and objects when subjected to kinetics of a chemical reaction taking place at high temperature, for example, a body re-entry into the earths atmosphere.
Applications of shock tube
1. The uniform field behind the shock wave may be used as a short duration wind tunnel.
2. The abrupt changes of flow conditions at the shock front may be utilized for studying transient aerodynamic effects, and for dynamic and thermal response.
3. Shock tubes can also be used for studies on relaxation effects, reaction rates, dissociation, etc.
Case setup:
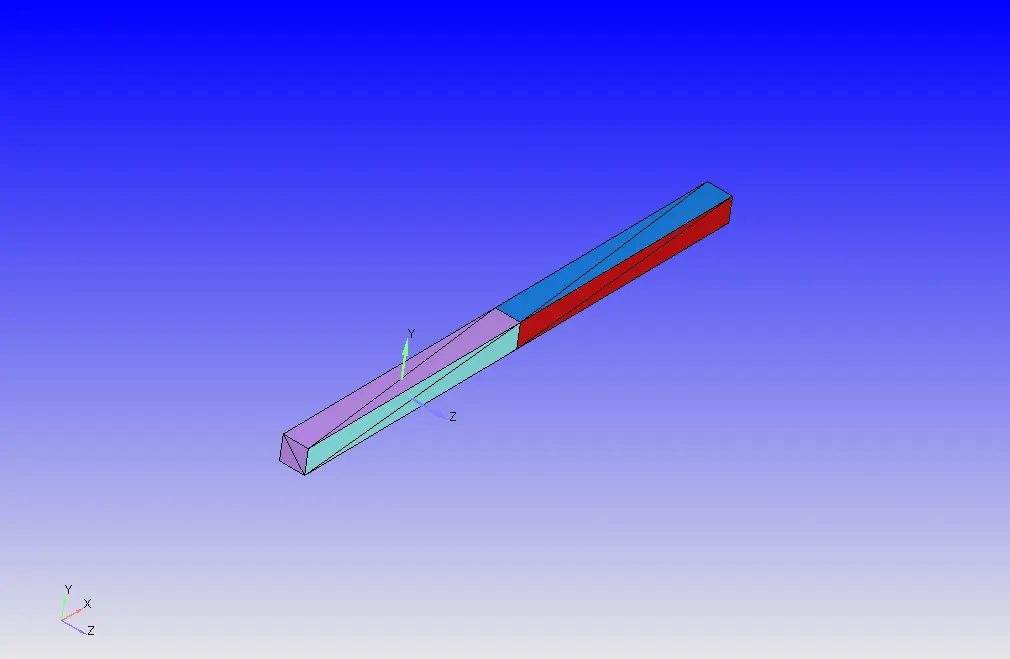
Geometry of shock tube:
Boundary conditions
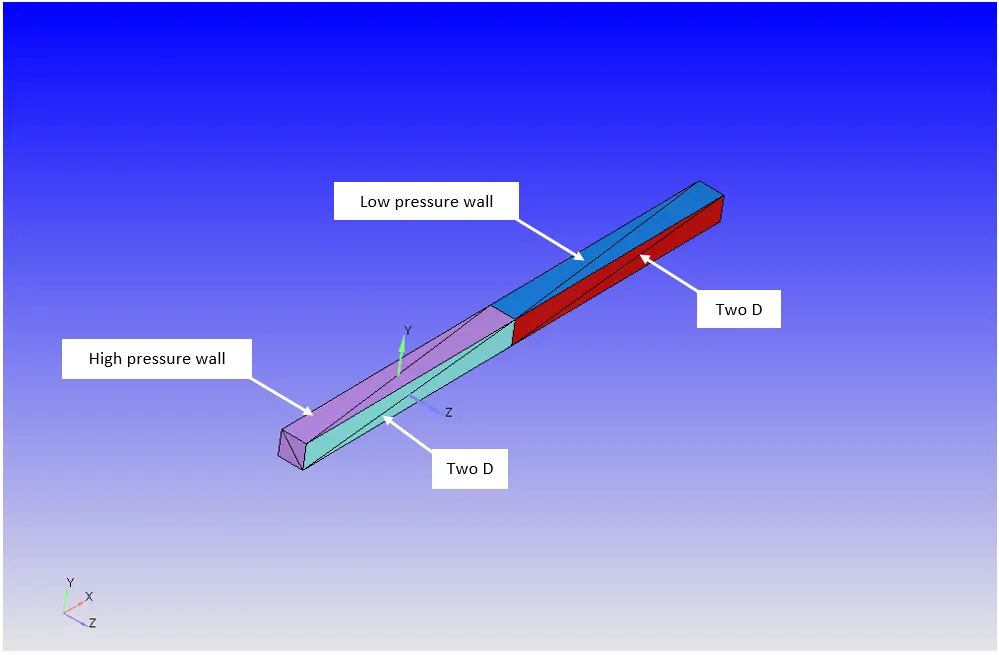
Boundary flagging
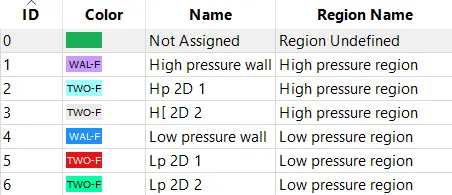
High pressure wall
Boundary type = wall
Wall motion type = stationary
Wall treatment = law of wall
Temperature = 300 K
High pressure front surface
Boundary type = Two-D
High pressure back surface
Boundary type = Two-D
Low pressure wall
Boundary type = wall
Wall motion type = stationary
Wall treatment = law of wall
Temperature = zero gradient (Neumann boundary)
Low pressure front surface
Boundary type = Two-D
Low pressure back surface
Boundary type = Two-D
Assigning the regions to boundaries
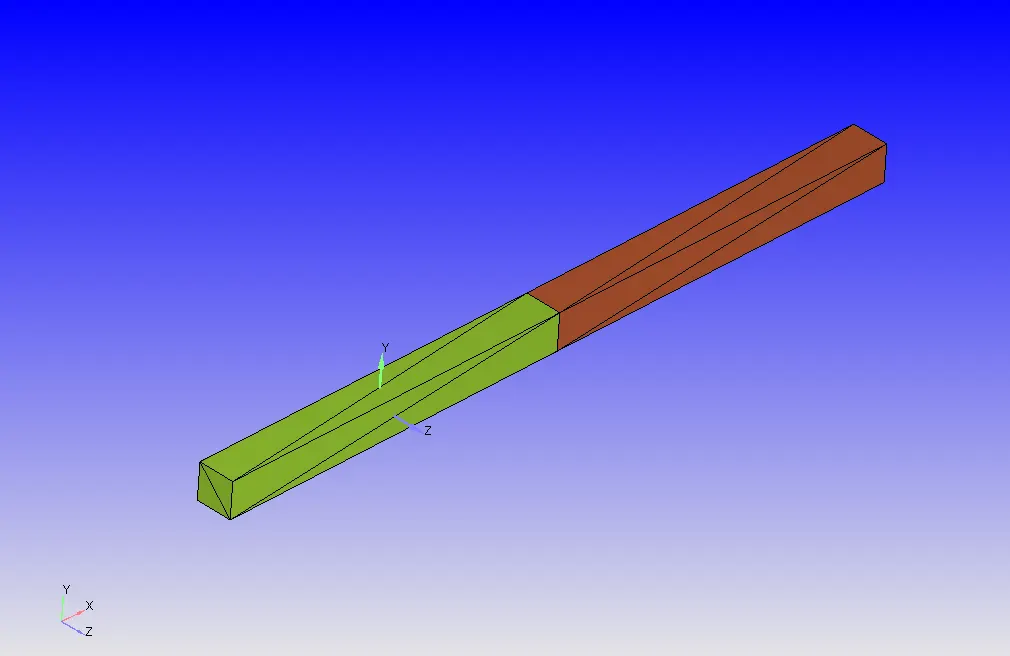
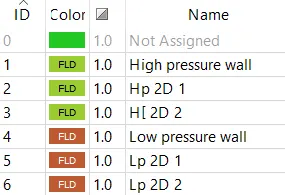
High pressure region
Pressure = 600000 Pa
Temperature = 300 K
Species = N2 (mass fraction 1)
Low pressure region
Pressure = 101325 Pa
Temperature = 300 K
Species = O2 (mass fraction 1)
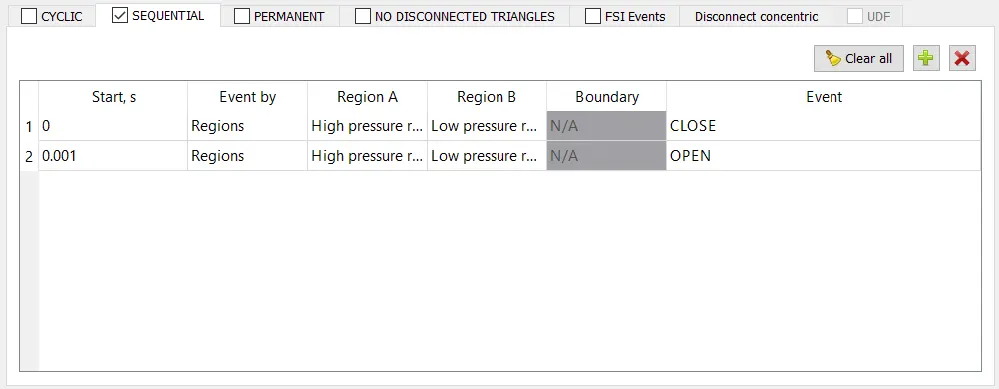
Events
Simulation parameters
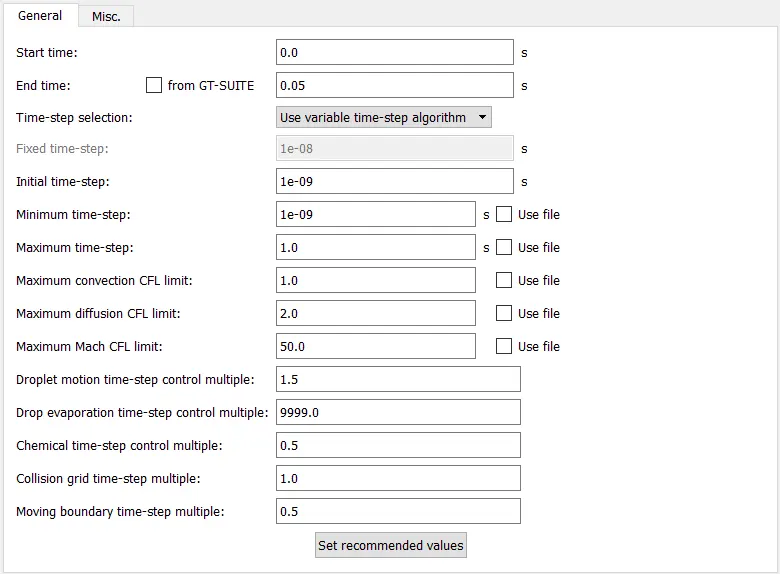
Solver type = transient state pressure based solver
Solver scheme = PISO
Turbulence model = K-epsilon
Base grid size

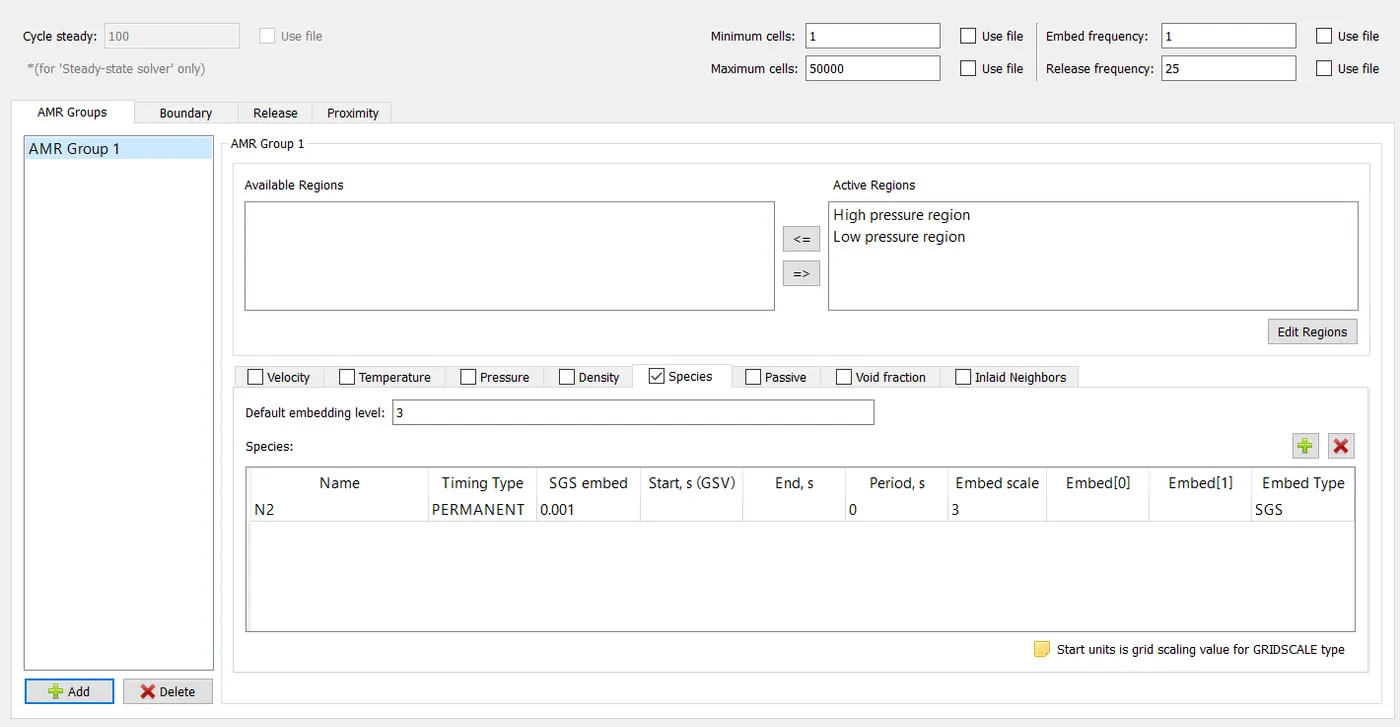
Adaptive mesh refinement
Mesh generated
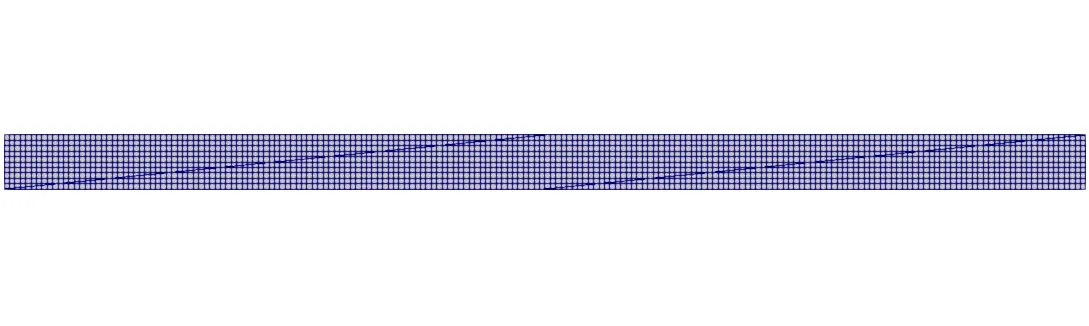
Mesh generated animation
Total cell count plot
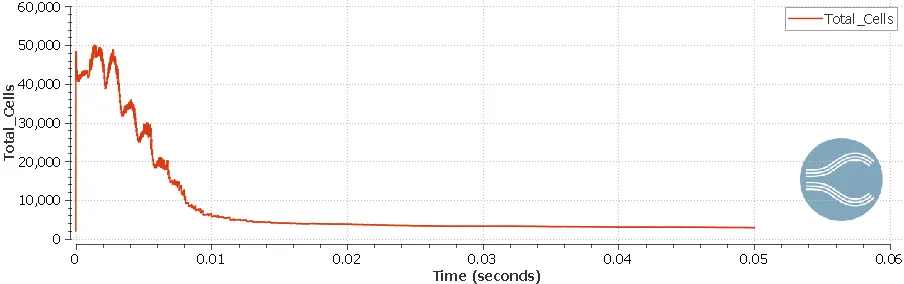
The given shock tube model is imported to converge CFD software. Two different regions with different pressure condition is created, one region with high pressure gas and the other region with low pressure gas. The pressure in the high pressure region is 600000 Pa and the pressure in low pressure region is 101325 Pa and N2 is added as the species in the high pressure region, and O2 is added as the species in the low pressure region. The high pressure region and low pressure is assigned to the respective boundaries. As there is no inflow boundary condition for the flow to take place, the events is used to control the flow between the high pressure region and low pressure region. At time = 0's the event is closed which activates the disconnect triangles and prohibits the flow between the two regions. At time = 0.001's the event is opened which deactivates the disconnect triangles and thus allows flow the two regions. Adaptive mesh refinement (AMR) is used to refine the grid based on the fluctuating and moving conditions of the species. In this case high grid resolution is obtained in the regions where the gradients of N2 species is highest. The size of cells in each embedding layer is calculated based on the formula,
cell size = base grid size/(2^embed level)
The size of cells with base grid size = 0.001 m and embed level = 3 is,
cell size = 0.001/(2^3) = 0.000125 m
The results obtained from the simulation is discussed below.
Results
N2 mass fraction contour
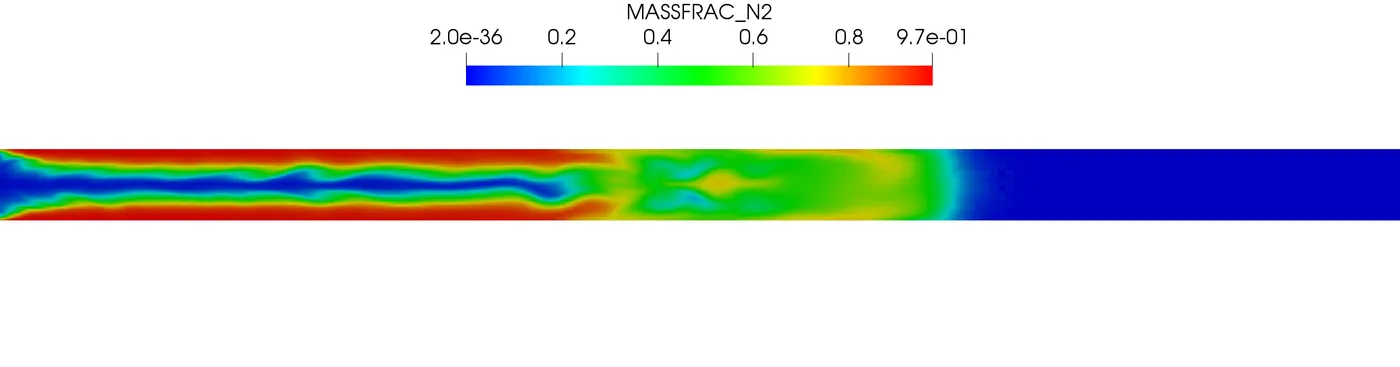
N2 mass fraction animation
O2 mass fraction contour
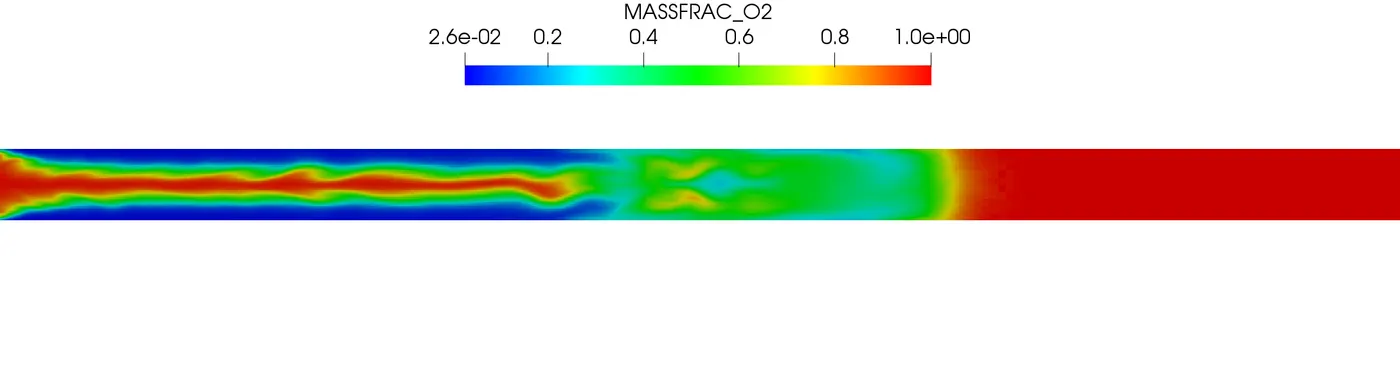
O2 mass fraction animation
Pressure contour

Pressure animation
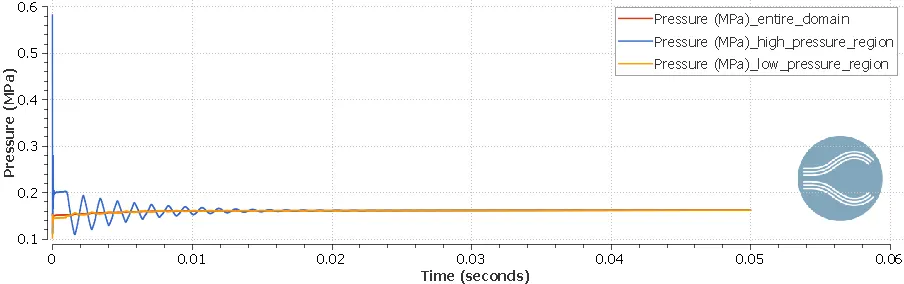
pressure plot
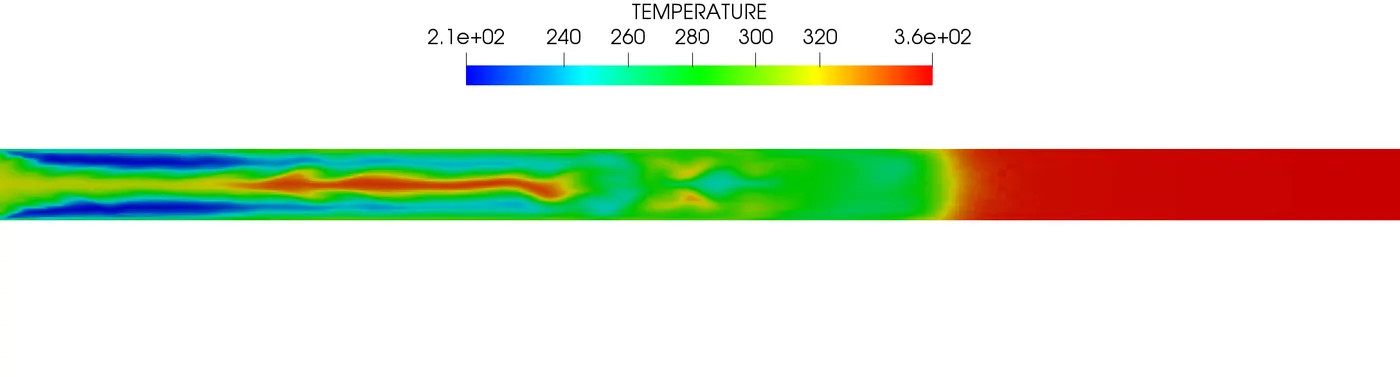
Temperature contour
Temperature animation
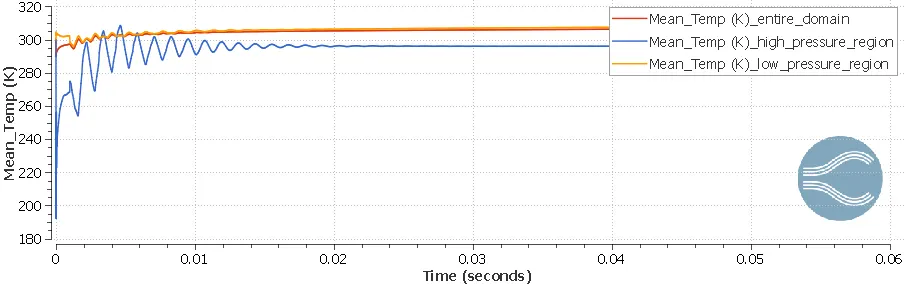
Observation:
1. The gas in the high pressure region flows into the low pressure region and a shock wave is propagated into the low pressure region. As the high pressure gas reaches the end of wall it gets reflected with a velocity lower than the shock wave. This is knwon as reflected shock wave.
2. The fluctuation in the pressure plot and temperature plot is seen due to the propagation of shock wave and reflected shock wave from one end of the wall to the other end.
3. As there is drastic change in the mass fraction of N2, it can be seen from the total cell count plot more number of cells are generated whenever there is fluctuation of N2 species movement, and once there is no fluctuation of N2 species the total number of cells are low and constant.
Conclusion:
In this project, the transient state simulation of shock tube is perfomed by using converge CFD software. The flow between two regions is achived by using events. It is observed that AMR generates more number of cells when the specified species fluctuates and satidfies the embed criteria.