Week-7 Head Impact

Introduction to Head Injury
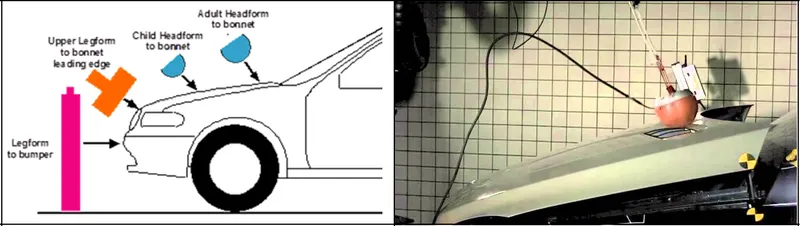
Head injuries in pedestrian/automobile impacts are among the most common and most harmful of all pedestrian impact inquiries. Field studies, experimental studies, and analytical simulations all show that when pedestrians are struck by the front of an automobile, they are generally thrust onto the hood or fender, and sometimes onto the windshield. Pedestrian impacts onto the hood, fender, or windshield generally result in a head impact injury. Upon impact the softness of the hood or fender greatly affects the severity of the head injury. If the impact is to a relatively flat region of the hood, sufficiently high above the motor and frame understructure, the deformation of the hood will absorb the energy of the impact and thus reduce the injury severity. Alternatively, if the impact is to a "hard" spot, the injury severity will increase. Especially hard regions are the seams between the hood and the fender and between the hood and the windshield or cowl.
In this project, we develop and present procedures for evaluating hood impact response. We will see the impact of a Pedestrian Head with the Hood and evaluate the results by calculating Head Injury Criteria (HIC) values.
Introduction to Pedestrian
Definition of Pedestrian- “A pedestrian is a person travelling on foot, whether jumping, jogging, walking or running. In some communities, those travelling using tiny wheels such as roller skates, skateboards, and scooters, as well as wheelchair users are also included as pedestrians. In modern times, the term mostly refers to someone walking on a road or sidewalk”.
Vehicle safety has become the most important issue in automobile design. Hence, manufacturers now incorporate numerous safety devices and features in vehicles, including airbags, energy-absorbing steering columns, side-door beams, etc. However, all efforts to improve safety devices focus on enhancing safety features for occupants. Notably, pedestrians are the third largest category of traffic fatalities. Thus, vehicle safety should not just focus on vehicle occupant safety: protecting pedestrians is an important field in traffic safety. Many countries and automotive manufacturers have recently been concerned with ways to reduce pedestrian fatalities and head injuries. Developing pedestrian-friendly vehicles is one solution for reducing the pedestrian fatality rate. To assess the degree of pedestrian protection of a Vehicle, it is necessary to develop an efficient evaluation and analysis methodology to examine vehicles for pedestrian protection. The EEVC, IHRA and NHTSA have developed pedestrian subsystem test methods that assess vehicle capabilities to protect Pedestrian.
Head Injury Criteria
The head injury criterion (HIC) is a measure of the likelihood of head injury arising from an impact. The HIC can be used to assess safety related to vehicles, personal protective gear, and sport equipment.
Normally the variable is derived from the measurements of an accelerometer mounted at the center of mass of a crash test dummy’s head, when the dummy is exposed to crash forces.
It is defined as:

Where t1 and t2 are the initial and final times (in seconds) chosen to maximize HIC, and acceleration a is measured in gs.(standard gravity acceleration). The time duration, t2 – t1, is limited to a maximum value of 36 ms, usually 15 ms.
This means that the HIC includes the effects of head acceleration and the duration of the acceleration. Large accelerations may be tolerated for very short times.
At a HIC of 1000, there is an 18% probability of a severe head injury, a 55% probability of a serious injury and a 90% probability of a moderate head injury to the average adult.
_____________________________________________________________________________________________________________________
Analysis:
Pedestrian protection CAE is a part of vehicle safety engineering from a crash perspective. In pedestrian protection, we look for imparting minimum injury to head, upper leg (thigh), lower leg (including Knee) in case of an accident with a human subject. These tests are usually done at a lower velocity from 20-40 kmph as accident tends to result in more severe circumstances above these velocities and braking in case of an accident often results in collision at low velocities.
We will see the analysis in different cases starting from the scratch and finally the Head impact with the Hood.
We will perform the analysis first with the simple head in the form of ball and instead of hood, we will use Rigid wall.
Then by replacing the ball with pedestrian head and finally a pedestrian head with the hood.
- In this project, a children’s head form model is used.
- Angle of Impact of the Simple Head or Pedestrian Head kept at 45 0 angle at Rigid wall as well as Hood.
Three different cases from the starting level to end are described as below:
CASE_1: Simple Head Impact with Rigid Wall
CASE_2: Pedestrian Head Impact with Rigid Wall
CASE_3: Pedestrian Head Impact with Hood
_____________________________________________________________________________________________________________________
FEA Models:
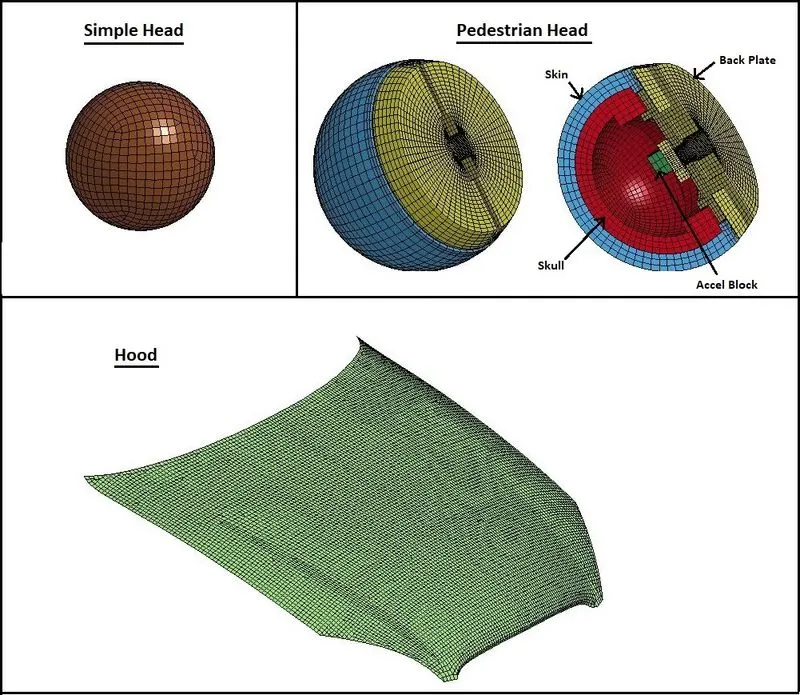
Different FEA models for Head as well as Hood model for the analysis are shown as below:
_____________________________________________________________________________________________________________________
Procedure:
CASE_1:
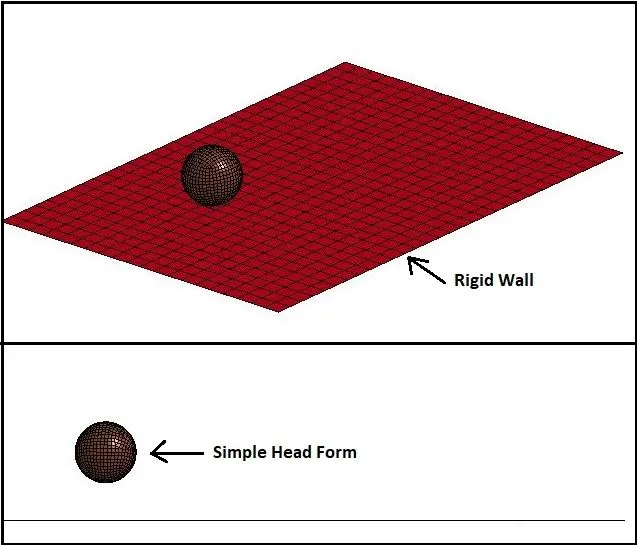
In this case , simple head form is used and it has imparted on the Rigid Wall.
- Import the “Simple Head Model”.
- Create a Rigid Wall of 4 node shell elements with help of Shape Mesher.
- Keep the distance between Simple Head and the Rigid Wall up to 100 mm.
Keywords Details:
CASE_1:
- Define Transformation:
- Translate: (A1=0, A2=0 , A3=-675.344, A4=0, A5=0 , A6=0, A7=0)
Here, to move the Head form up to 100 mm distance from the Rigid wall according to Global coordinate system, “Translate” option is used to define the transformation.
- Include Transform: Here , to include the head model in to current file, “Include Transform” keyword is used with the “TRAINID” given in the “Define Transformation”
- Boundary:
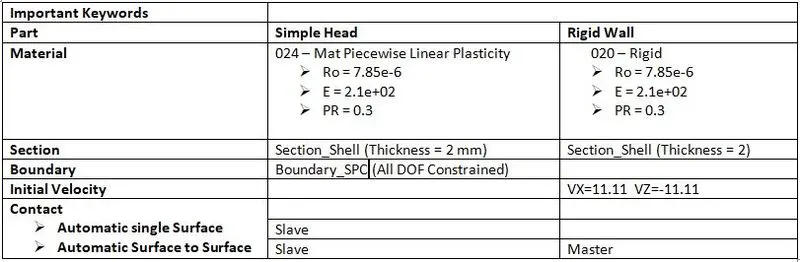
- SPC_SET:
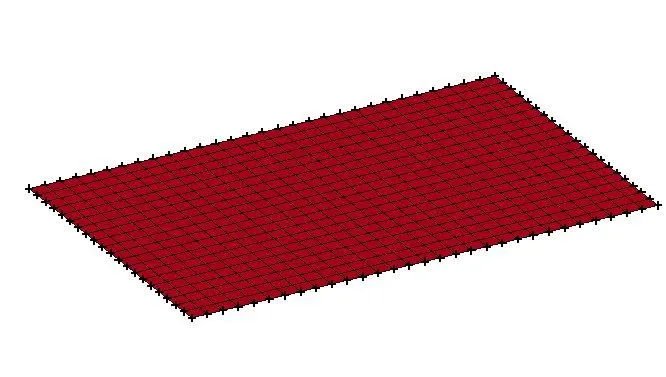
Here the nodes of the Rigid Wall are constrained in all translational as well as rotational direction as below:
- Initial Veocity:
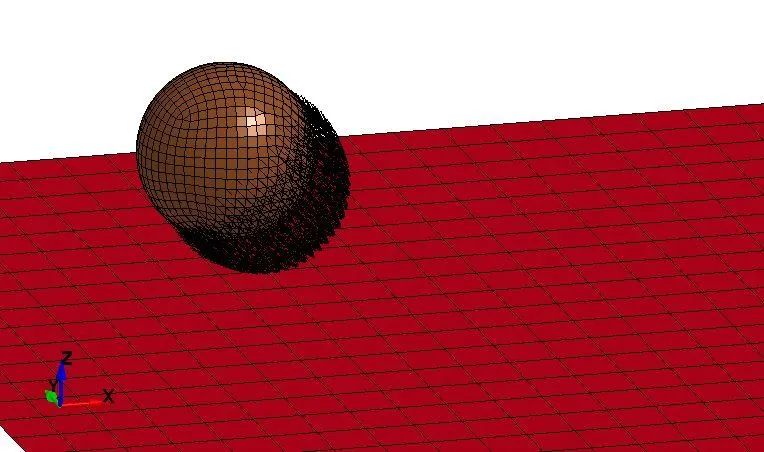
- All nodes of Simple Head Form are selected to apply velocity to the head form.
- Initial velocity is set to 40Kmph = (40/3600)*1000 = 11.11 mm/ms.
- To impart the head form at 450, velocity in X direction as VX = 11.11 and velocity in Z direction VZ = 11.11 is given as below:
- Control:
- Termination: Termination time is given as 20 ms.
- Database:
- Binary -> D3Plot and Ascii-> GLSTAT, MATSUM, SECFORCE, NODOUT and RCFORCE at 0.01 interval time are generated for different outputs as well as animation.
- History_Node_ID: This keyword is used to get the accelerations of different nodes on the head.
CASE_2:
In this case, the Simple Head is replaced with the Pedestrian Head, which is imparted on the Rigid Wall.
- Define Transformation:
- Translate: (A1=0, A2=0 , A3=-225.7, A4=0, A5=0 , A6=0, A7=0)
- Rotate : (A1=0, A2=1 , A3=-0, A4=0, A5=0 , A6=225.7, A7=-45)
Here, to move the Head form up to 100 mm distance from the Rigid wall according to Global coordinate system, “Translate” option is used to define the transformation.
Also to rotate the Head at 450, “rotate” option is used while defining transformation.
- Include Transform: Here , to include the head model in to current file, “Include Transform” keyword is used with the “TRAINID” given in the “Define Transformation”
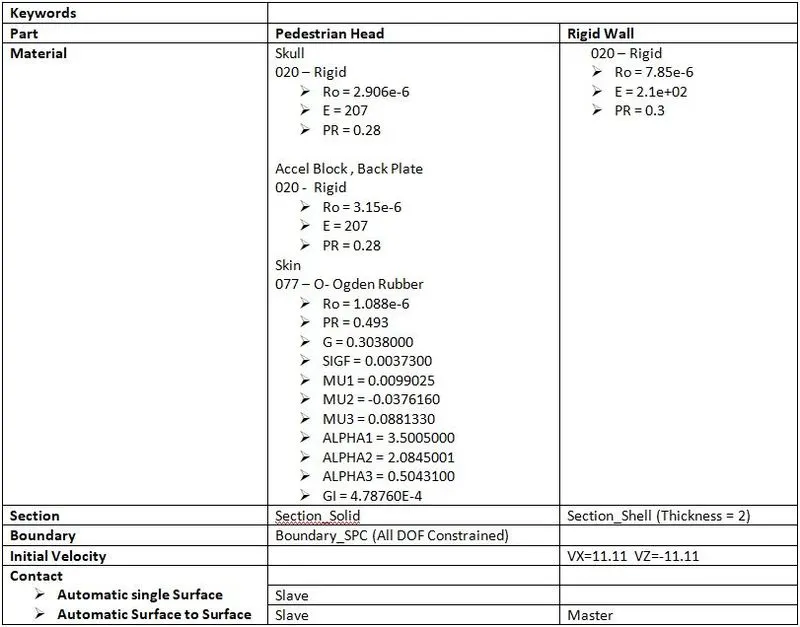
- Database:
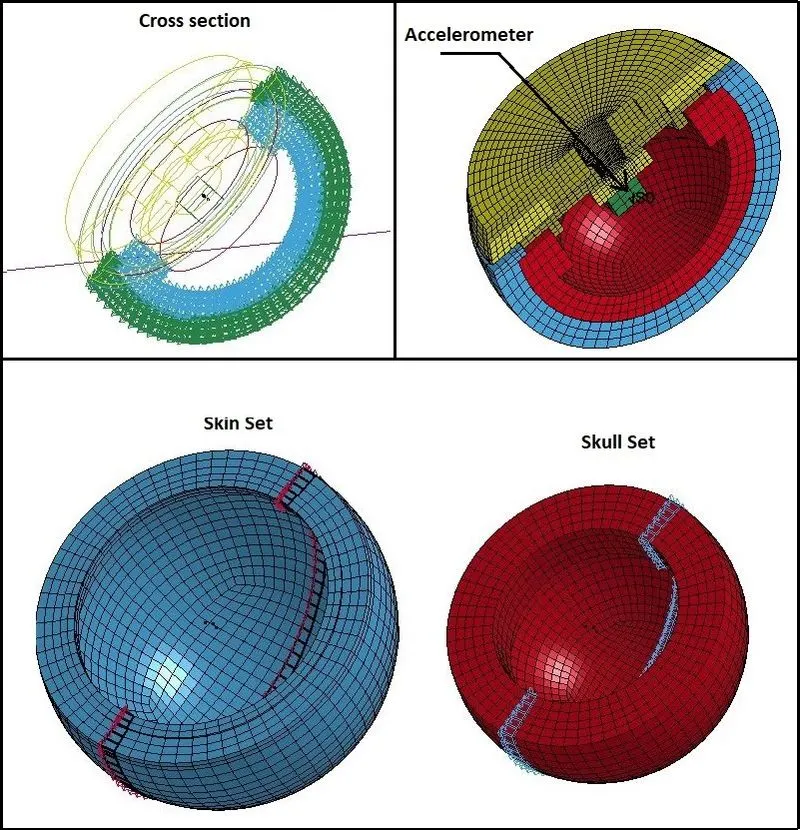
- History_Node_ID: This keyword is used for creation of Head Accelerometer at the CG. Node of Pedestrian Head form. Accelerometer is created at the Node ID : 25679.
Apart from that different nodes are selected for the nodel accelerations.
- Cross_Section_Set: To get the cross sectional forces on the Head, this cross section set for Skull as well as skin is created as below:
- Other Database, Control etc cards are created same as the CASE_1.
CASE_3:
In this case, Rigid Wall is replaced with Hood. Pedestrian Head is imparted on Hood.
- Define Transformation:
- Rotate : (A1=0, A2=1 , A3=-0, A4=0, A5=0 , A6=0, A7=45)
Here, to rotate the Head at 450, “rotate” option is used while defining transformation.
- Include Transform: Here , to include the head model in to hood file, “Include Transform” keyword is used with the “TRAINID” given in the “Define Transformation”
- Material:
- 001-Elastic (Low Carbon Steel)
- Ro = 7.85e-6
- E = 2.1e+02
- PR = 0.31
- 001-Elastic (Low Carbon Steel)
Other Material details about Pedestrian Head are same as CASE_2.
- Boundary:
- SPC_SET:
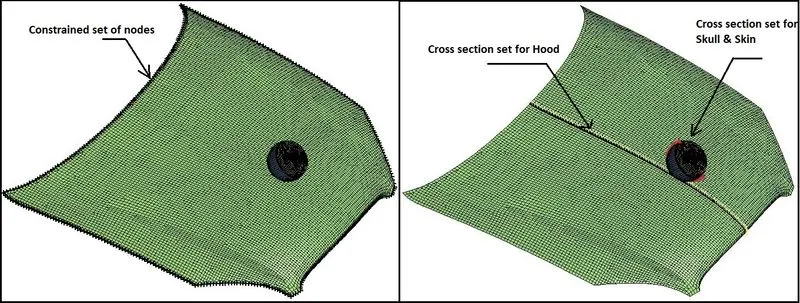
Here the boundary nodes of the Hood are constrained in all translational as well as rotational direction as below:
- Database:
- History_Node_ID: This keyword is used for creation of Head Accelerometer at the CG. Node of Pedestrian Head form. Accelerometer is created at the Node ID : 25679.
Apart from that different nodes are selected for the nodal accelerations.
- Cross_Section_Set: To get the cross sectional forces on the Head, this cross section set for Skull as well as skin is created as CASE_2.
- Apart from the Head, Cross section set is created for the Hood as shown in above image.
- Other Database, Control etc cards are created same as the CASE_2.
_____________________________________________________________________________________________________________________
Results:
CASE_1:
Stress Contours:
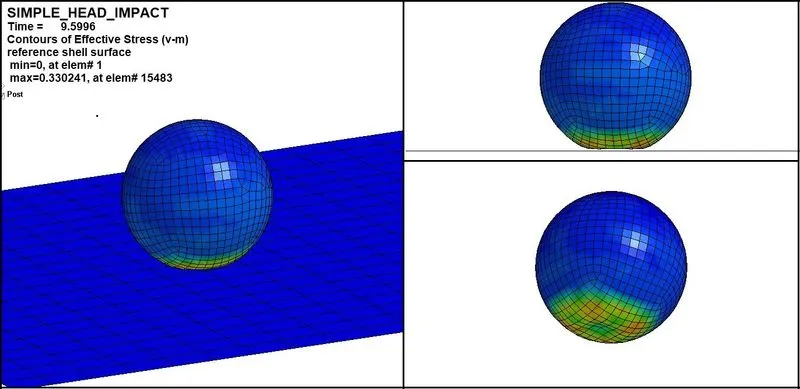
- Here we can see that maximum effective stress is generating due to impact is 330.241 Mpa.
Strain Contours:
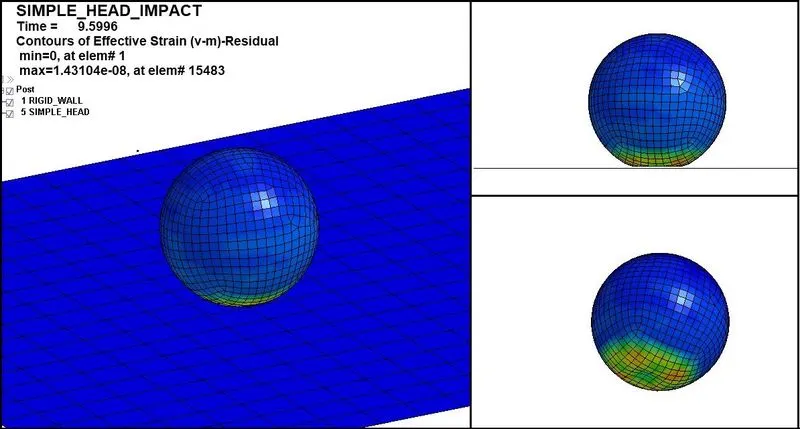
- Here we can see the permanent/ residual strain.
- Maximum residual strain due to plastic deformation is 1.43104 e-8.
Global Energies:
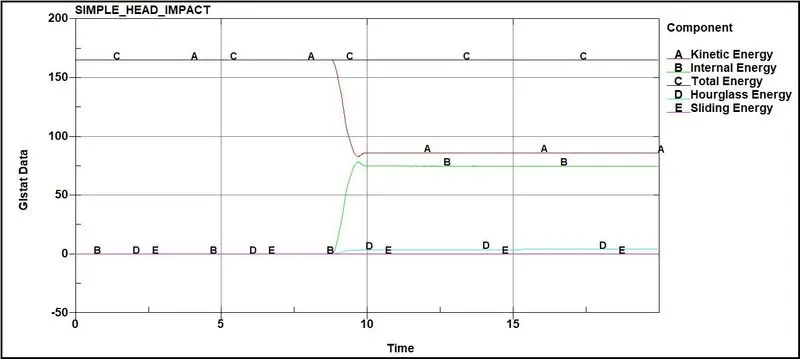
- Here we can observe decrease in kinetic energy due to impact and there is an increase in internal energy at the time of impact at 8.7 ms.
- Sliding energy is near to zero because here the rigid wall is not deformable.
- Also Hourglass energy is within the 10% of the internal energy, which is good.
Resultant Interface forces:
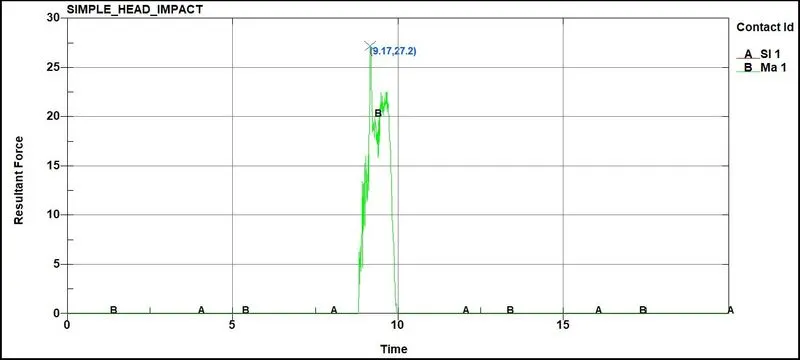
- Here the resultant force on the simple head is about 27.2 KN.
Nodal Accelerations:
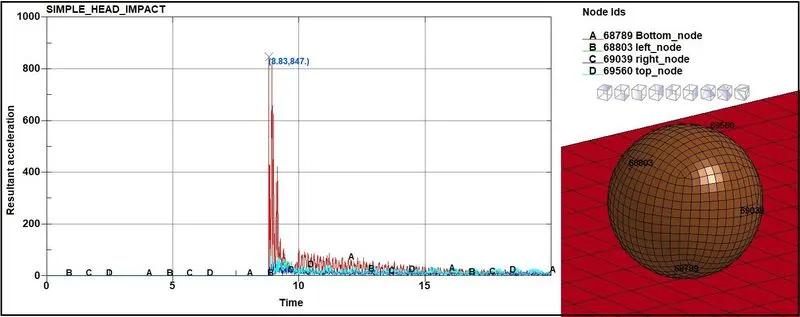
- Here we can see that the Bottom node 68789 has the maximum acceleration due to coming in contact with the wall, about 847 mm/ms2.
Section Forces:
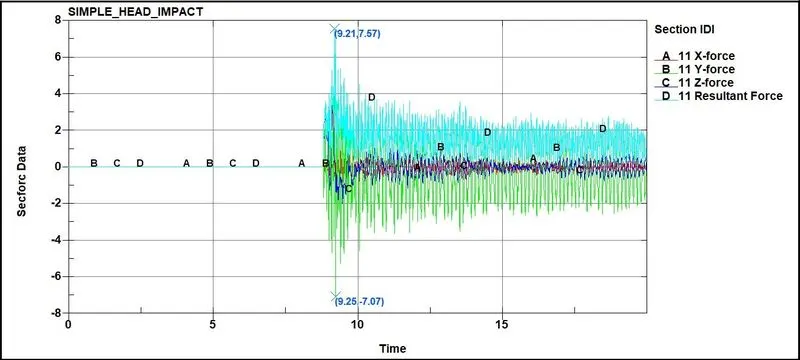
- Resultant Section force in the middle cross section is near about 7.57 KN.
_ _ _ _ ___ _ _ _ _ _ _ _ _ _ _ _ _ _ _ _ _ _ _ _ _ _ _ _ _ _ _ _ _ _ _ _ _ _ _ _ _ _ _ _ _ _ _ _ _ _ _ _ _ _ _ _ _ _ _ _ _ _ _ _ _ _ _ _ _ _ _ _ _ _
CASE_2:
Stress Contours:
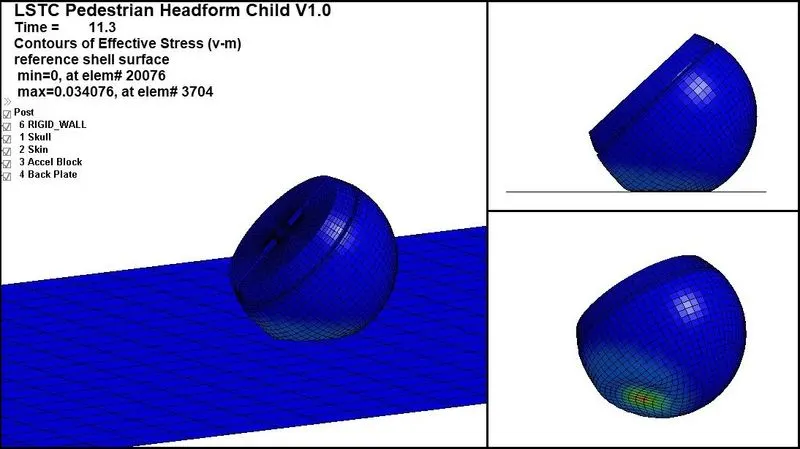
- Here we can see that maximum effective stress is generating due to Head impact is 34.076 Mpa.
Strain Contours:
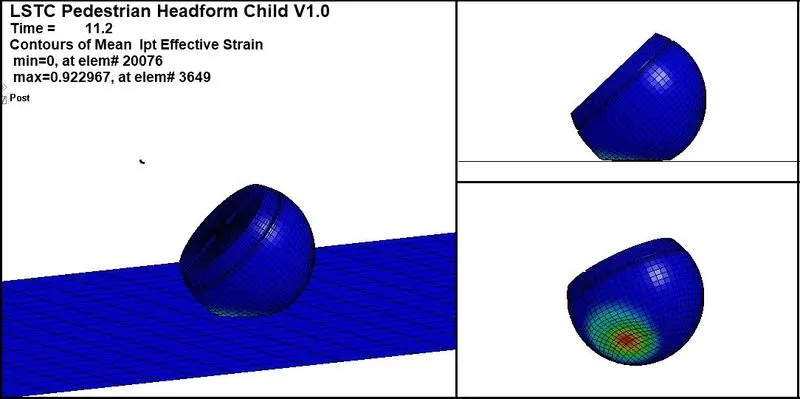
- Here we can see the considerable effective strain.
- Maximum residual strain due to plastic deformation is 0.922967 because of the hemming on the skin part of head.
Global Energies:
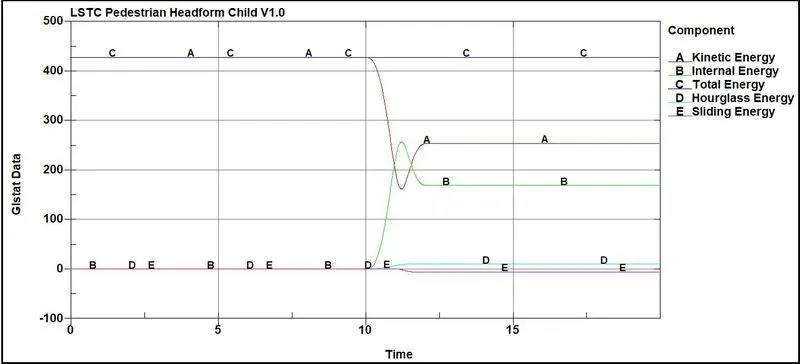
- Here we can observe decrease in kinetic energy due to impact and there is an increase in internal energy at the time of impact at 10 ms. we can see that after impact, kinetic energy increased again for some amount and becomes constant due to elasticity of the skin portion.
- We can see negative sliding energy due to forces acting between rigid and deformable portion on both the side of the skin of the head.
- Also Hourglass energy is within the 10% of the internal energy, which is good.
Resultant Interface forces: (Head to Wall)
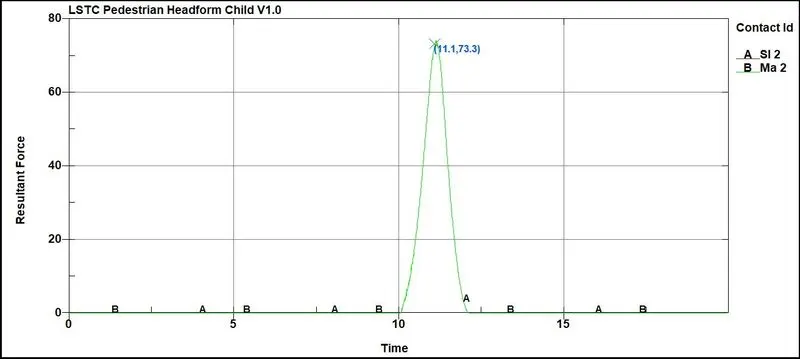
- Here the resultant interface force between head and the rigid wall is 73.3 KN.
Section Forces (Skin) :
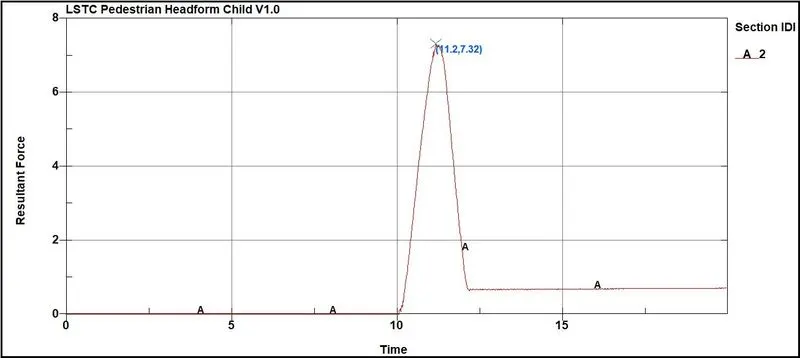
- Here the section forces on the skin are acting up to 7.32 KN.
- There are no section forces on the skin because the material is rigid.
Nodal Accelerations:
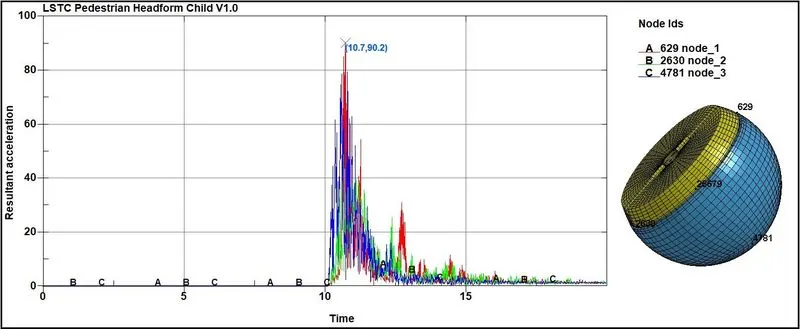
- Here we can see that the node 1: 629 has the maximum acceleration due to coming in contact with the wall and after impact due to rotation about 90.2 mm/ms2.
Head Impact Coefficient (HIC_36):
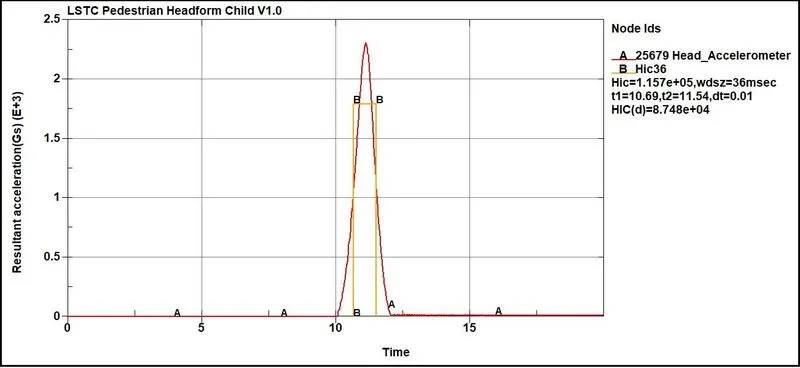
- With help of accelerometer, we can find the HIC plot as shown in above image.
- Above plot shows that the impact happens at 11.2 ms and the resultant acceleration of captured by the accelerometer is 2.31 mm/ms2.
- Also from the above plot we can see the HIC value is calculated in this case is HIC=1.157E+05 for the 36 ms time duration, which is the same for HIC 15.
Calculation for HIC:
HIC = (`alpha`αavg) 2.5 (t2 - t1)
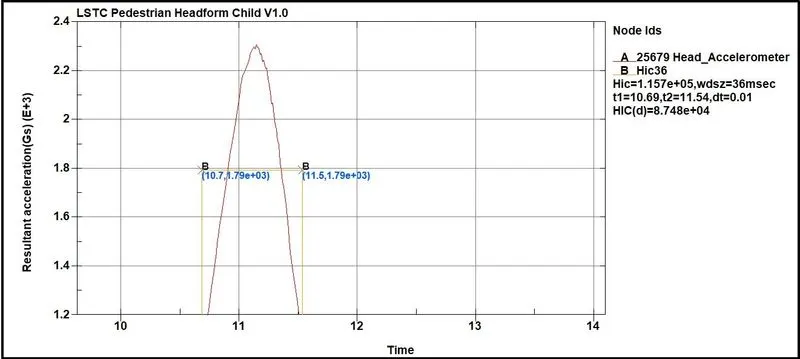
From above plot we can see that average acceleration is 1790 mm/ms2.
T2 = 11.5 ms
T1 = 10.7 ms
So, based on above values,
HIC = (1450)2.5 [(11.5 – 10.7)/1000]
HIC = (135,560,317.5339) [0.8/1000]
HIC = 108,448.2540264
HIC = 1.08E+05
- From above calculation, we can say that the values are matching or near same and so the result from the plot is correct.
_ _ _ _ ___ _ _ _ _ _ _ _ _ _ _ _ _ _ _ _ _ _ _ _ _ _ _ _ _ _ _ _ _ _ _ _ _ _ _ _ _ _ _ _ _ _ _ _ _ _ _ _ _ _ _ _ _ _ _ _ _ _ _ _ _ _ _ _ _ _ _ _ _ _
CASE_3:
Stress Contours:
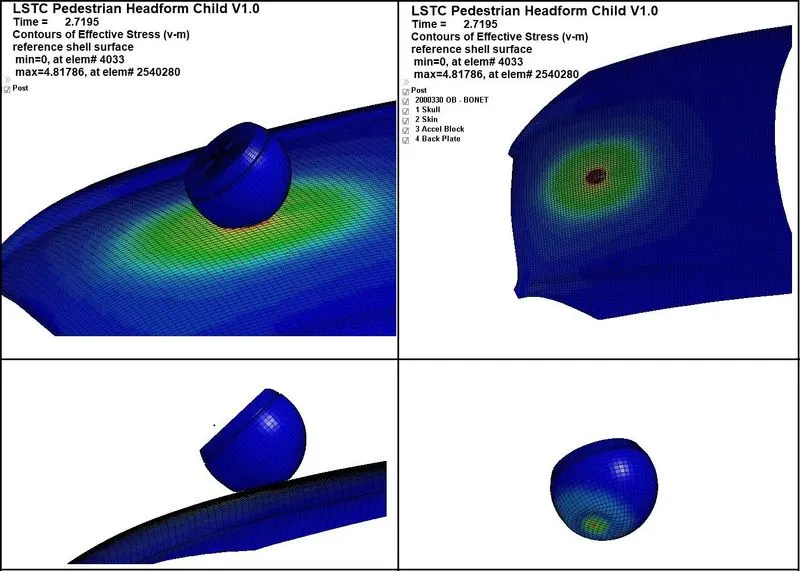
- Here we can see that maximum effective stress is generating due to Head impact is 4817.86 Mpa which is very high.
- This much stress can damage the head with plastic deformations.
Strain Contours:
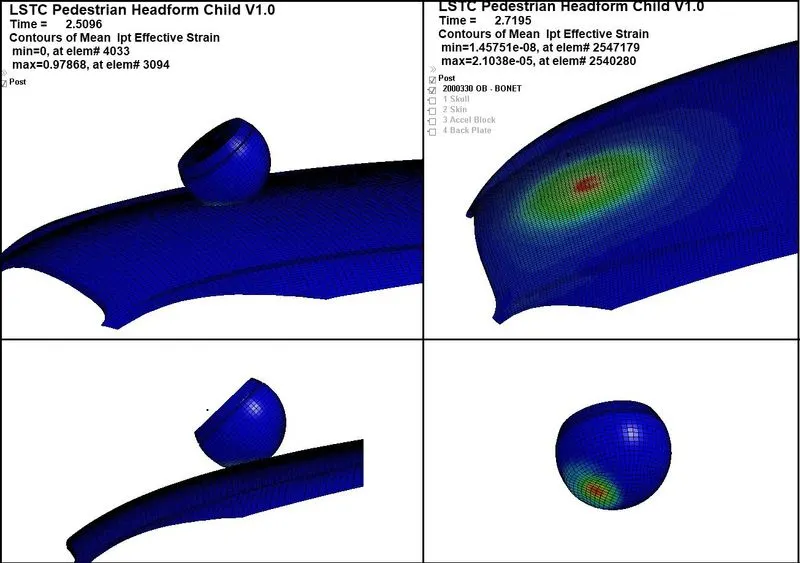
- Here we can see that the strain is also significant up to 0.97868.
- We can see that plastic strain failure of the head with 97 % of the strain.
Global Energies:
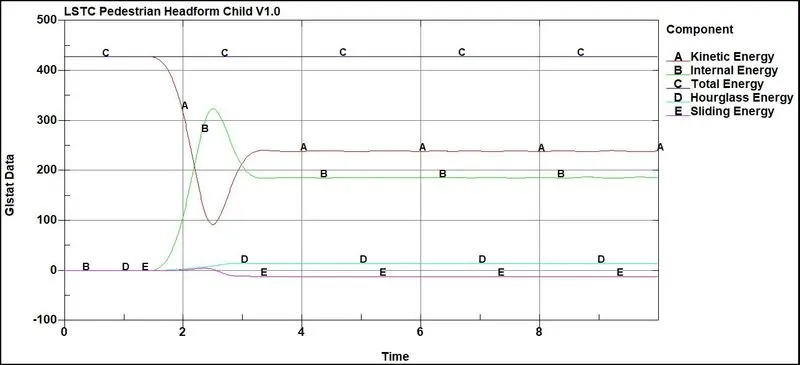
- Here we can observe decrease in kinetic energy due to impact and there is an increase in internal energy at the time of impact at 1.3 ms. we can see that after impact, kinetic energy increased again for some amount and becomes constant due to elasticity of the skin portion.
- We can see negative sliding energy due to forces acting between rigid and deformable portion on both the side of the skin of the head.
- Also Hourglass energy is within the 10% of the internal energy, which is good.
Resultant Interface forces: (Head to Wall):
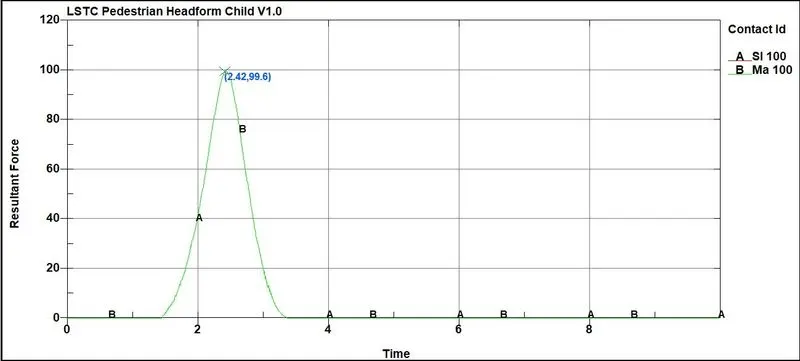
- Here the resultant interface force between head and the rigid wall is 99.6 KN.
Section Forces (Skin):
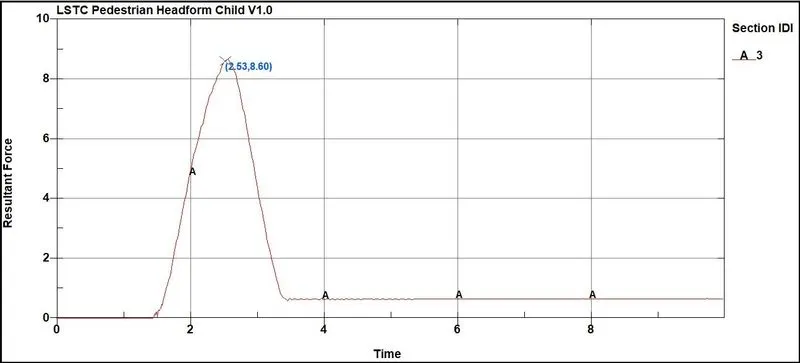
- Here the section forces on the skin are acting up to 8.6 KN.
Section Forces (Hood):
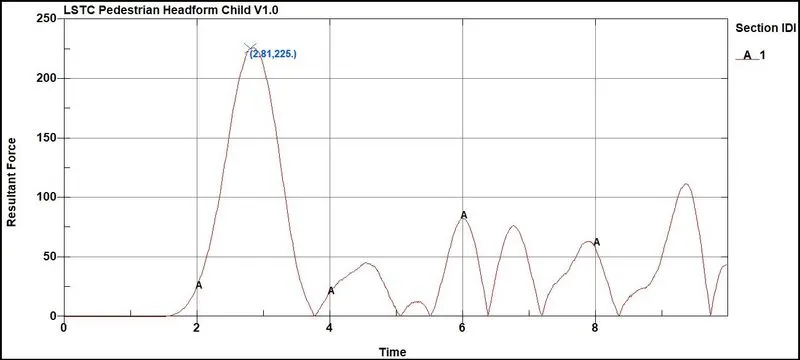
- Also the section forces on the hood are acting up to 225 KN.
- High section forces and fluctuations are due to elastic material of the hood.
Nodal Accelerations:
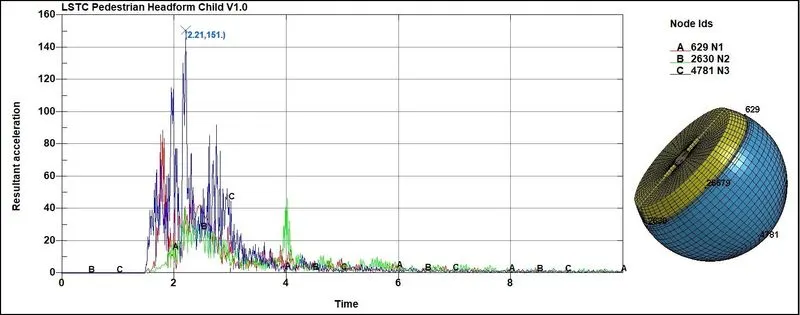
- Here we can see that the node N3: 4781 has the maximum acceleration due to coming in contact with the wall and after impact due to rotation about 151 mm/ms2.
Head Impact Coefficient (HIC_36):
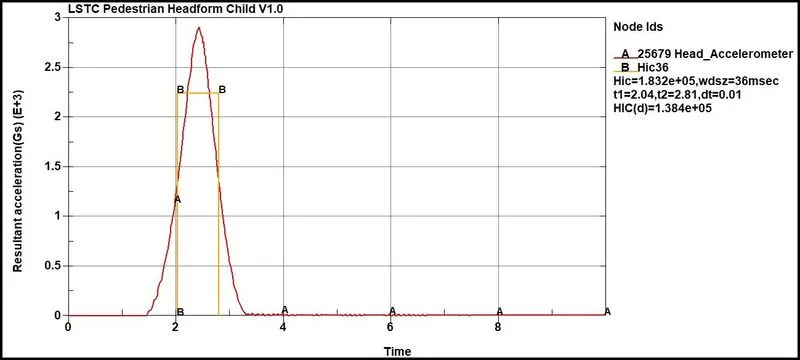
- With help of accelerometer, derived HIC plot is shown in above image.
- Above plot shows that the impact happens at near 2 ms and the resultant acceleration of captured by the accelerometer is 2.9 mm/ms2.
- Also from the above plot we can see the HIC value is calculated in this case is HIC=1.832E+05 for the 36 ms time duration, which is the same for HIC 15.
Calculation for HIC:
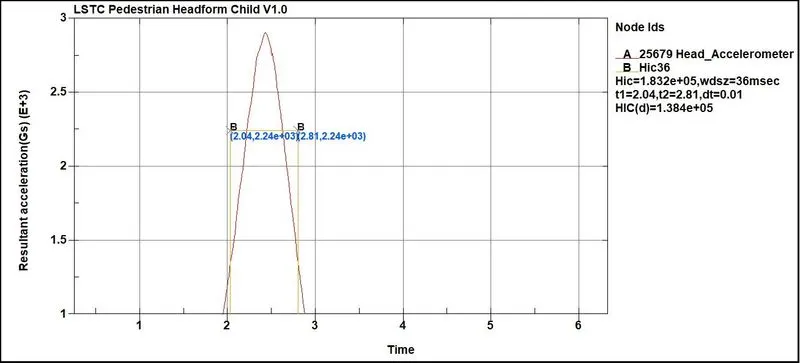
HIC = (`alpha`αavg) 2.5 *(t2 - t1)
From above plot we can see that average acceleration is 1790 mm/ms2.
T2 = 2.81 ms
T1 = 2.04 ms
So, based on above values,
HIC = (2240)2.5 [(2.81 – 2.04)/1000]
HIC = (237,476,175.3574450) [0.77/1000]
HIC = 182,856.6550
HIC = 1.829E+05
- From above calculation, we can say that the values are matching or near same and so the result from the plot is correct.
_____________________________________________________________________________________________________________________
Comparison of Stress-Strain plot (CASE_2 & CASE_3):
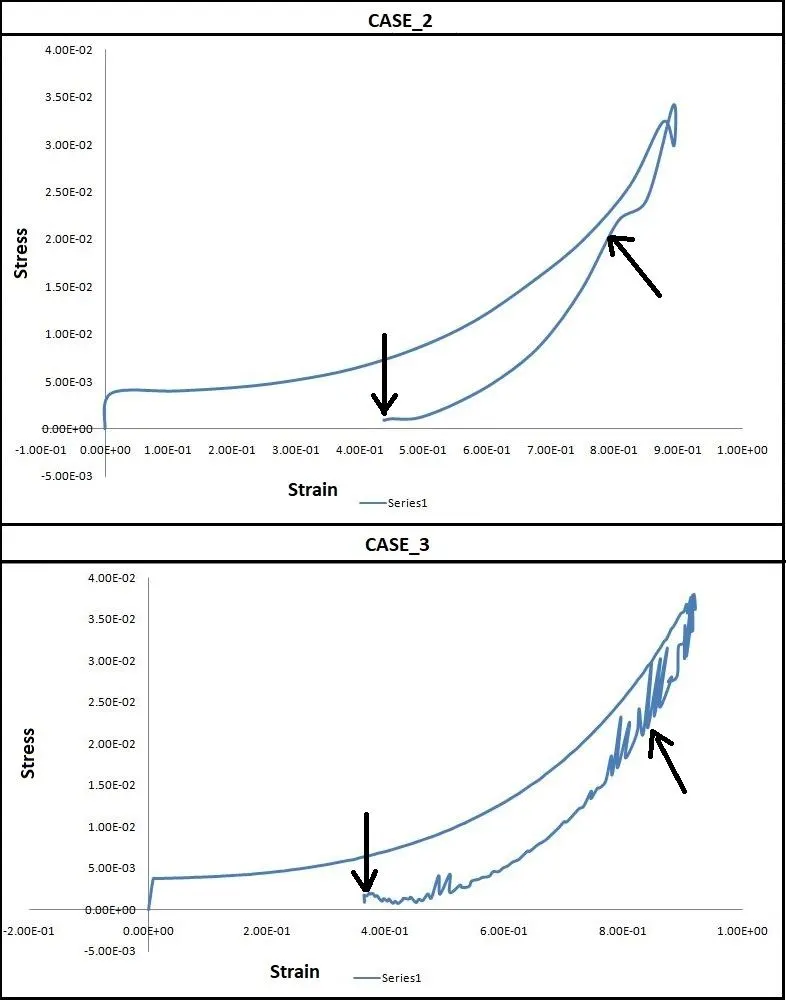
- From above Stress-Strain plot we can observe the behavior of the pedestrian head.
- Here we can see the behavior of the hyper elastic material of the skin of head.
- In both CASE_2 and CASE_3, we can see very small portion of the stress-stain linearity.
- Though both the plots are nearly same but we can see that curve in CASE_3 has more elastic behavior than curve in CASE_2.
- Above behavior is mainly due to difference in the impact body. Since in CASE_2, head is impacting with rigid wall and in CASE_3, head is impacting with hood.
- Here in CASE_3, Hood is made of elastic Carbon steel, so the curve of stress-strain is reversing little more in CASE_3 than CASE_2.
- Also curve in CASE_2 is smooth compared to CASE_3. Because in CASE_3, there are vibrations due to impact and so the there are some fluctuations in stress and strain.
Pedestrian throw tracking:
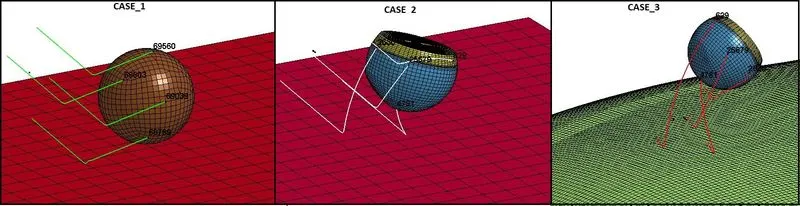
- In above image we can observe the pedestrian throw tracking through different nodes on the head.
- With this we can analyze the behavior of the head after impact.
- Also with the tracking of nodes, we can know the pedestrian throw distance which helps to find out the speed of the car in real case scenario.
_____________________________________________________________________________________________________________________
Results:
- In this way we can simulate the bonnet to head impact test. The result obtained are the approximate the same as tested in the real test.
- By using simulation we can save the time cost of the test.
- This study shows that the interdependence of the HIC value, the bonnet thickness, and the pedestrian head, which is very complicated.
- This study analyses and proposes a method of identifying the most effective values for the bonnet thickness, material of bonnet and the speed of the vehicle.
- The method presented in this study uses the regression technique to design constraints for the optimization problem. The proposed algorithm identifies numerous critical positions on the bonnet surface with respect to pedestrian safety.
- This work takes a look at pedestrian head impact mechanics and discusses possibilities in pedestrian protection.
- Had impact response is observed with different forces and stress-strain plots and HIC values calculated when risk to head injury was assessed.
- Thus by the pedestrian head impact analysis we can analyze the behavior of the pedestrian head and further can research for the vehicle speed and different materials for the bonnet with different impact angles.
- With this analysis we can estimate the level of the Head injury with HIC value obtained and improve the vehicles design with more safety towards the pedestrian.
_________________________________________________________________________________________________________
References:
- Head injury criterion - Wikipedia
- pdf (chalmers.se)
- Procedure To Obtain The Bonnet Thickness For Adult Pedestrian Head Safety (ijert.org)
- Procedure To Obtain The Bonnet Thickness For Adult Pedestrian Head Safety (academia.edu)
- Pedestrian head impact analysis (slideshare.net)
- (PDF) Head Injury Reduction in Automobile Pedestrian Impact (researchgate.net)
- Microsoft Word - 2 PEDESTRIAN HEAD IMPACT ANALYSIS (iaeme.com)
- DPPS-4-07e.pdf
_____________________________________________________________________________________________________________________
Animations:
Here the animations of the Stress and (Pedestrian Head or Head) Nodal form tracking are given as below:
CASE_1:
Stress:

Nodal (Head form) Tracking:
_ _ _ _ ___ _ _ _ _ _ _ _ _ _ _ _ _ _ _ _ _ _ _ _ _ _ _ _ _ _ _ _ _ _ _ _ _ _ _ _ _ _ _ _ _ _ _ _ _ _ _ _ _ _ _ _ _ _ _ _ _ _ _ _ _ _ _ _ _ _ _ _ _ _
CASE_2:
Stress:
Nodal (Head form) Tracking:
_ _ _ _ ___ _ _ _ _ _ _ _ _ _ _ _ _ _ _ _ _ _ _ _ _ _ _ _ _ _ _ _ _ _ _ _ _ _ _ _ _ _ _ _ _ _ _ _ _ _ _ _ _ _ _ _ _ _ _ _ _ _ _ _ _ _ _ _ _ _ _ _ _ _
CASE_3:
Stress:
Nodal (Head form) Tracking:
____________________________________________________________________________________________________________________
Thanks & Regards,
Dharmesh Joshi