Week 7 - CHT Analysis on a Graphics card
Conjugate Heat Transfer refers to the simultaneous analysis of heat transfer in solids (conduction) and fluids (convection). When performing a CHT analysis on a graphics card, the objective is to understand and predict how heat is transferred within the graphics card structure and between the graphics card and its surroundings. This is crucial for designing efficient cooling solutions to prevent the graphics card from overheating. CHT analysis helps engineers optimize the thermal performance of graphics cards, ensuring they operate within safe temperature limits and providing insights for designing effective cooling solutions.
Graphic card components:
1. Processor
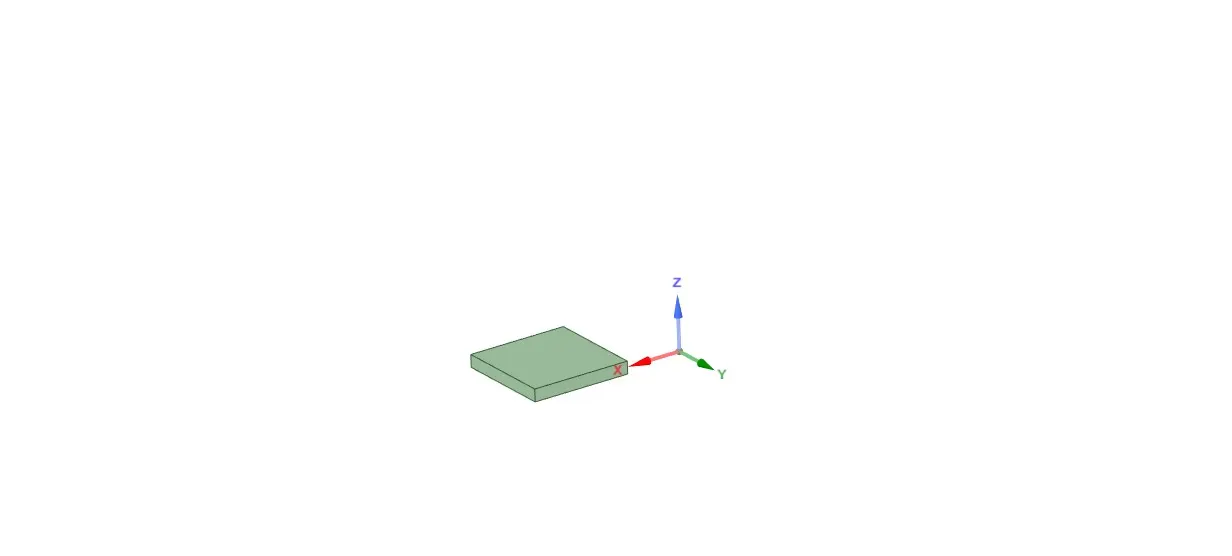
2. Fins
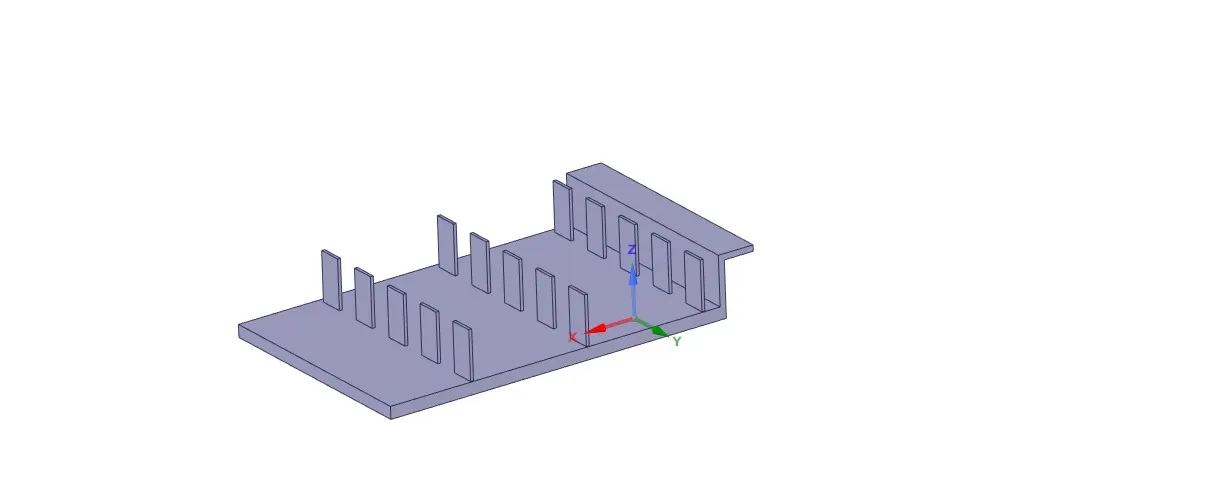
3. Base
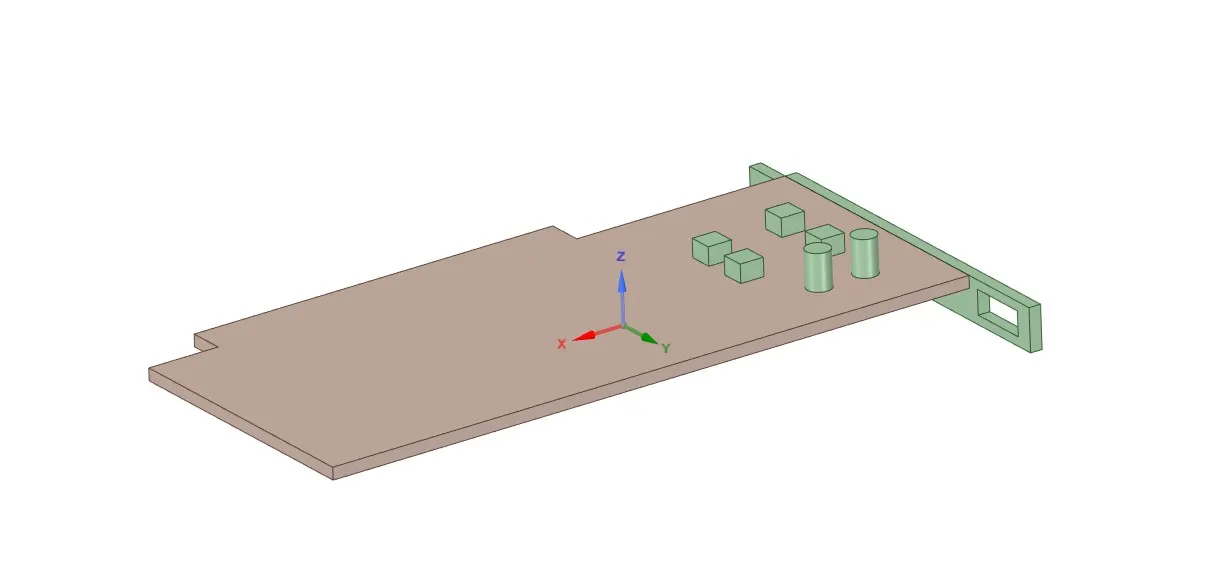
Geometry and Meshing:
The mesh should be fine enough to capture the thermal gradients and fluid flow features.
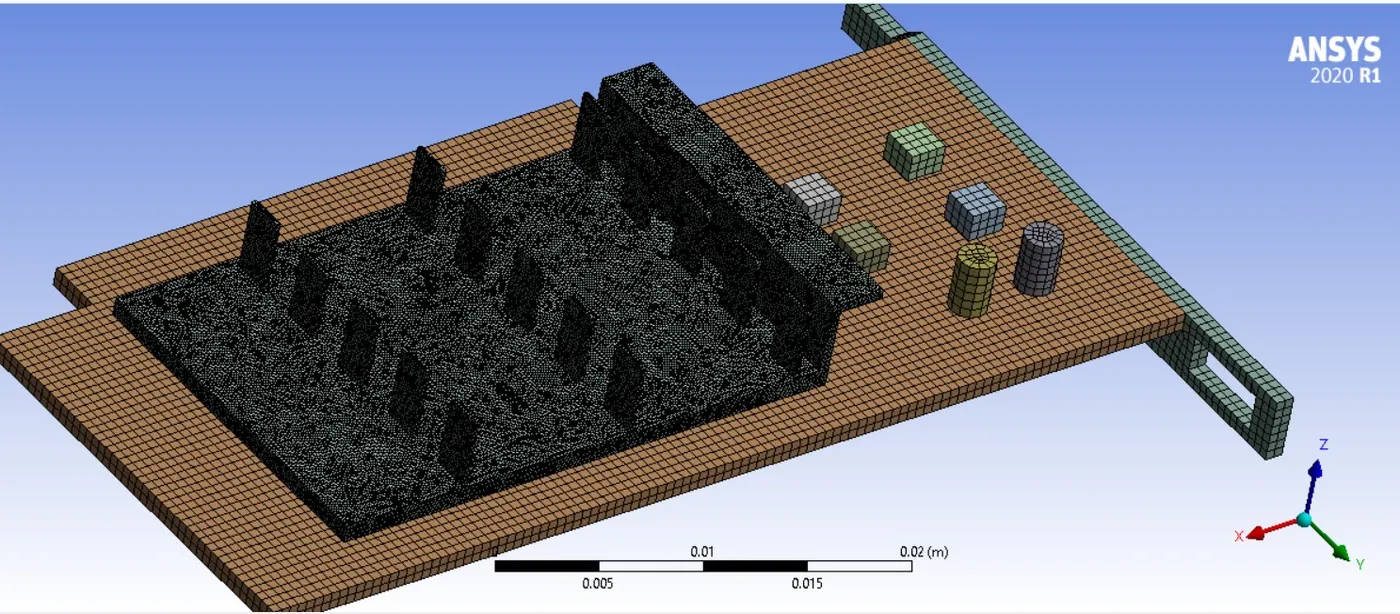
Quality criteria :
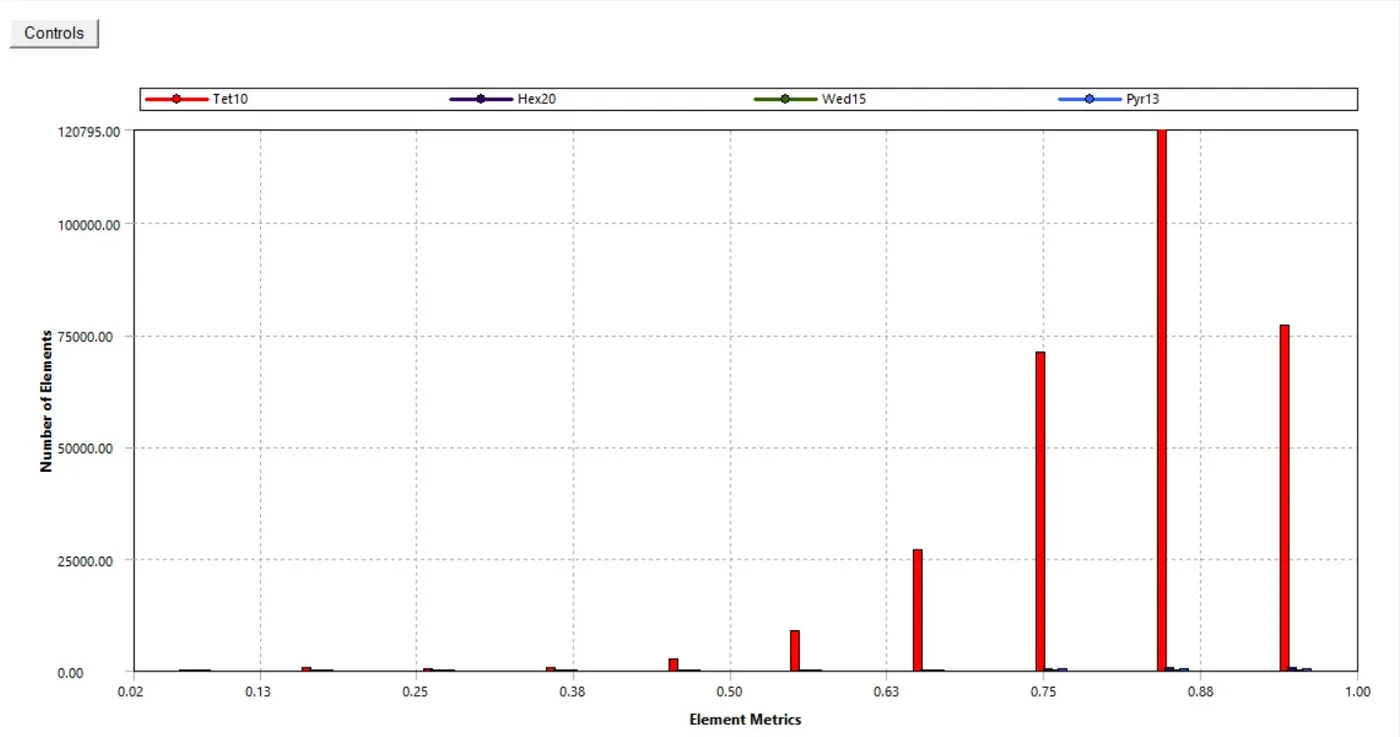
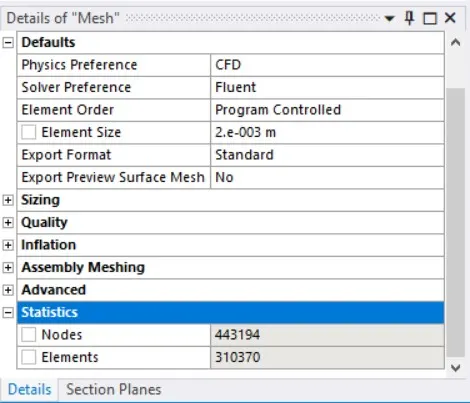
Mesh detials :
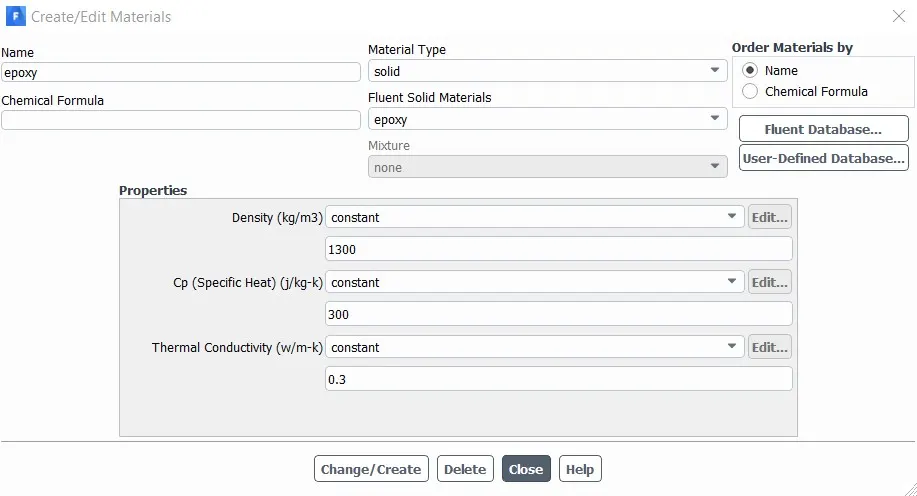
Materials
1. Base - Epoxy
2. Fins - Copper
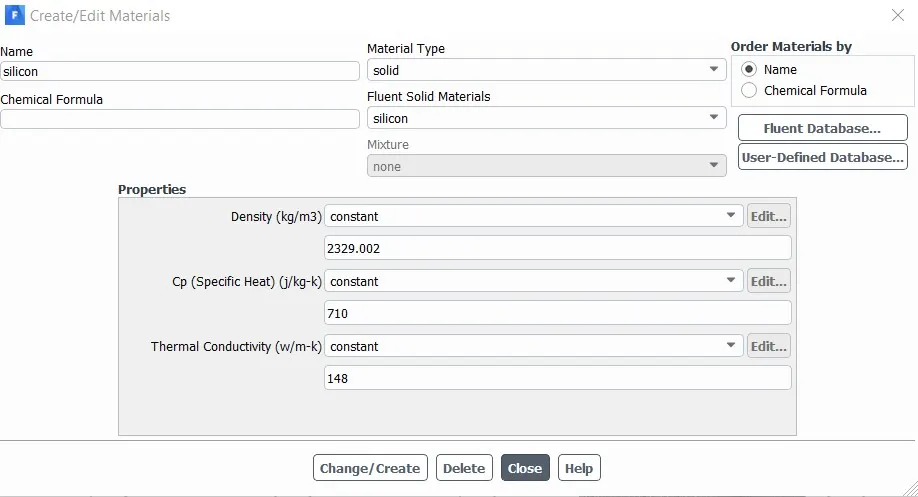
3. Processor - Silicon
Velocity conditions :
1. For 2.5 m/s
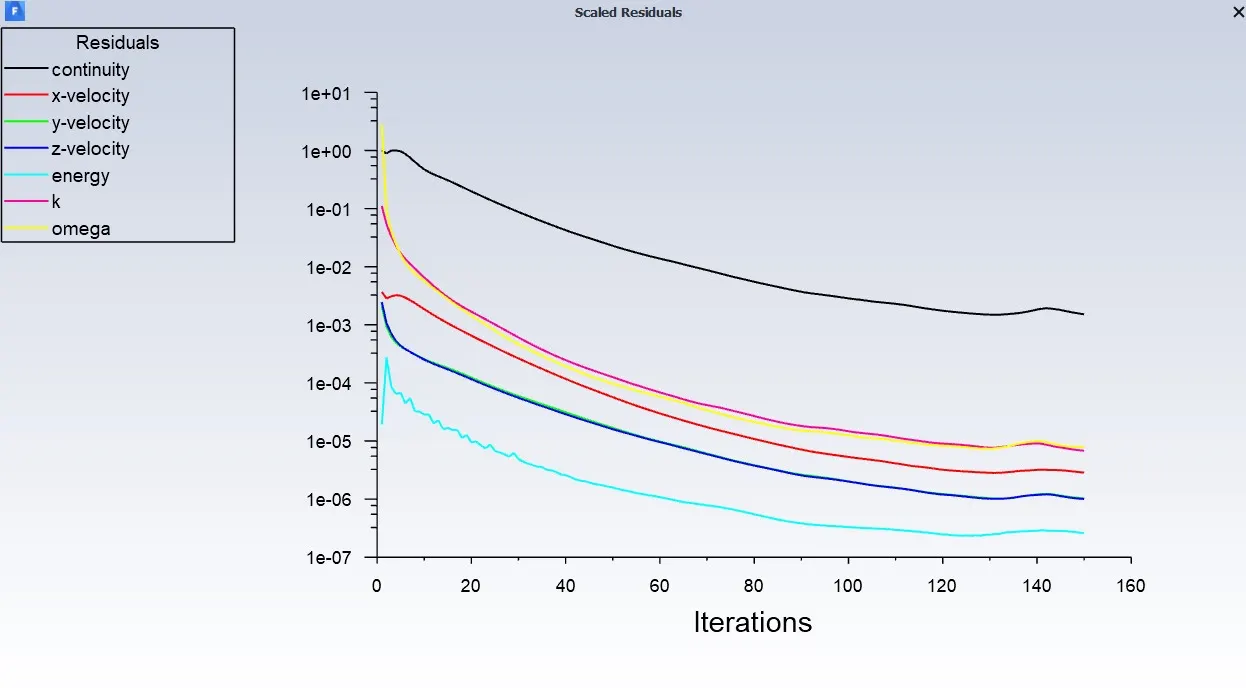
Residual plot
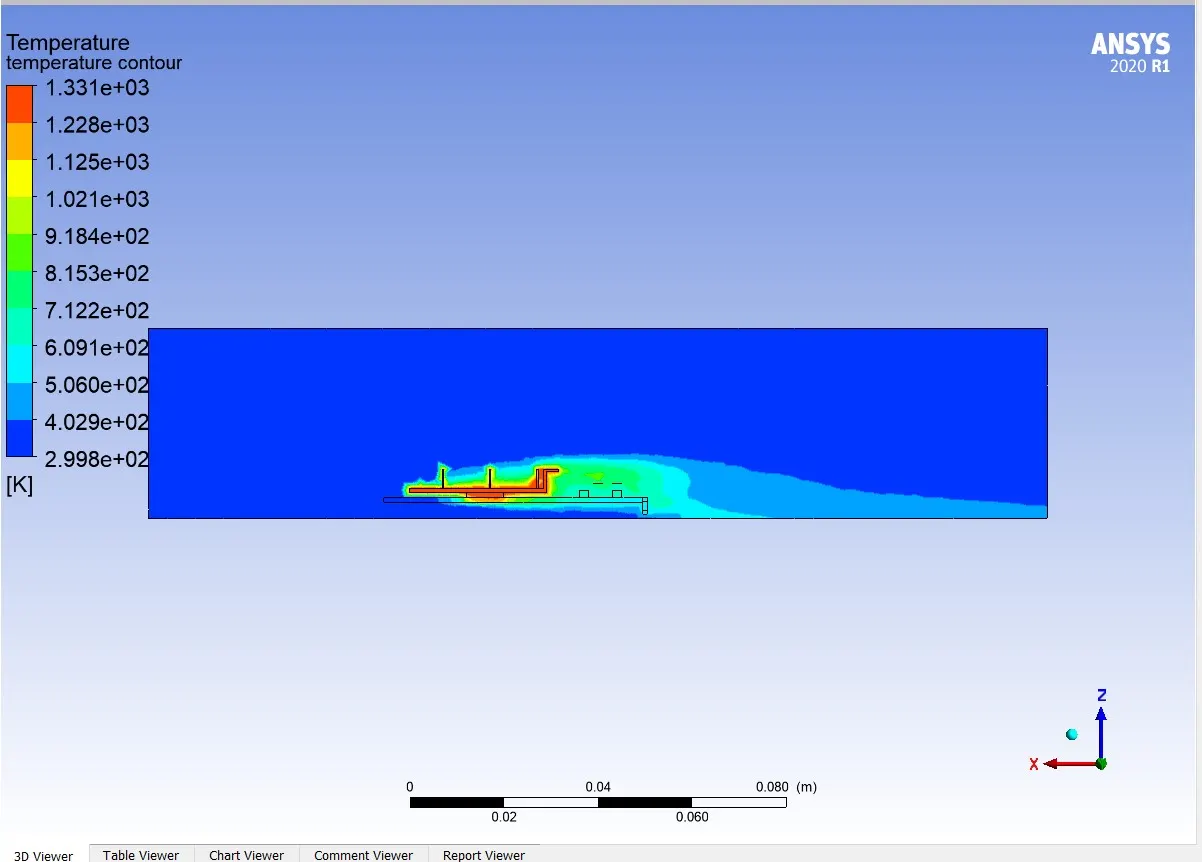
Temperature contour:
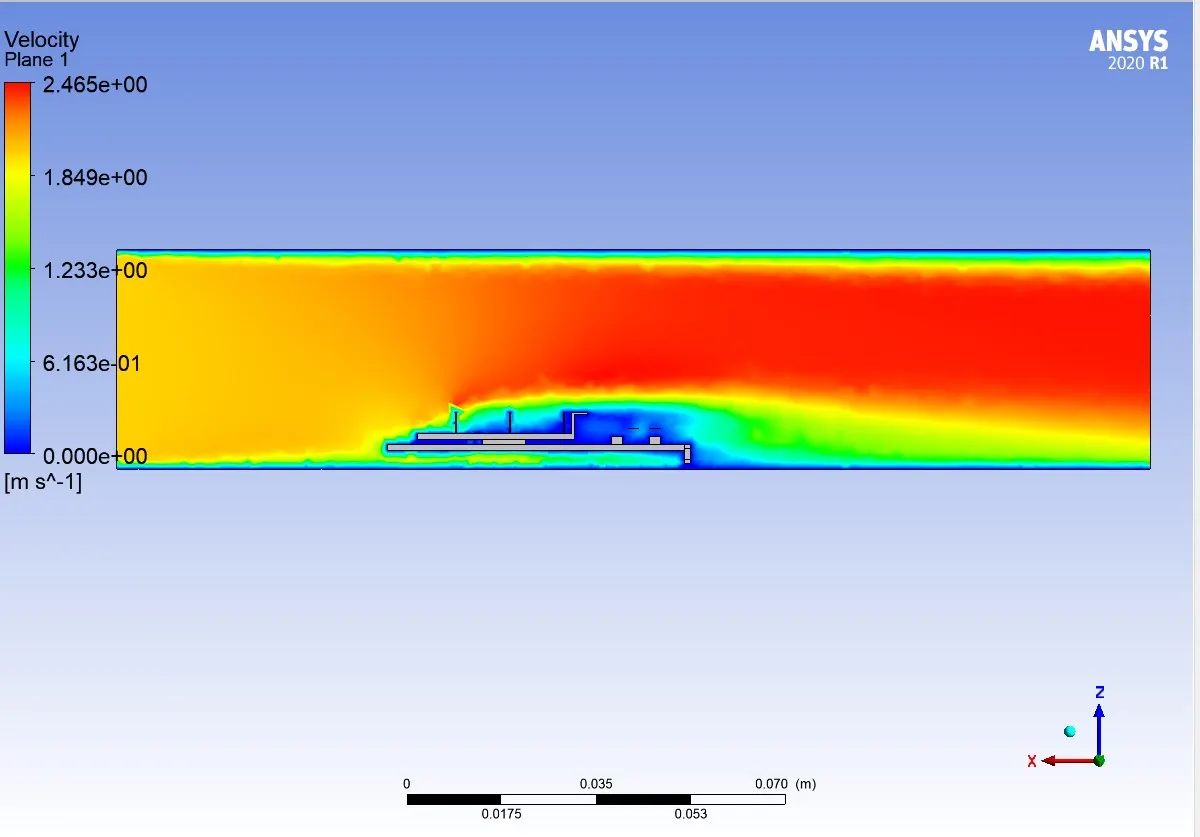
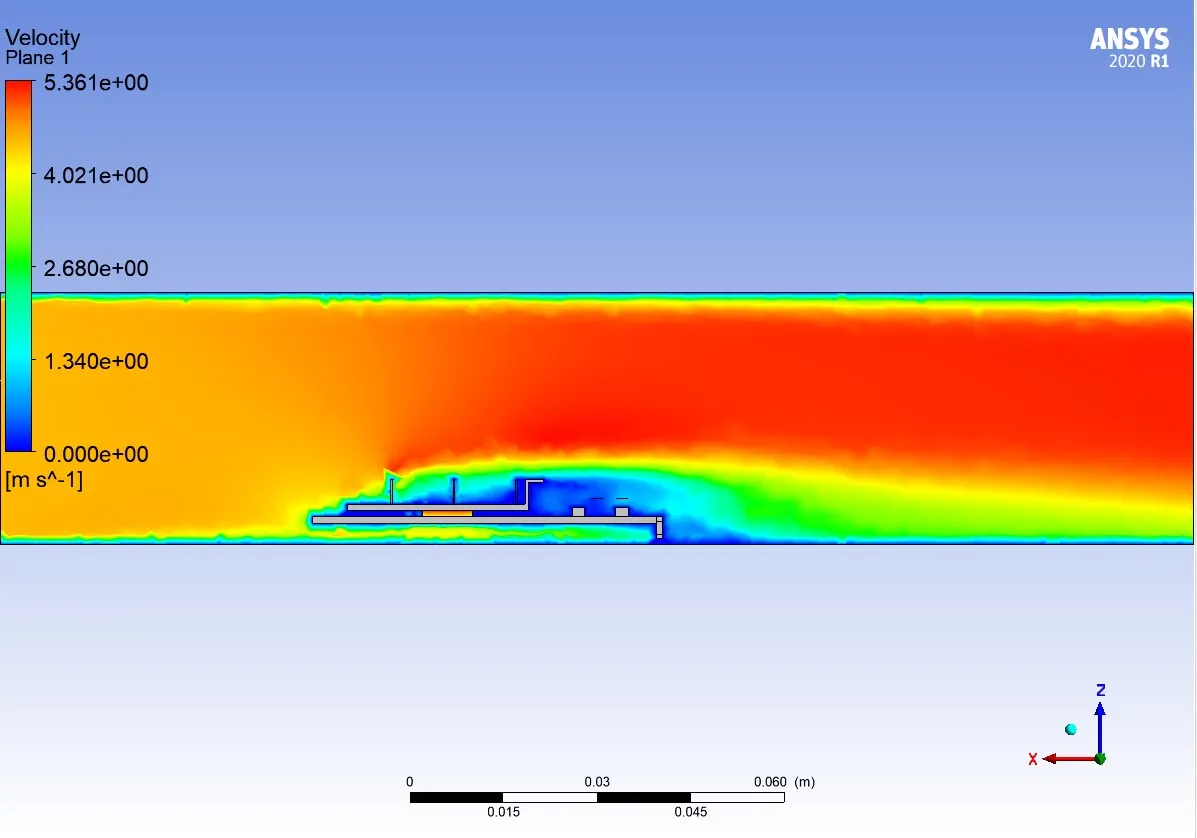
Velocity contour
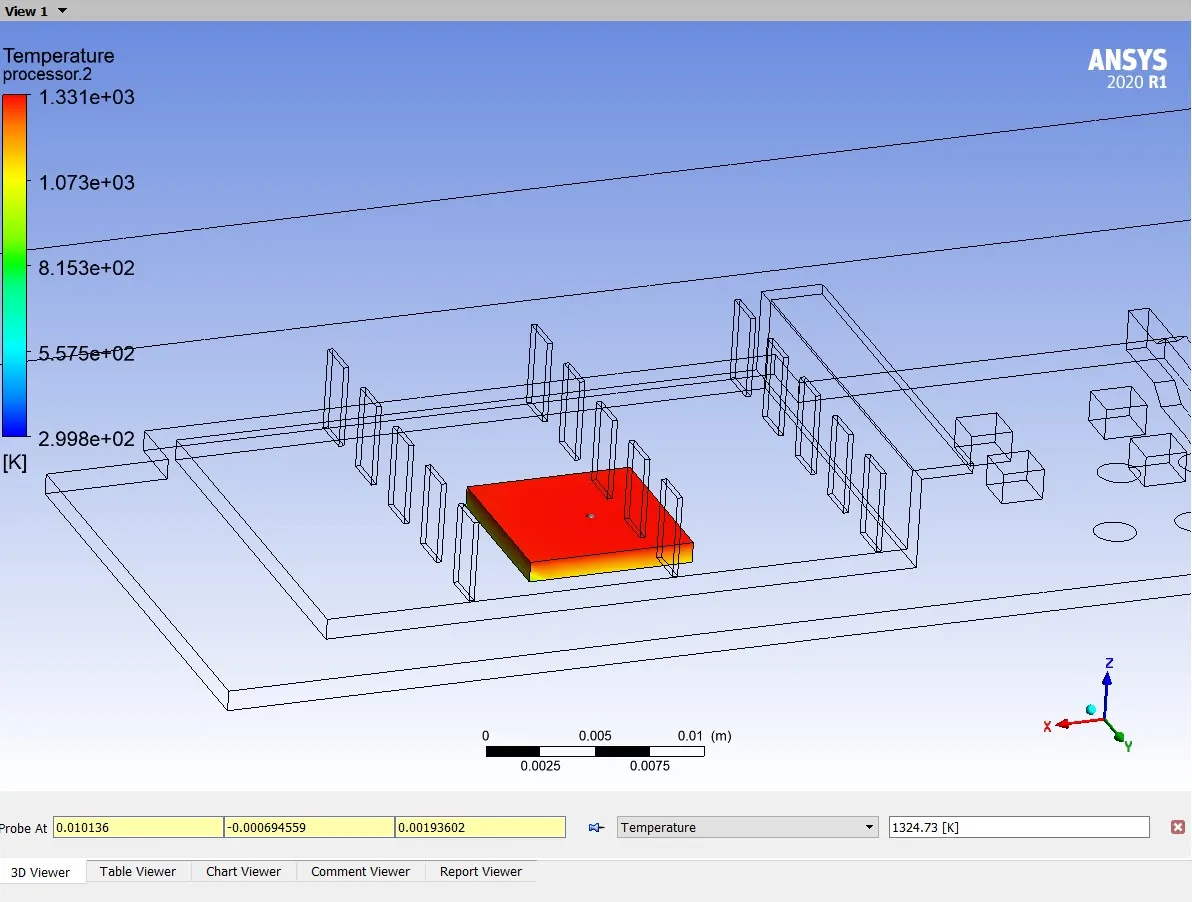
Hotspot ;
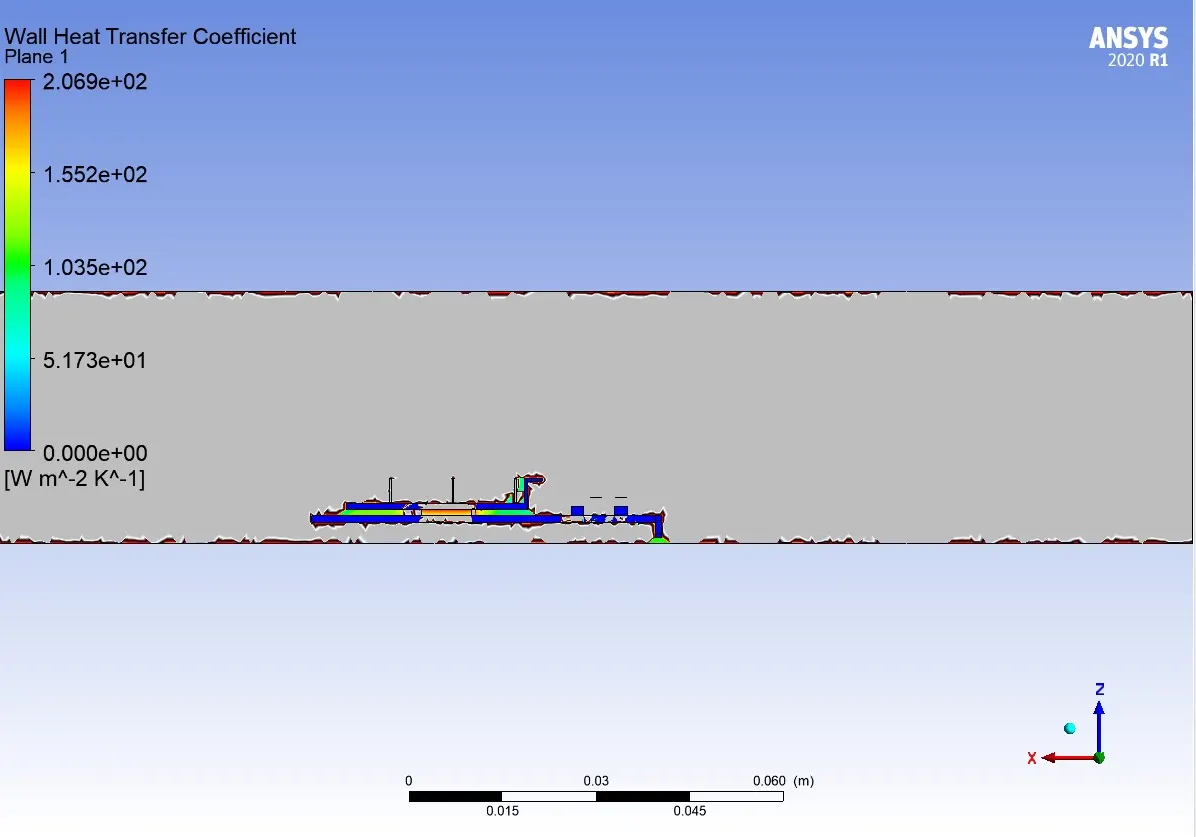
Wall heat transfer coefficient attained by processor:
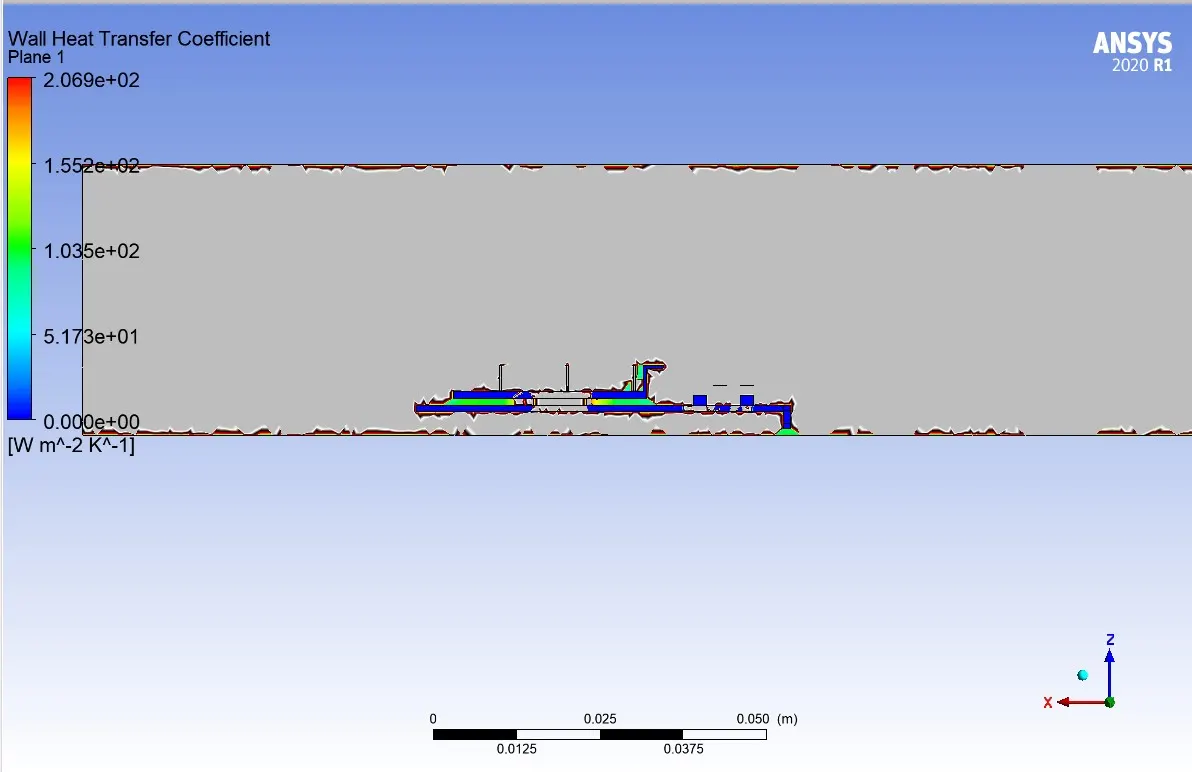
2. For 3.5 m/s
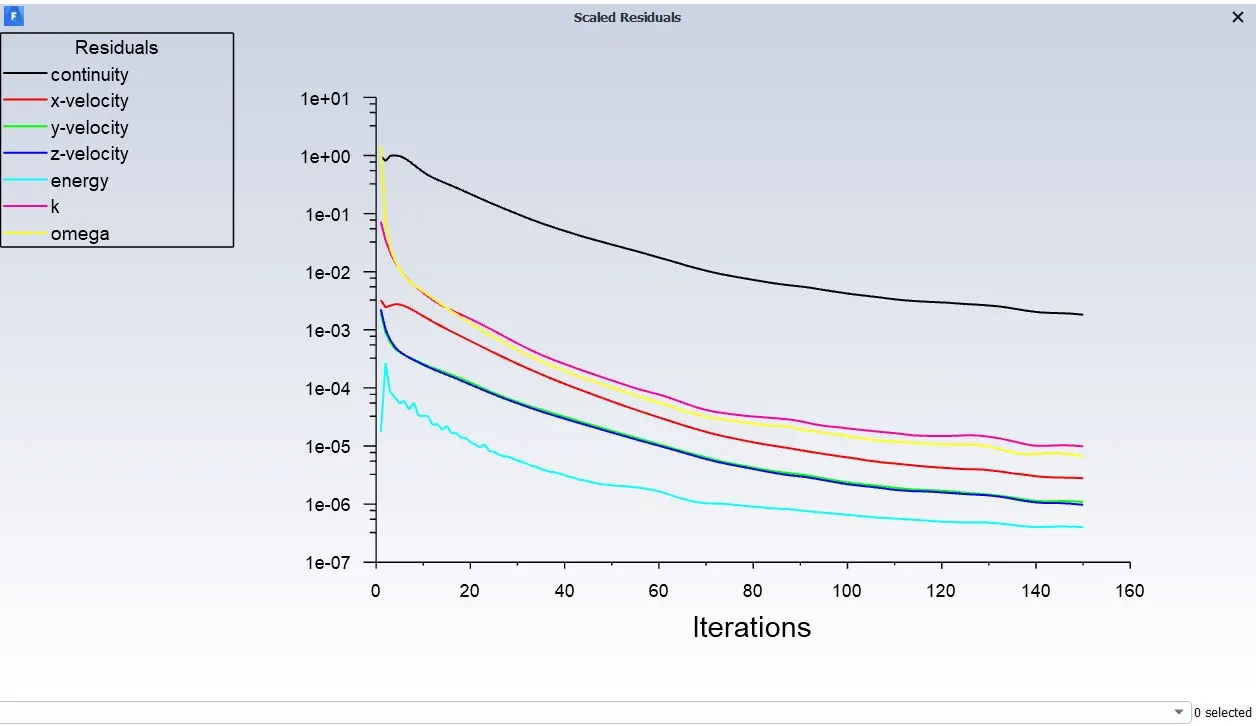
Residual Plot :
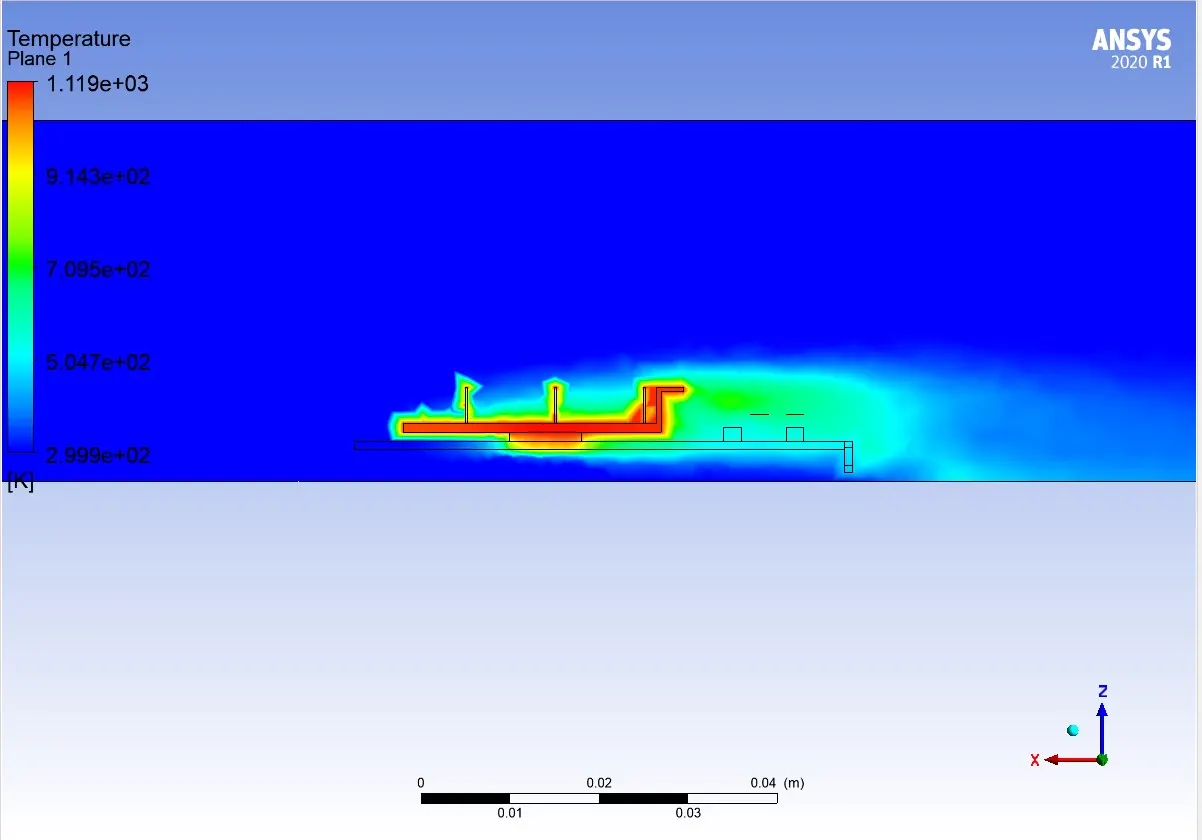
Temperature contour:
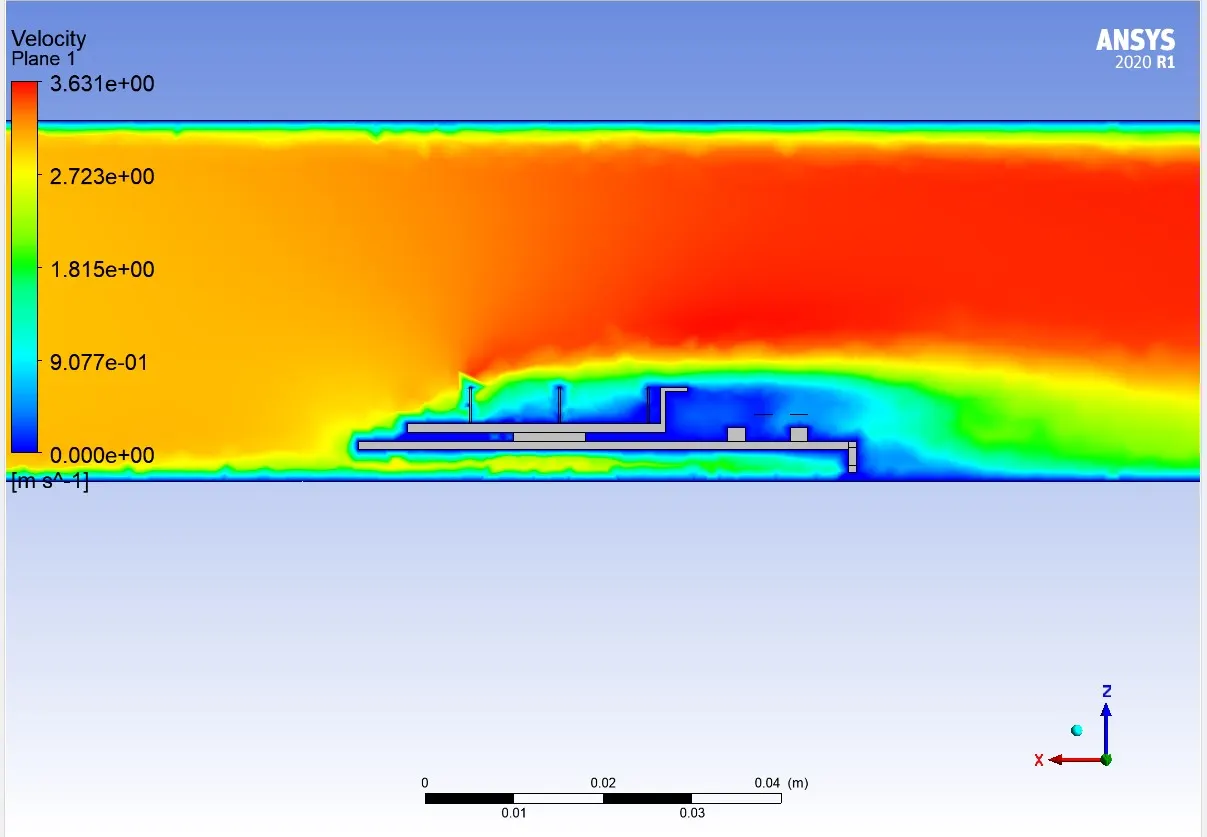
Velocity contour:
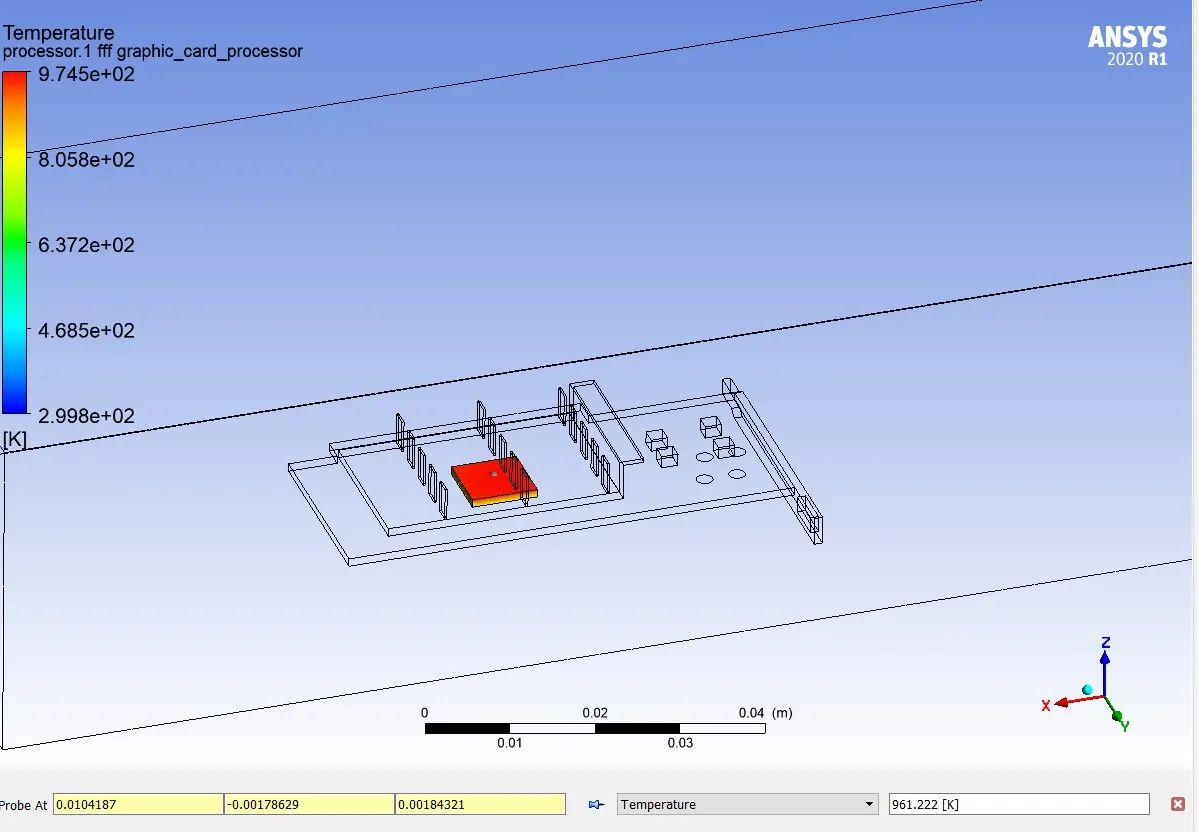
Hotspot:
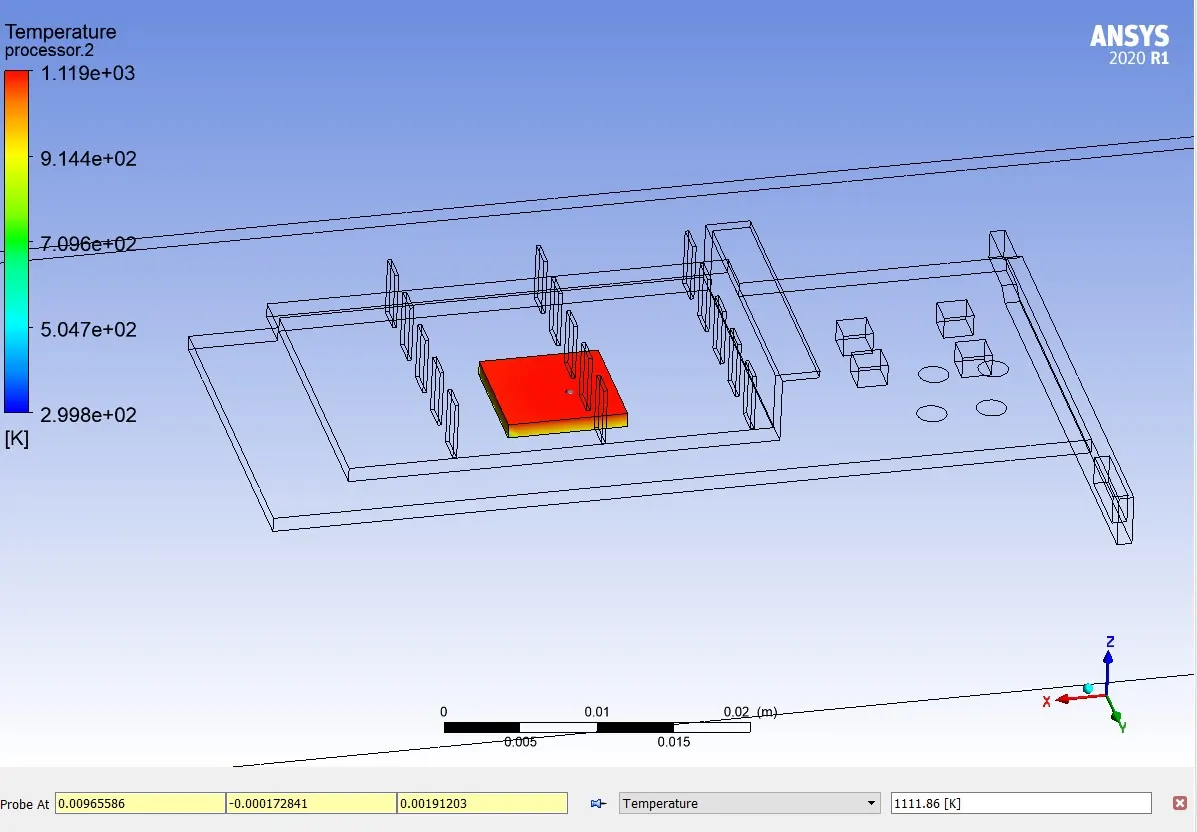
Wall heat transfer coefficient attained by processor:
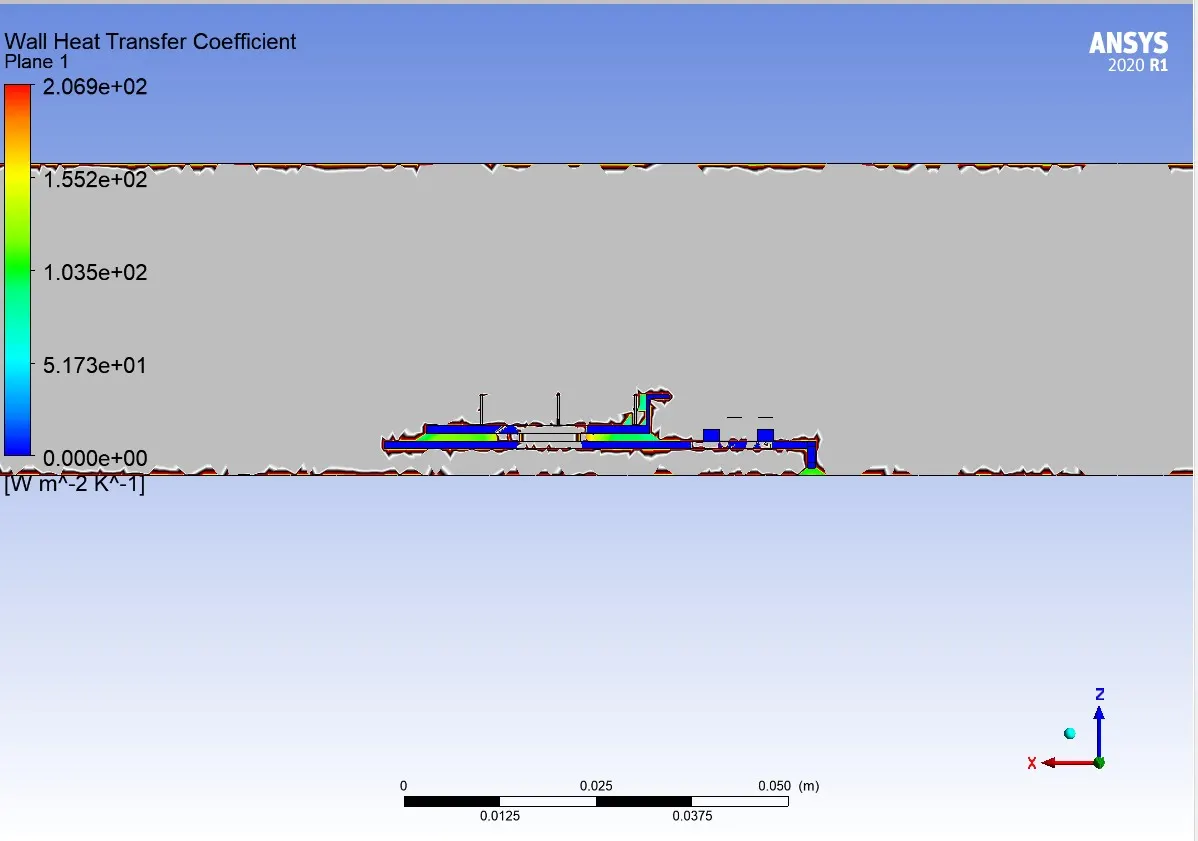
3. For 4.5 m/s
Residual Plot :
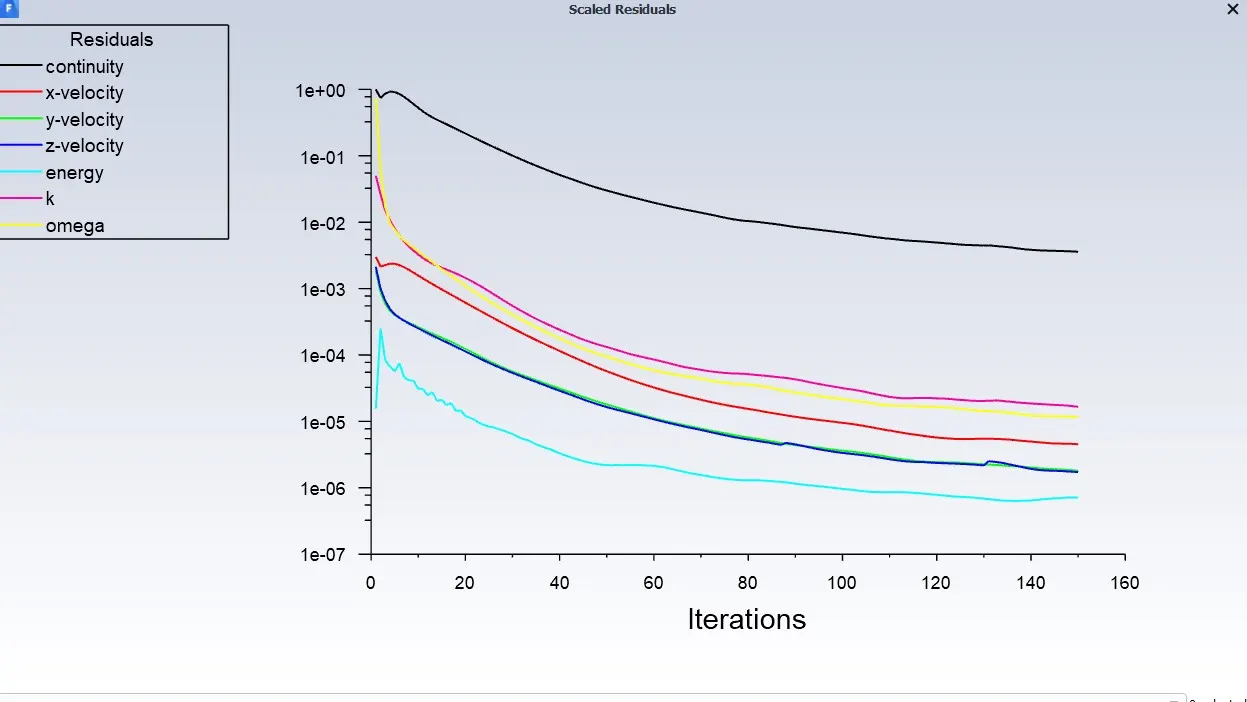
Temperature contour:
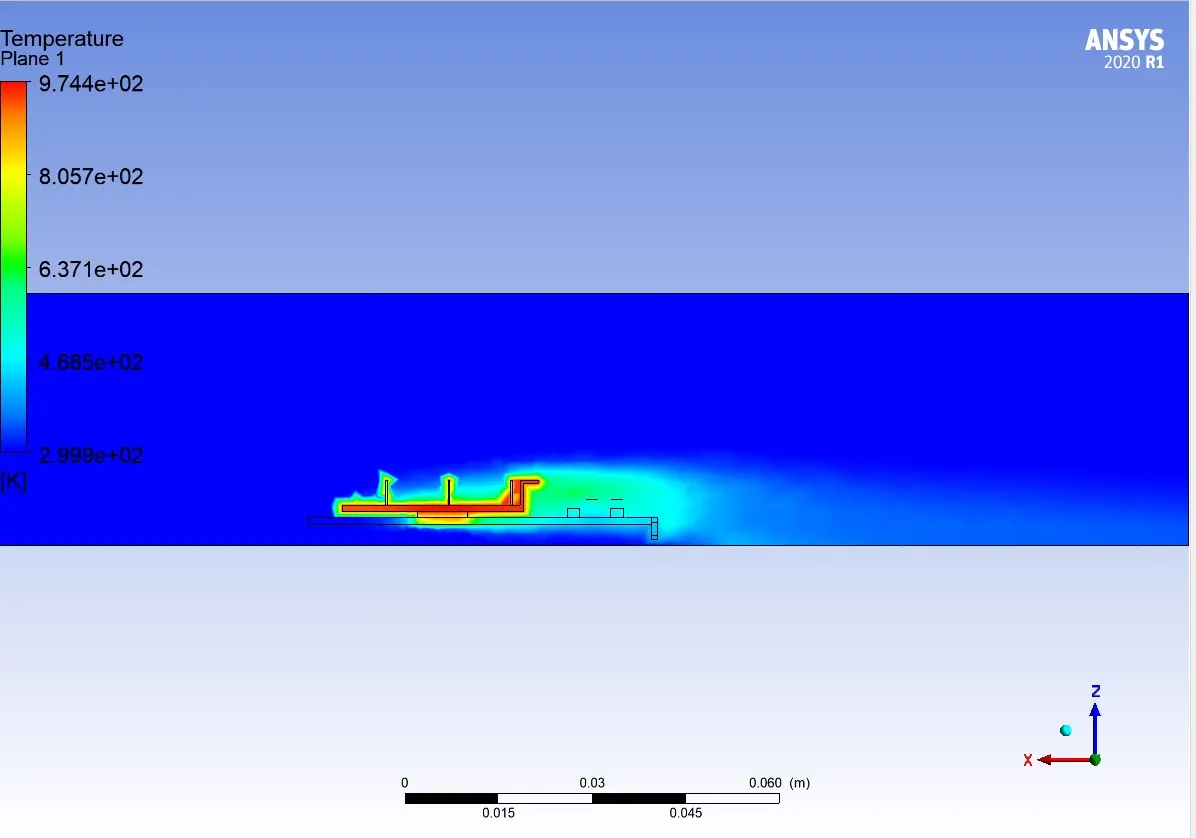
Velocity contour:
Hotspot:
Wall heat transfer coefficient attained by processor:
Results :
| Sr. No | Velocity of air (m/s) | Temperature (K) |
| 1 | 2.5 | 133.1 |
| 2 | 3.5 | 111.9 |
| 3 | 4.5 | 974.4 |
The simulation results indicate the effect of varying the velocity of the air around the graphics card on its temperature. The key observations are as follows:
1. Velocity and Temperature Relationship:
- As the velocity of the air increases, there is a noticeable decrease in the temperature of the graphics card.
- The observed trend suggests that higher airflow velocities contribute to more effective heat dissipation from the graphics card.
2. Optimal Cooling Range:
- The temperature reaches its lowest value at the highest tested velocity (4.5 m/s).
- This suggests that, within the range tested, higher air velocities result in better cooling performance for the graphics card.
3. Thermal Performance Analysis:
- At 2.5 m/s, the graphics card temperature is relatively high (133.1 K), indicating that the cooling may be less efficient at this lower airflow velocity.
- At 4.5 m/s, the temperature significantly decreases to 97.4 K, suggesting improved thermal performance and effective heat dissipation.