Analysis of auto ignition temperature and ignition delay using Cantera and Python
Aim:-> To observe the effect of initial temperature and pressure on ignition delay and ignition temperature using Python and Cantera.
Theory:-
Auto ignition temperature:
In the context of a combustible fuel mixture, the auto-ignition temperature is the lowest temperature at which the fuel will spontaneously ignite in a normal atmosphere without an external source of ignition such as a flame or spark. The autoignition temperature is not an intrinsic property of the gases or vapors but is the lowest temperature in a system where the rate of heat evolved from the gases or vapors increases beyond the rate of heat loss to the surroundings, resulting in the ignition.
This temperature is sometimes referred to as the igniting point of the fuel. Raising the temperature of a fuel to its auto-ignition point provides the energy required to initiate the chemical reaction needed for combustion. Auto ignition temperature is a useful parameter of fuel, as it states maximum safe level of operations involving that fuel. Auto Ignition temperature can be affected by the pressure, vessel shape and volume, contaminants, surface activity, reaction rate, gravity, etc. We know that for methane fuel the auto ignition temperature is more than 820k.
Ignition delay:
It is the period between the beginning of fuel injection into an engine cylinder and the start of combustion inside combustion chamber. While Auto ignition delay refers to the time taken to auto-ignite the fuel. Ignition delay times vary by orders of magnitude from one fuel molecule to another. The temperature must be changed by hundreds to obtain identical ignition delays in different systems.
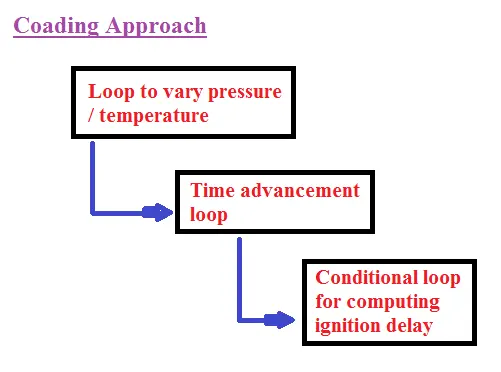
For current problem auto ignition delay is calculated as,
`Time_("Ignition delay")=Time_("Initial temperature")+400k`
Reactor and reactor network:
A Cantera reactor is the simplest form of chemical reacting system to generate. It relates to an extensive thermodynamic control volume, in which all state variables are homogeneously distributed. Here all states are function of time i.e. transient system. The reactor defines the governing equations to be solved. In addition to single reactors, Cantera is also owns facility to interconnect reactors into a Reactor Network. Each reactor in a network may be connected so that the contents of one reactor flow into another. Even for a single reactor a reactor network is required.
Cantera provides an ODE solver for solving the stiff equations of reacting systems. If Cantera is installed with SUNDIALS (the default), the optimized solver from SUNDIALS is used. Starting off the current state of the system it can be advanced (integrate) in a time using function like ‘advance’.
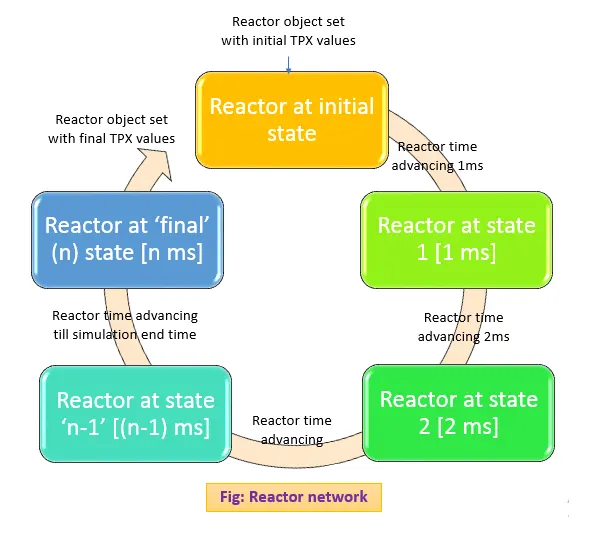 |
The use of the advance method in a loop has the advantage that it produces results corresponding to a predefined time series. These are associated with a predefined memory consumption and well comparable between simulation runs with different parameters.
 |
~CASE 1.1:
Python code to observe effect of initial pressure:-
'''
Program to observe effect of variable pressure on ignition delay

Chemical reaction
CH4 + 2(O2 + 3.76 N2) <-> CO2 + 2H2O + 7.52N2
'''

# Importing libraries
import sys
import numpy as np
import matplotlib.pyplot as plt
import cantera as ct

# Initial pressure
pressure = np.linspace(1,5,5)

# Initial temperature in kelvin
T = 1250

# Species dictionary (Reactant side)
species_dict = {'CH4':1, 'O2':2, 'N2':7.52}

# Total time to run simulation
simulation_time = 10 #seconds
step_time = 1e-3 #seconds i.e. milisecond
# Calculating number of time steps (i.e. number of steps)
time_steps = int(simulation_time/step_time)

# Array for auto ignition delay
Auto_ig_time = []

# Loop for varying values of pressure
for i in pressure:

	# Creating gas object
	gas = ct.Solution('gri30.xml')

	# Converting pressure from atm to Pa
	P = i * 101325

	# Providing initial conditions to gas object
	gas.TPX = T, P, species_dict

	# Reactor
	r = ct.IdealGasReactor(gas)

	# Reactor network
	sim = ct.ReactorNet([r])

	# Initial time
	time = 0

	# Prepearing solution array for each state
	states = ct.SolutionArray(gas, extra = ['time_ms'])

	loop_counter = 0

	# Time loop (Time integration for states)
	for n in range(time_steps):
		time += step_time

		# Advancing time
		sim.advance(time)
		states.append(r.thermo.state, time_ms = time/step_time)

		# Loop to calculate ignition delay
		# Time required to ignition delay = Time for acheiving_(initial temprature + 400k)
		if ((states.T[n] >= (T + 400)) and loop_counter == 0):

			Auto_ig_time.append(states.time_ms[n])

			loop_counter = 1

	# Plotting
	plt.figure(1)
	plt.plot(states.time_ms, states.T)
	plt.legend(['Pressure = ' + str(int(i)) + ' atm' for i in pressure])

plt.figure(1)
plt.grid('on')
plt.xlabel('Time in mili-seconds')
plt.ylabel('Auto ignition temperature in K')
plt.title('Variation in Auto-ignition temperature for variable initial pressure')

plt.figure(2)
plt.plot(pressure, Auto_ig_time,'-o',color='purple')
plt.grid('on')
plt.xlabel('Pressure in atm')
plt.ylabel('Ignition delay in mili-seconds')
plt.title('Ignition delay for variable initial pressure')

plt.show()
Output plot for above program:-
 |
|
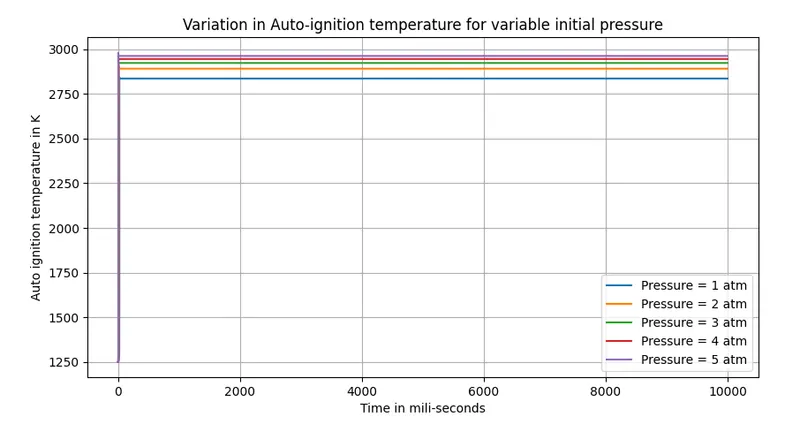
Fig: Auto ignition temperature for various inlet pressure |
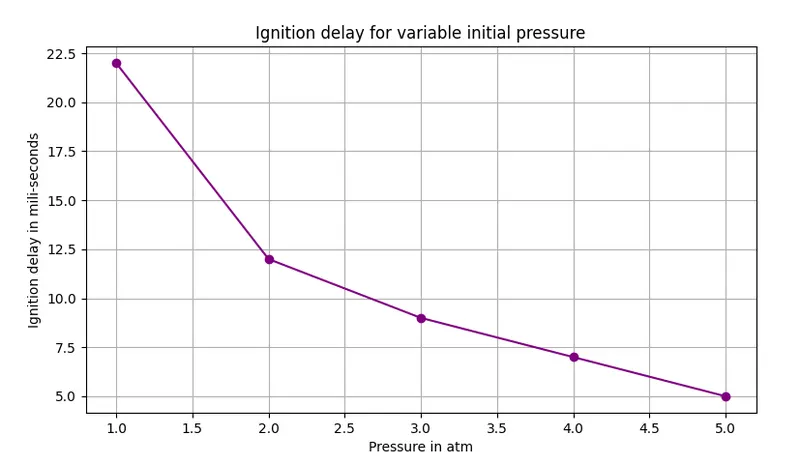 |
| Fig: Variation in ignition delay w.r.t. initial pressure |
Ignition delay value obtained for various initial pressure:-
| Pressure (atm) | 1 | 2 | 3 | 4 | 5 |
| Ignition delay in (ms) | 22.0 | 12.0 | 9.0 | 7.0 | 5.0 |
~CASE 1.2:
Python code to observe effect of initial temperature:-
'''
Program to observe effect of variable temperature on ignition delay

Chemical reaction
CH4 + 2(O2 + 3.76 N2) <-> CO2 + 2H2O + 7.52N2
'''

# Importing libraries
import sys
import numpy as np
import matplotlib.pyplot as plt
import cantera as ct

# Initial temperature in K
temp = np.linspace(950,1450,5)

# Initial pressure in Pa
P = 5*101325

# Reactant species dictionary
species_dict = {'CH4':1, 'O2':2, 'N2':7.52}

# Total time to run simulation
simulation_time = 10 #seconds
step_time = 1e-3 #seconds i.e. milisecond
# Calculating number of timesteps
time_steps = int(simulation_time/step_time)

# Array for auto ignition delay
Auto_ig_time = []

# Loop for varying values of initial temperature
for T in temp:

	# Creating gas object
	gas = ct.Solution('gri30.xml')

	# Providing initial conditions to gas object
	gas.TPX = T, P, species_dict

	# Reactor
	r = ct.IdealGasReactor(gas)

	# Reactor network
	sim = ct.ReactorNet([r])

	# Initial time
	time = 0

	# Prepearing solution array for each state
	states = ct.SolutionArray(gas, extra = ['time_ms'])

	loop_counter = 0

	# Time loop (Time integration for states)
	for n in range(time_steps):
		time += step_time

		# Advancing time
		sim.advance(time)
		states.append(r.thermo.state, time_ms = time/step_time)


		# Loop to calculate ignition delay
		# Time required to ignition delay = Time for acheiving_(initial temprature + 400k)
		if ((states.T[n] >= (T + 400)) and loop_counter == 0):

			Auto_ig_time.append(states.time_ms[n])

			loop_counter = 1

	# Plotting
	plt.figure(3)
	plt.plot(states.time_ms, states.T)
	plt.legend(['Temperature = ' + str(int(T)) + ' k' for T in temp])

plt.figure(3)
plt.grid('on')
plt.xlabel('Time in mili-second')
plt.ylabel('Auto ignition temperature in K')
plt.title('Variation in Auto-ignition temperature for variable initial temperature')

plt.figure(4)
plt.plot(temp, Auto_ig_time,'-o',color='purple')
plt.grid('on')
plt.xlabel('Initial temerature in K')
plt.ylabel('Ignition delay in mili-seconds')
plt.title('Ignition delay for variable initial temperature')

plt.show()
Output plot for above program:-
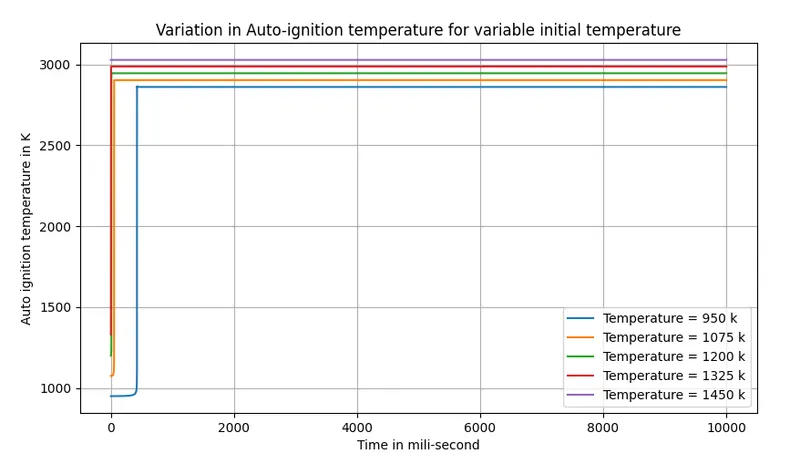 |
|
Fig: Auto ignition temperature for various inlet temperature |
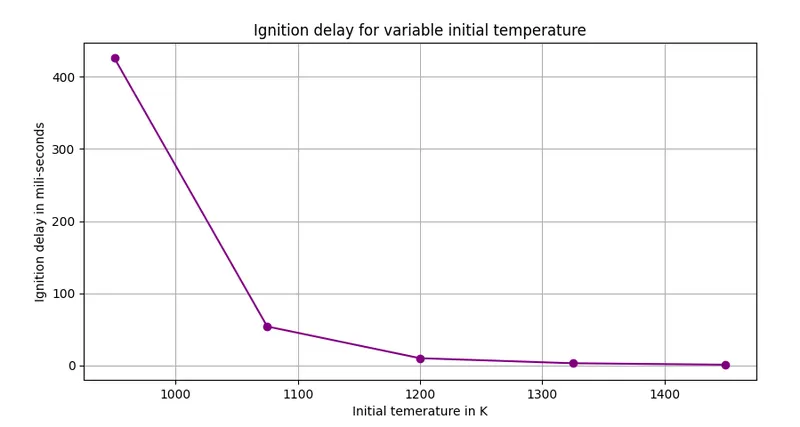 |
| Fig: Variation in ignition delay w.r.t. initial temperature |
Ignition delay value obtained for various initial temperature:-
| Temperature (k) | 950 | 1075 | 1200 | 1325 | 1450 |
| Ignition delay in (ms) | 426.0 | 54.0 | 10.0 | 3.0 | 1.0 |
~CASE 2:
Python code to observe rate of change of molar concentrations:-
'''
Program to observe rate of change of molar concentrations for different species

'''

# Importing libraries
import sys
import numpy as np
import matplotlib.pyplot as plt
import cantera as ct

# Initial temperature in K
temp = [500, 1000]

# Initial pressure in Pa
P = 5*101325

# Reactant species dictionary
species_dict = {'CH4':1, 'O2':2, 'N2':7.52}

# Total time to run simulation
simulation_time = 10 #seconds
step_time = 1e-3 #seconds i.e. milisecond
# Calculating number of timesteps
time_steps = int(simulation_time/step_time)

# Array for auto ignition delay
Auto_ig_time = []

# Loop for varying values of initial temperature
for T in temp:

	# Creating gas object
	gas = ct.Solution('gri30.xml')

	# Providing initial conditions to gas object
	gas.TPX = T, P, species_dict

	# Reactor
	r = ct.IdealGasReactor(gas)

	# Reactor network
	sim = ct.ReactorNet([r])

	# Initial time
	time = 0

	# Prepearing solution array for each state
	states = ct.SolutionArray(gas, extra = ['time_ms'])

	loop_counter = 0

	# Time loop (Time integration for states)
	for n in range(time_steps):
		time += step_time

		# Advancing time
		sim.advance(time)
		states.append(r.thermo.state, time_ms = time/step_time)

	# Plotting
	plt.figure(T)

	plt.subplot(1,3,1)
	plt.plot(states.time_ms, states.X[:,gas.species_index('H2O')],color='blue')
	plt.xlabel('Time in mili-second')
	plt.ylabel('Mole fraction of species')
	plt.legend(['H2O'] )

	plt.subplot(1,3,2)
	plt.plot(states.time_ms, states.X[:,gas.species_index('OH')],color='red')
	plt.xlabel('Time in mili-second')
	plt.legend(['OH'])

	plt.subplot(1,3,3)
	plt.plot(states.time_ms, states.X[:,gas.species_index('O2')],color='green')
	plt.xlabel('Time in mili-second')
	plt.legend(['O2'])

	plt.suptitle('Mole fraction of species for temperature = ' + str(int(T)) + ' kn')

	plt.show()
Output plot for above program:-
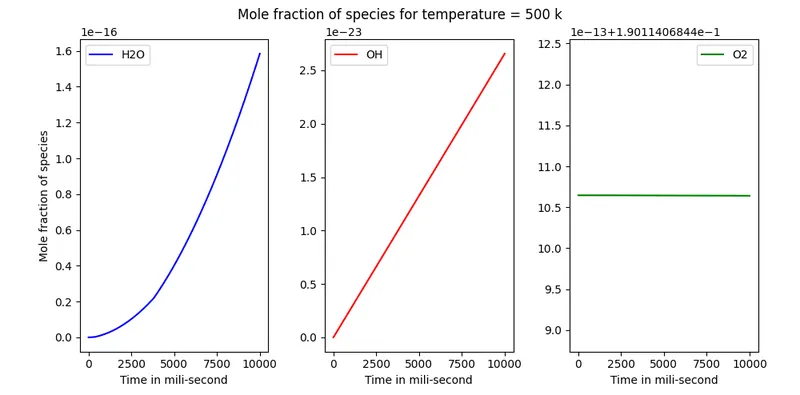 |
|
Fig: Mole fraction of species at inlet temperature of 500k |
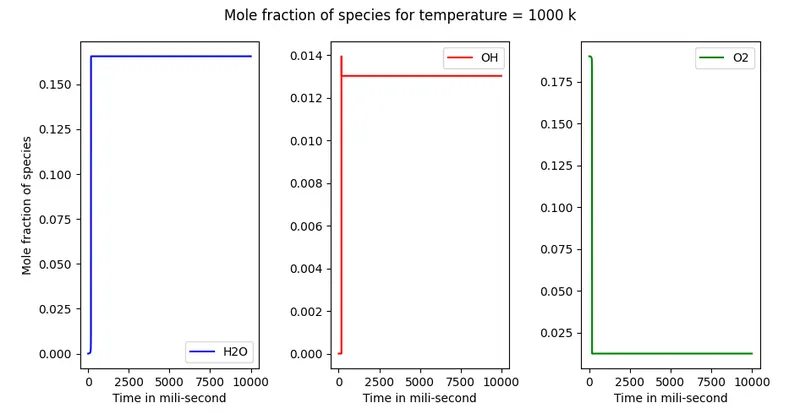 |
| Fig: Mole fraction of species at inlet temperature of 1000k |
As observed in above plots for initial temperature of 500k there is no variation in the mole fraction of the oxygen element, where OH and H2O elements varies slightly. This happens due to the bond structures of molecule. Those are single bond molecules and apparently required less temperature to react or break the bond. Whereas O2 has a double bond and requires more temperature to break the bonds.
From the above plots for initial temperature 1000K the sudden change (spike / drop) in concentration represents the stage of auto-ignition with some ignition delay.
- The H2O mole fraction is increased and then stabled throughout the simulation time. This happens due to H2O is the product in methane fuel combustion.
- The OH mole fraction is also similar as the H2O, it increases and maintains stability. It is also a product in methane combustion.
- The O2 mole fraction is decreased suddenly and maintains stability. The O2 is on the reactant side for the methane combustion and it gets consumed due to further reactions.
Conclusion:- By observing above results and plots it can be conclude that-
- As initial pressure increases the ignition delay decreases.
- With increase in initial pressure ignition temperature also increases slightly.
- Increment in initial temperature results lowering in ignition delay.
- For high initial temperature ignition temperature is also high and vice versa.
- Using 500k as initial temperature is not clever thought as ignition temperature for methane is more than 810K.
Reference:-