Week 6 Fuel cell powered vehicle model
Objective:
- To make a Matlab model of fuel cell-powered electric vehicle and to comment on the results.
Procedure:
Fuel Cell:
- A fuel cell is an electrochemical cell that converts the chemical energy of a fuel (often hydrogen) and an oxidizing agent (often oxygen) into electricity through a pair of redox reactions.
- The first fuel cells were invented by Sir William Grove in 1838. The first commercial use of fuel cells came more than a century later following the invention of the hydrogen-oxygen fuel cell by Francis Thomas Bacon in 1932. The alkaline fuel cell, also known as the Bacon fuel cell after its inventor, has been used in NASA space programs since the mid-1960s to generate power for satellites and space capsules. Since then, fuel cells have been used in many other applications. Fuel cells are used for primary and backup power for commercial, industrial and residential buildings and in remote or inaccessible areas. They are also used to power fuel cell vehicles, including forklifts, automobiles, buses, boats, motorcycles, and submarines.
Use of Fuel Cell in EV:
- FCEVs use a propulsion system similar to that of electric vehicles, where energy stored as hydrogen is converted to electricity by the fuel cell. Unlike conventional internal combustion engine vehicles, these vehicles produce no harmful tailpipe emissions.
- FCEVs are fueled with pure hydrogen gas stored in a tank on the vehicle. Similar to conventional internal combustion engine vehicles, they can fuel in less than 4 minutes and have a driving range of over 300 miles. FCEVs are equipped with other advanced technologies to increase efficiency, such as regenerative braking systems, which capture the energy lost during braking and store it in a battery. Major automobile manufacturers are offering a limited but growing number of production FCEVs to the public in certain markets, in sync with what the developing infrastructure can support.
Most common type:
- The most common type of fuel cell for vehicle applications is the polymer electrolyte membrane (PEM) fuel cell. In a PEM fuel cell, an electrolyte membrane is sandwiched between a positive electrode (cathode) and a negative electrode (anode). Hydrogen is introduced to the anode, and oxygen (from air) is introduced to the cathode. The hydrogen molecules break apart into protons and electrons due to an electrochemical reaction in the fuel cell catalyst. Protons then travel through the membrane to the cathode.
- The electrons are forced to travel through an external circuit to perform work (providing power to the electric car) then recombine with the protons on the cathode side, where the protons, electrons, and oxygen molecules combine to form water.
- The first commercially produced hydrogen fuel cell automobile, the Hyundai Tucson FCEV, was introduced in 2013, Toyota Mirai followed in 2015 and then Honda entered the market. Fuel cells are being developed and tested in trucks, buses, boats, motorcycles, and bicycles, among other kinds of vehicles.
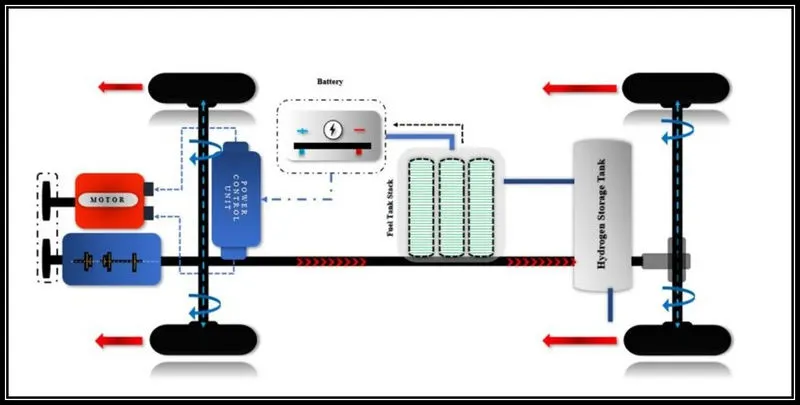
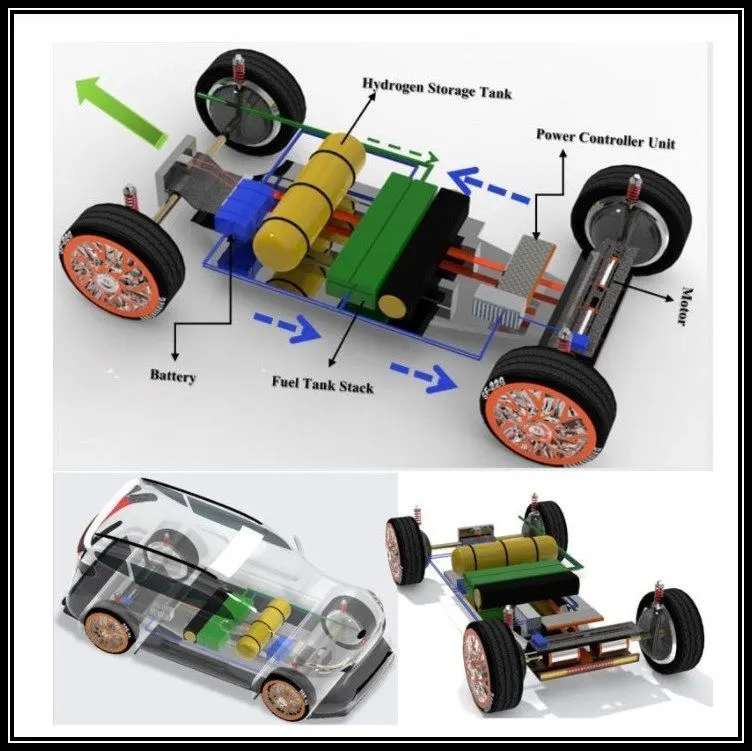
The basic Diagram of Fuel Cell Car is as given below with their main components:
- Motor
- Battery
- Power Controller Unit
- Fuel Tank Stack
- Hydrogen Storage Tank
Fuel Cell Stack by using MATLAB Simulink:
- The Fuel Cell Stack block implements a generic model parameterized to represent the most popular types of fuel cell stacks fed with hydrogen and air.
- The block represents two versions of the stack model: a simplified model and a detailed model. We can switch between the two models by selecting the level in the mask under the Model detail level in the block dialogue box.
- This model is based on the equivalent circuit of a fuel cell stack shown below:
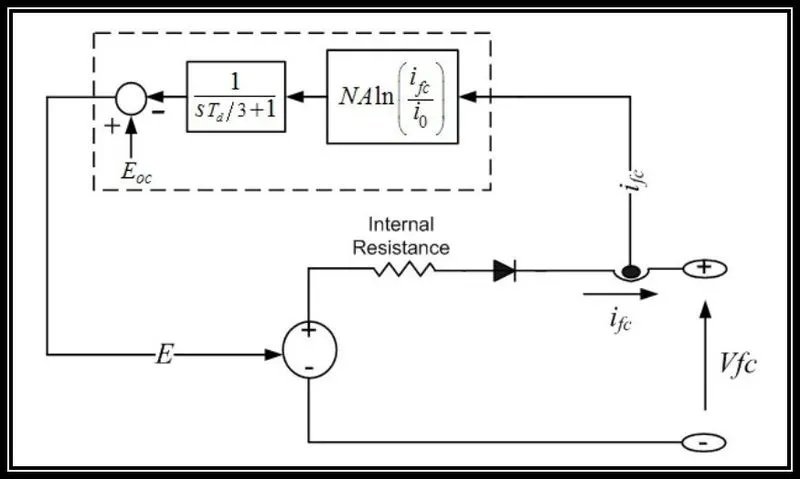
- The simplified model represents a particular fuel cell stack operating at nominal conditions of temperature and pressure.
Fuel Cell Model in SIMULINK:
Here, we are simulating a pre-loaded model of Fuel Cells in SIMULINK. To open this model enter “power_fuel_cell” in the command prompt.
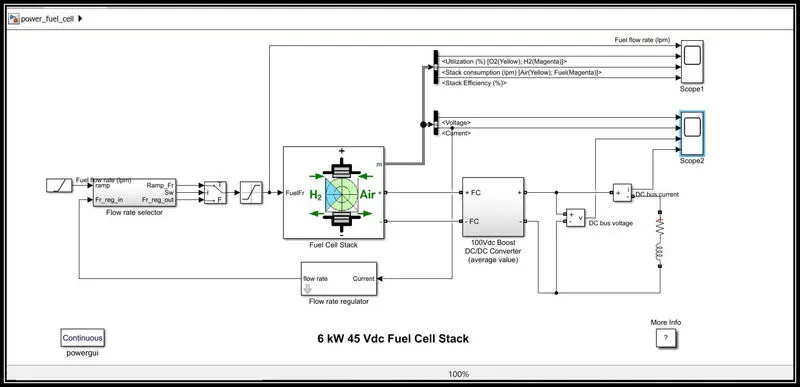
- The nominal Fuel Cell Stack voltage is 45Vdc and the nominal power is 6kW. The converter is loaded by an RL element of 6kW with a time constant of 1 sec. During the first 10 secs, the utilization of the hydrogen is constant to the nominal value (Uf_H2 = 99.56%) using a fuel flow rate regulator. After 10 secs, the flow rate regulator is bypassed and the rate of fuel is increased to the maximum value of 85 lpm in order to observe the variation in the stack voltage. That will affect the stack efficiency, fuel consumption, and air consumption.
- Fuel cell voltage, current, DC/DC converter voltage, and DC/DC converter current signals are available on Scope2. Fuel flow rate, Hydrogen and oxygen utilization, fuel and air consumption, and efficiency are available on Scope1.
Block Explanation:
Fuel Cell:
- The Fuel Cell Stack block implements a generic model parameterized to represent the most popular types of fuel cell stacks fed with hydrogen and air.
- The block represents two versions of the stack model: a simplified model and a detailed model.
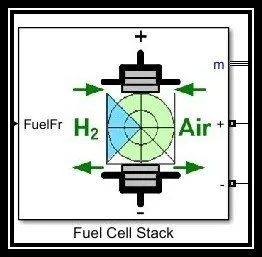
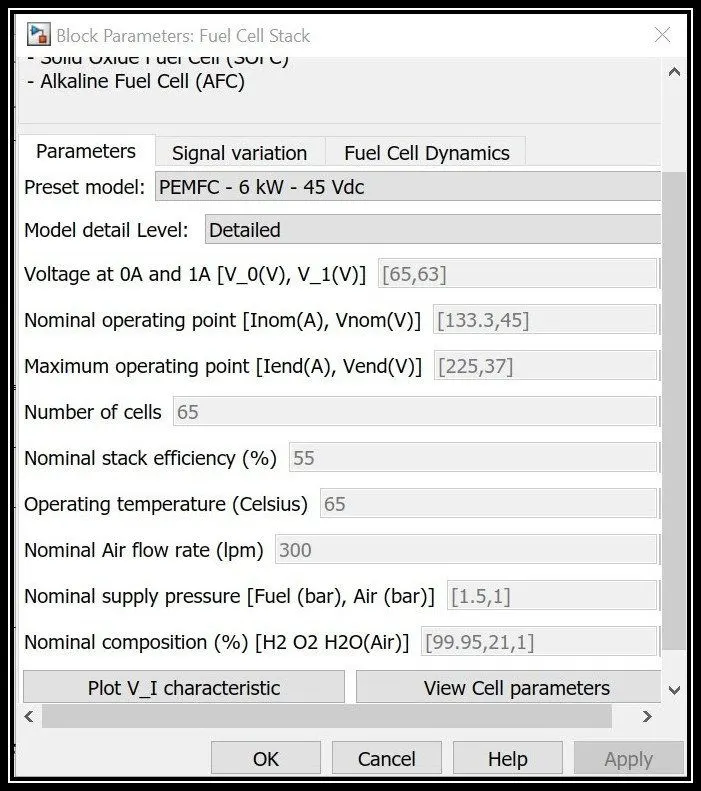
- In this model, we are using the Preset Model of PEMFC-6Kw-45Vdc.
Flow Rate regulator:
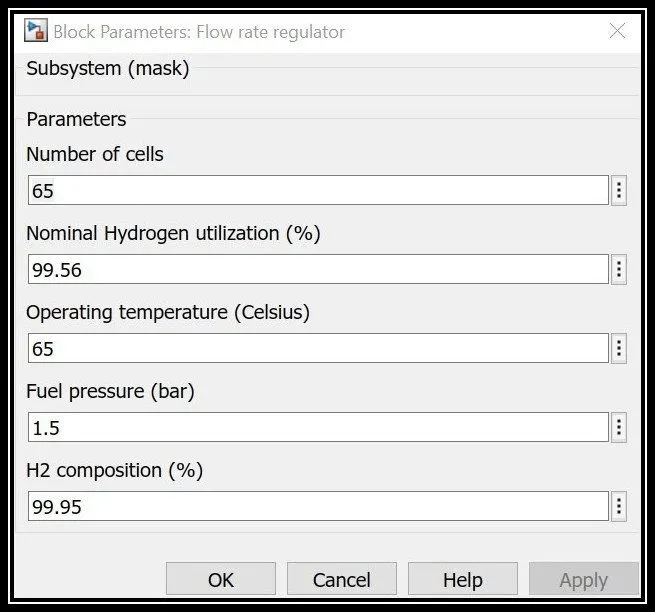
- This block is a flow rate regulator, which takes input from output current and feed as feedback to the controller, Flow rate selector.
- The circuit has a clock that outputs the current simulation time A compare to the constant block is set up, which lets the signal start after 10 seconds as it is using >10 operators and pass it to the Edge Detector which detects the change of 10. Now the signal goes into the Sample and Hold block where the holds it and pass it according to the values. Here circuit has 2(Fr_reg_in) for input, if it does not satisfy, then will go into 3(Fr_reg_out).
Ramp:
- The Ramp block generates a signal that starts at a specified time and value and changes by a specified rate.
- The block's Slope, Start Time, and Initial output parameters determine the characteristics of the output signal.
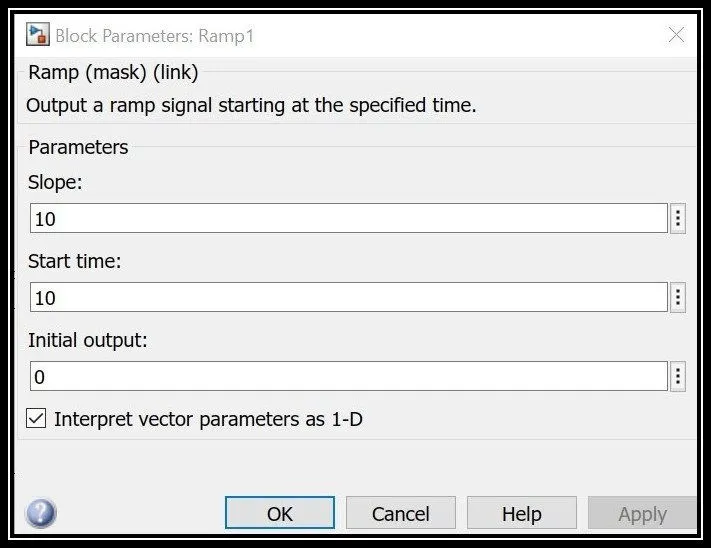
- Here we can change the value of slope according to our configuration but it is fully dependent upon the vehicle drive cycle.
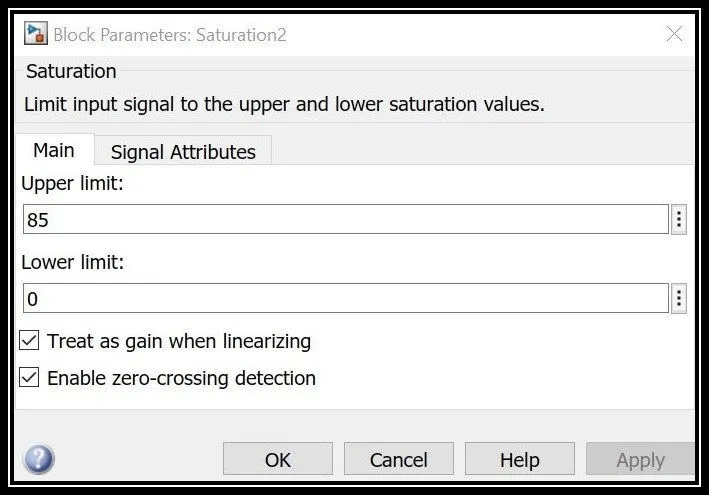
Saturation:
- The Saturation block produces an output signal that is the value of the input signal bounded to the upper and lower saturation values.
- The upper and lower limits are specified by the parameters Upper limit and Lower limit.
Cell Parameter:
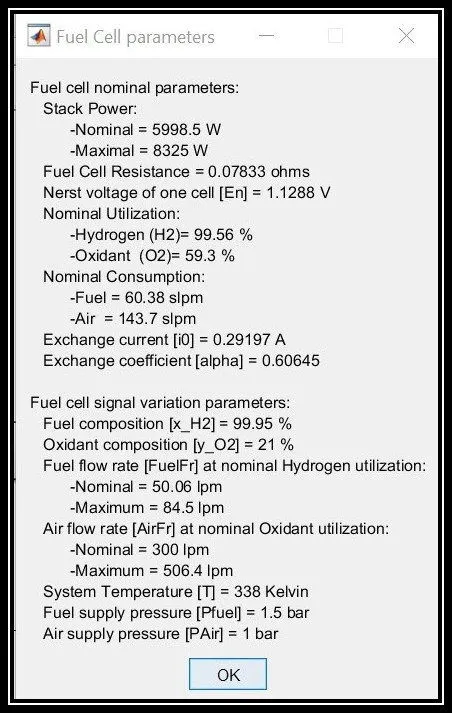
- To view the model cell parameter just click the “View cell parameter”. It is the overall parameter of the fuel cell stack.
Boost DC/DC Converter:
Results:
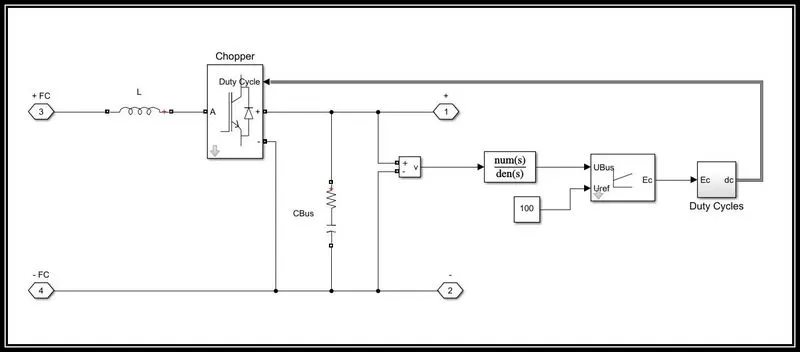
- At t=0 s, the DC/DC converter applies 100Vdc to the RL load (the initial current of the load is 0A). The fuel utilization is set to the nominal value of 99.56%. The current increases to the value of around 130A. The ow rate is automatically set in order to maintain the nominal fuel utilization. Observe the DC bus voltage scope-2 which is very well regulated by the converter. The peak voltage of 122Vdc at the beginning of the simulation is caused by the transient state of the voltage regulator.
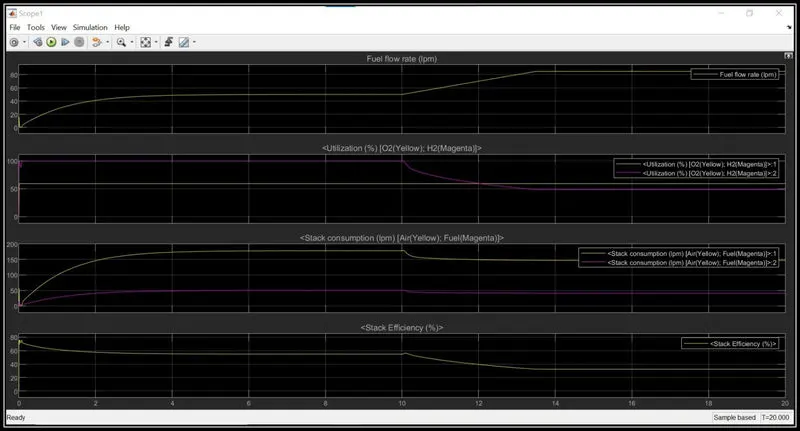
- At t=10s, the fuel ow rate is increased from 50 liters per minute to 95lpm during 3.5s reducing by doing so the hydrogen utilization. This causes an increase of the Nearest voltage so the fuel cell current will decrease. Therefore, the stack consumption and efficiency will decrease scope-1.
Scope-1:
Flow Rate:
- The flow rate increases initially and it remains constant.
- The fuel rate changes are in accordance with the drive cycle.
- At t=10sec the flow rate again increases to almost 85 and it remains constant.
Utilization:
- As the Flow rate increases, we can observe that there is a reduction in the utilization of Hydrogen from 100% to 45% Whereas, Oxygen remains constant with a value of 60%.
Stack Consumption and Stack Efficiency:
- The stack consumption of the air & fuel increases during the start of the vehicle the air consumption is around 150 lpm & fuel consumption is 50 lpm. The stack efficiency decreasing during the start where the fuel consumption is high & the efficiency becomes constant & reaches around 40% during the end of the cycle.
Scope 2:
- This scope represents the voltage and current behavior of the Fuel cell stack.
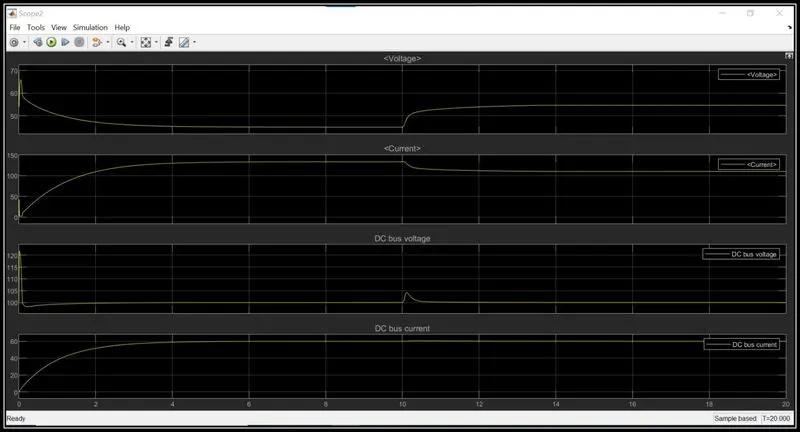
- The voltage and current changes in accordance with the driving cycle.