Fuel cell modeling to work under UDDS load cycle using Matlab/Simulink
AIM: To learn Fuel cell behavior using Matlab/Simulink
INTRODUCTION:
Fuel cell:
A fuel cell is an electrochemical device that converts chemical energy into electrical energy. A fuel cell is one of the good alternatives for a battery as an energy storage device as well as an alternative for IC engine vehicles. Currently, Fuel cells are in their developing stage, and research on fuel cells is being done rigorously.
Fuel cells can be used from compact devices to large scale storage and in the near future have a great scope of replacing batteries. Fuel cells, when compared to batteries, have higher energy density but lower power output and have a slow response to varying load when compared to a battery. A fuel cell can be used in a full fuel cell vehicle like Toyota Mirai or can be combined along with a battery in a Hybrid Electric Vehicle (HEV). A combination of these two can help HEV to achieve high mileage with the help of fuel cell and quick response using a battery. The major drawback of using a Fuel cell is that it requires a separate Fuel (Hydrogen in hydrogen PEMFC) storage tank which requires additional space and increases the weight of the overall system. Hydrogen being highly volatile need a very complex storage system and stands as one of the biggest limitations in fuel cell development.
Working principle:
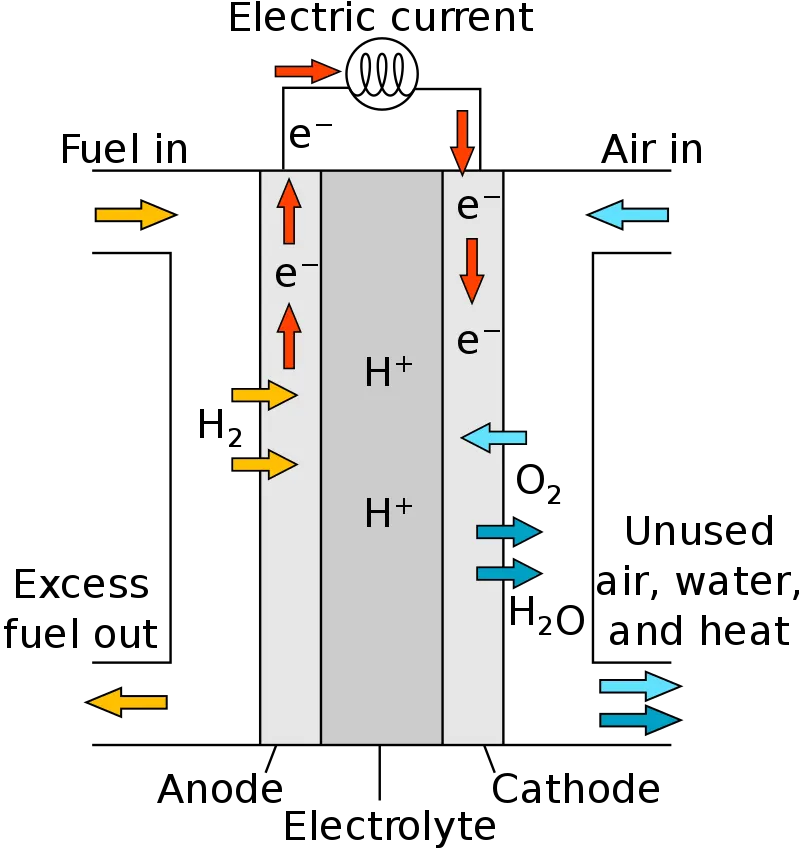
ANODE REACTION:
`H_2 -> 2H^+ + 2e^-`
CATHODE REACTION:
`O_2 + 4H^+ + 4e^(-)-> 2H_2O`
OVERALL REACTION:
`2H_2 + O_2 -> 2H_2O`
The fuel cell takes Hydrogen as Fuel at the anode and requires oxygen at the cathode which is provided from the air. By changing the cathode inlet from air to pure oxygen fuel cell performance can be improved. The operating temperature and longevity of the fuel cell are also better than a mobile/compact battery. Compared to IC engine vehicles, a Fuel cell produces no harmful exhaust gases like NOx, CO2, etc the only exhaust gas produced by a fuel cell is water.
Fuel cell power output can be controlled by varying parameters like the mass flow rate of fuel and mass flow rate of air intake.
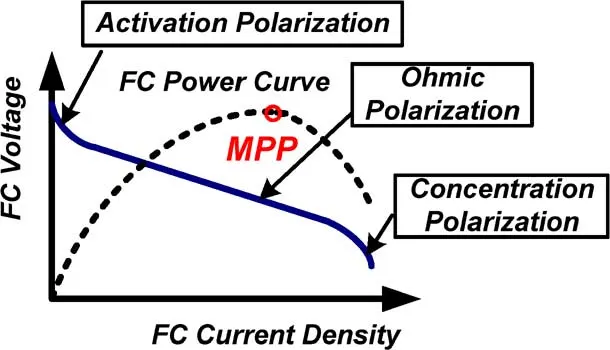
It can be seen from the above graph that with an increase in voltage there is a decrease in current and the slopes at the start and end of the curve are very steep. These operation zones are known as zones of Activation polarization and concentration polarization. Fuel cell Voltage is given as below,
`E_(cell) = E^0(T,p) - eta_(act,a) - | eta_(act,c)| - eta_(ohm) - eta_(conc,a) - |eta_(conc,c)| - eta_(cross)`
where,
`E^0(T,p)` = equilibrium OCV (Nernst potential)
`eta_(act,a),eta_(act,c)` = activation ( or kinetic) overpotential
`eta_(ohm)` = ohmic overpotential
`eta_(conc,a),eta_(conc,c)` = concentration (or mass transport) overpotential
`eta_(cross)` = loss due to crossover and electronic short circuit
a and c refers to anode and cathode
Max voltage of fuel cell can be calculated as follows = `-(triangleH)/(nF)`
Waste heat = `P_H=iA((-triangleH)/(nF) - E_(cell))`
Fuel cell vehicles:
- 2008 - Honda FCX Clarity
- 2015 - Toyota Mirai
- 2016 - Riversimple Rasa
- 2016 - Honda Clarity Fuel Cell
- 2018 - Hyundai Nexo
SIMULATION AND RESULTS:
So a rough background on the working of fuel cells and its applications along with advantages and disadvantages over a battery is discussed. To learn the fuel cell behavior under a load, Matlab/Simulink software is used for modeling a fuel cell system and studying various parameters.
Below is the plot which shows the complete setup which is provided in Matlab and can be accessed by running a command "power_fuel_cell".
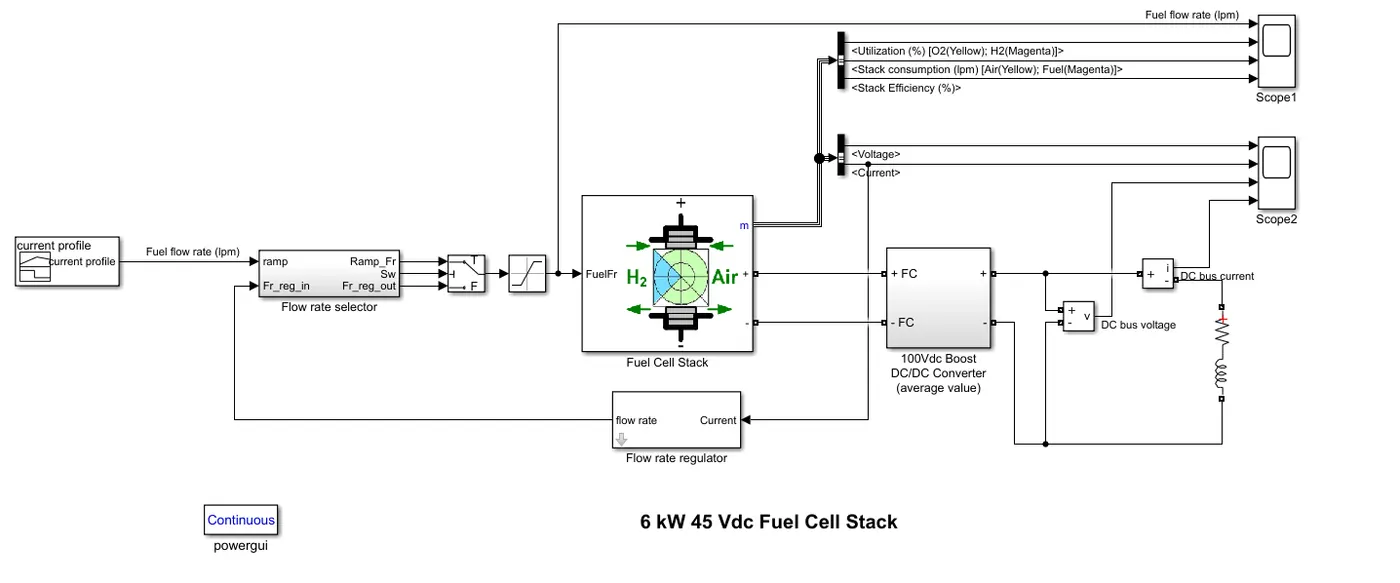
The above system has a generic Fuel cell stack available from the Simulink library and a 6kW and 45Vdc PEMFC (Proton exchange membrane fuel cell) is selected from default configurations provided.
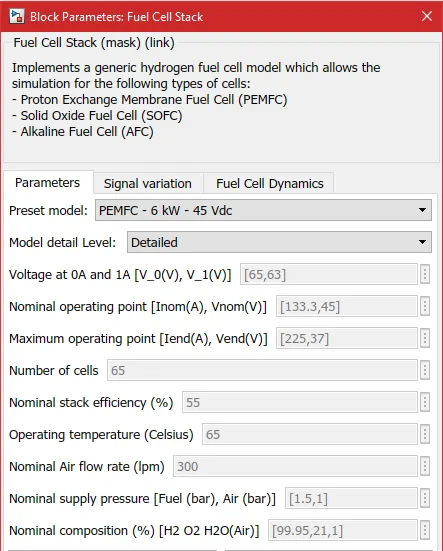
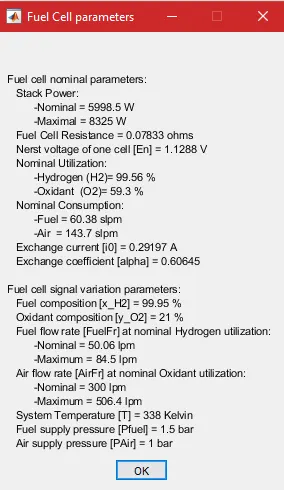
The above two figures show the values/parameters used for configuring a generic fuel cell stack on Simulink.
The polarization curve V-I curve for the current configuration is as below
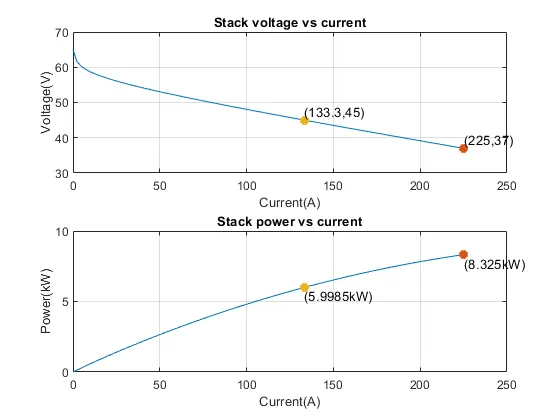
From the above plot, it can be observed that the polarization curve for the configured system has a pattern similar to the standard polarization curve for a fuel cell and the nominal and maximum voltage, as well as power, lies at a point on the curve which falls under ohmic polarization zone. Also, it can be observed that the voltage is least in the working range of fuel cell when the power output is maximum and for maximum voltage the power output is minimum.
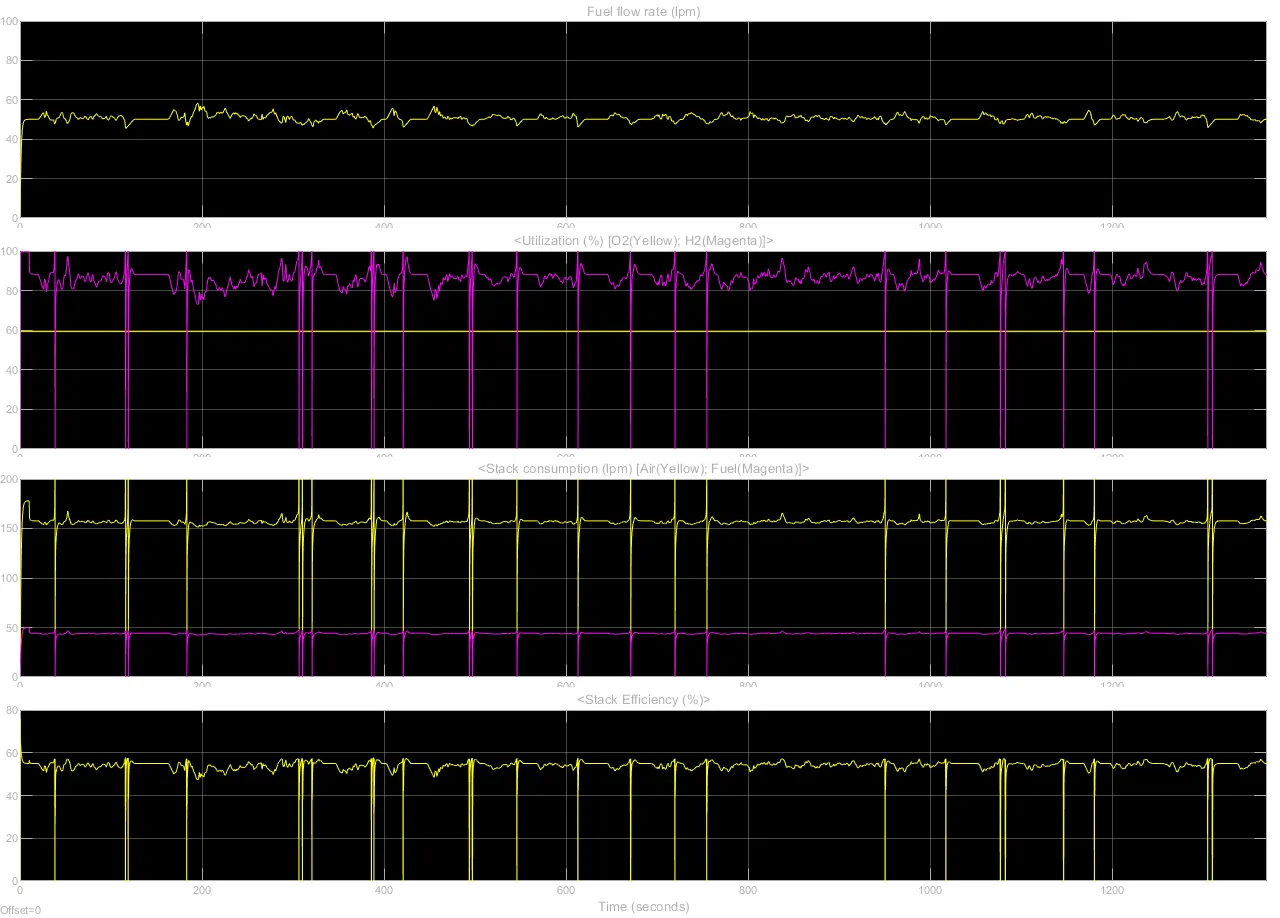
In the Simulink setup A generic Fuel cell is used as explained above, current is applied with a loop input where the current will be given a value which is equal to the value of current in previous time step. This current is converted to mass flow rate of fuel in to the fuel cell in litres per minute (Fuel is hydrogen in this case) by using this function `60000*8.3145*(273+T)*Nc*u(1)/(2*96485*(Pf*101325)*(Uf_(H_2))/100*x/100)`. Similarly any load can be given in the form of litres per minute to the fuel cell or by using standard drive cycles. A signal builder block is used to provide UDDS cycle as the load input to the fuel cell. Two scopes are used where scope 1 shows Fuel flow rate, Hydrogen and Oxygen consumption, Air and Fuel consumption, and Stack efficiency. Scope 2 shows Voltage and Current.
Standard load cycles:
Standard load cycles for batteries are the values obtained by realtime experimental values using a vehicle and measuring its load requirement while driving it through an actual urban road, rural road, or expressways as per desired.
These load cycles can be used for simulating the battery performance or for battery stability when it will be actually used in a vehicle. These standard load cycles are available for free/paid on government or private company websites.
One of the examples of such a driving cycle is the EPA Urban Dynamometer Driving Schedule (UDDS)
UDDS load cycle was used to observe the realtime cell characteristics under this load cycle.
UDDS Cycle:
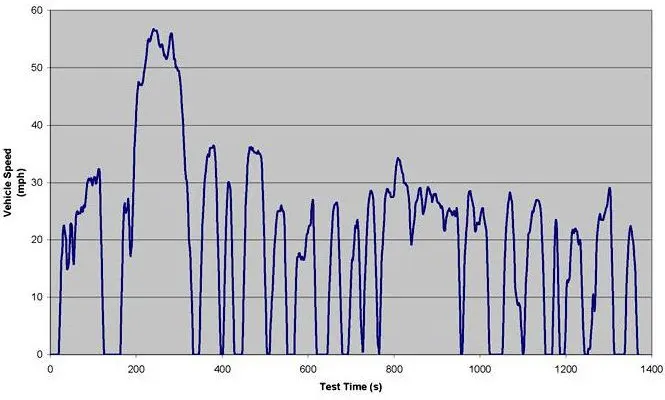
The above-obtained plot is for Vehicle speed vs time and is converted to Current vs Time as shown below.
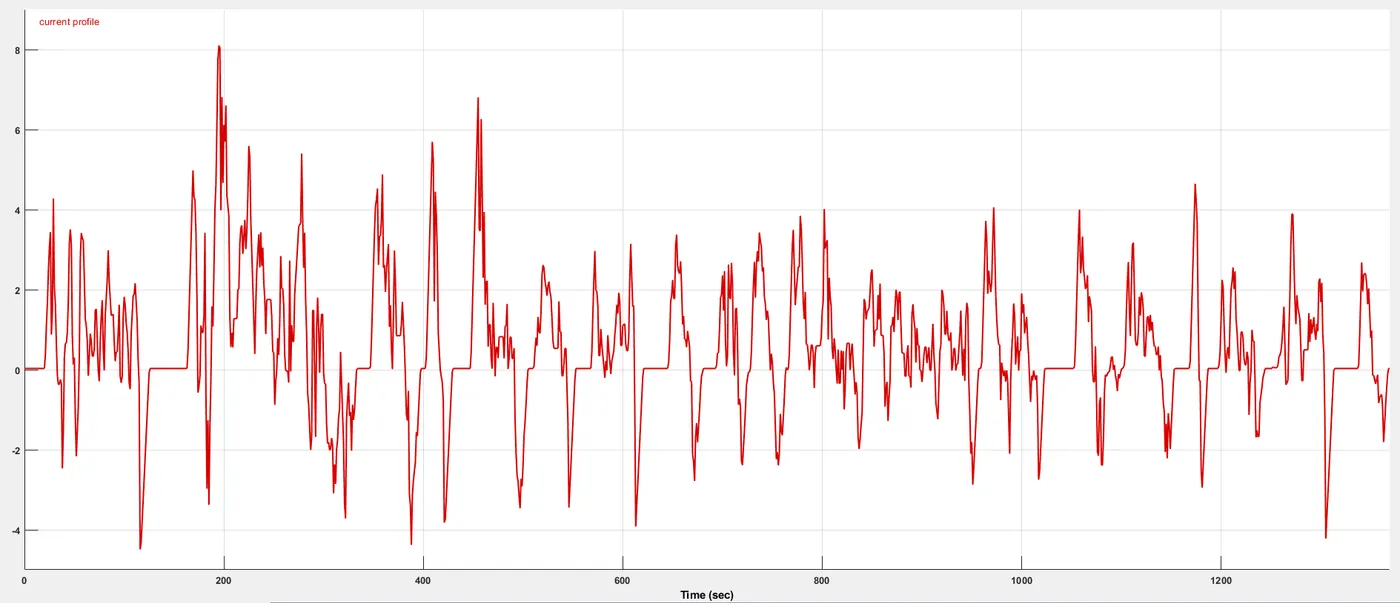
The above plots were obtained using the following conditions:
Duration: 1369 seconds
Distance: 7.45 miles
Average speed: 19.59 mph
Scope-1 Results:
Scope-2 Results:
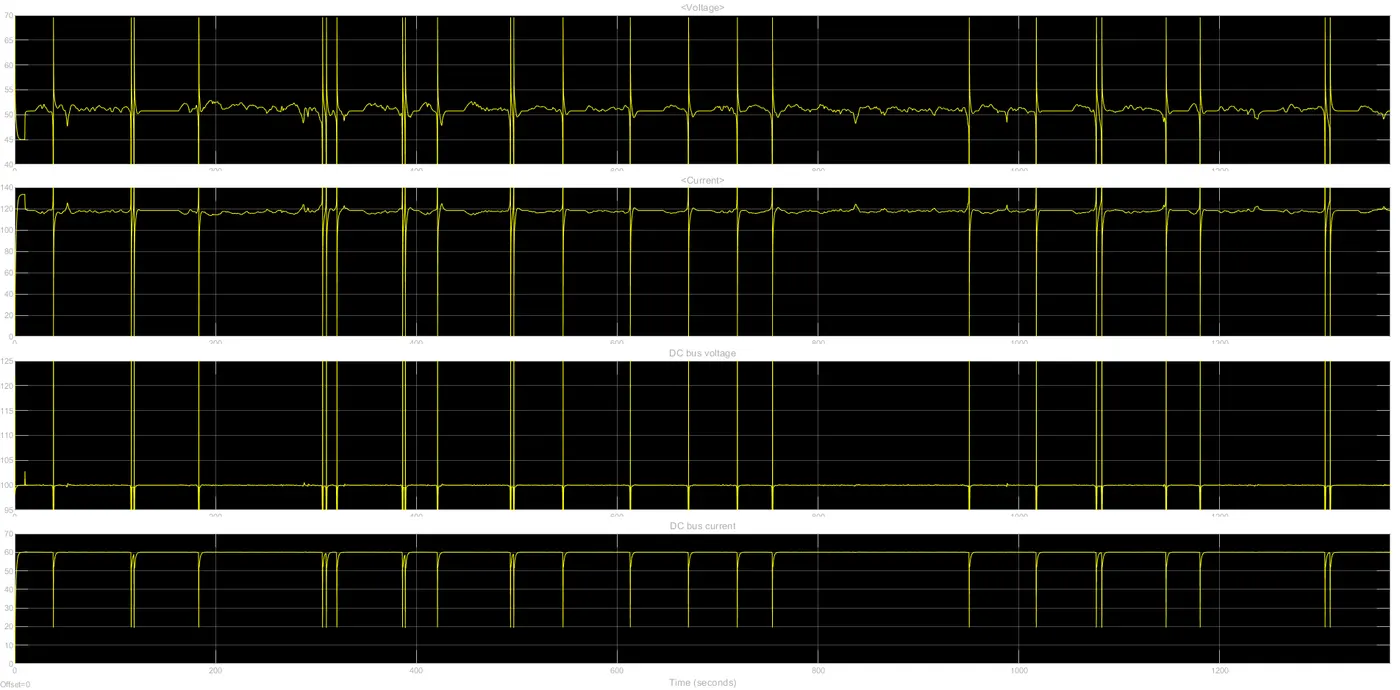
It can be observed that for increase in load the mass flow rate of fuel, Hydroen/oxygen/air consumption increases as per the required load and when the UDDS cycle has negative load or at charging load the consumption drops to 0 lpm. Fuel cell does not discharge or charge when compared to a battery. Fuel cell just converts chemical energy to electrical energy and fuel cell is said to be discharged when the fuel in storage tank is empty. Also the refuel time for a fuel cell is around 3 minutes while recharge time for a battery is around 60 minutes. Since the fuel cell does not require any kind of charging and is completely based on fuel conversion the output parameters for fuel cell drops to zero '0' when the load is in charging state. "We have this charging state because the load cycle used is a UDDS cycle which is taken from a electric vehicle".