Data analysis Using Python
DATA ANALYSIS USING PYTHON
Objective:
File parse a document that contains various data of an engine. Using this data and analysis of different properties of an engine using python.
Problem Statement:
To write a script that does the following:
- Data visualizer.
Write a script that gets inputs from the user and produces plots for inputted values.
- Compatibility check.
Identifies illegal input and throws an error message.
- Basic performance calculation.
The area under PV diagram, Engine power, SFC (Specific Fuel Consumption).
Solution Procedure:
- The document opens in python using “open()”
- Lines are distinguished with the first letter on it.
- Names of elements, Units, concurrent values are extracted as strings and floats.
- Data separated with respect to column numbers.
- With user input numbers plots are made.
- Area of PV Diagram calculated using Trapezoidal rule.
- Power and SFC calculated using formulas.
PROGRAM:
import matplotlib.pyplot as plt
import numpy as np
import sys
#Initial condition null matrix
DataX=[]
DataY=[]
DataP=[]
DataV=[]
#Condition
Condition=1
#Gets inputs
while Condition==1:													#Loop runs while entered integer are accepted
	print("Enter Coloum numbers from 1 to 17")
	inp1=(input("Enter first coloum (X axis):"))					#Coloum number of X axis
	inp2=(input("Enter second coloum (Y axis):"))					#Coloum number of Y axis
	#Convert inputs as integers
	inp1=int(inp1)
	inp2=int(inp2)
	#Loop enters onlt if int values within range
	if inp1 in range(1,18) and inp2 in range(1,18):
		Condition=0
	#Else it throw an error and get input again
	else:
		print("File not recognized. Please provide a valid CONVERGE output file")

for line in open("engine_data.out"):    			#Open program and process starts
	if "Crank" in line: 							#If line contains word crank line enter into loop
	#Get values of species name in line
		Name1=str(line.split()[inp1])				#Split line into cells and take species name as string of input 1
		Name2=str(line.split()[inp2])				#Split line into cells and take species name as string of input 2
	#Get values of Units in line
	if "(DEG)" in line:								#If "(DEG)" found in line loop will enter
		Unit1=str(line.split()[inp1])				#Split line into cells and extract (input 1) value as string
		Unit2=str(line.split()[inp2])				#Split line into cells and extract (input 2) value as string
	#Take values in document
	if "#" not in line:
		DataX.append(float(line.split()[inp1-1]))	#DataX.stores values of selected coloum,splitline into coloums,convert into float and append
		DataY.append(float(line.split()[inp2-1]))	#DataY.stores values of selected coloum,splitline into coloums,convert into float and append
		DataP.append(float(line.split()[1]))		#DataP.stores values of pressure coloum(1),splitline into coloums,convert into float and append
		DataV.append(float(line.split()[7]))		#DataV.stores values of Volume coloum(2),splitline into coloums,convert into float and append

#Titel for graph
Titel=Name1,'Vs',Name2
#Area calculation using Trapizoidal rule
area = np.trapz(DataP,DataV)     					#Under this rule, the area under a curve is evaluated by dividing the total area into little trapezoids rather than rectangles.
print("------------------------------------------------------------------------------------------------------")
print("ENGINE PERFORMANCES")
print("`````` ````````````")
print("Area under PV diagram =%5.5f"%area,"Nm")			#Print area
Pow=area*1500*60									#Engine power calculation workdone/ Time(h)
print("Power output=%5.5f"%Pow,'Kw-h')				#Print value of Power
SFC=20*1500*60*pow(10,-5)/Pow 					#Specific Fuel consumption =Fuel per hour/ Power of engine
print("SFC=%0.5f"%SFC,"Kg/Kw-h")

#Plot results
plt.plot(DataX,DataY)
plt.xlabel(Name1+Unit1)
plt.ylabel(Name2+Unit2)
plt.title(Titel)
plt.savefig(str(Titel)+'.png')
plt.show()
Program methodology:
Inputs:
Using while loop inputs are taken from the user. If it doesn’t place within limits program throws an error and start from the beginning. This runs until user input is valid.
File Parse:
- Element names:
If the line contains the word “crank” it enters into a loop. Then line split into columns using line.split(). For the user input column number, it reads value and extracts as a string and saved in Name.
- Units:
If the line contains a word “(DEG)” it enters into a loop. Line breaks into columns and particular column data will be extracted as a string.
- Element data:
If the line doesn’t contain “#” loop enters and the line will be broken into a column. The user input column number, will be extracted in and append to form a matrix.
The area under Curve:
Trapezoidal Rule is used to find the area under the curve. Under this rule, the area under a curve is evaluated by dividing the total area into little trapezoids rather than rectangles.
Syntax: np.trapz(y,x)
np is numpy.
Results and Discussion:
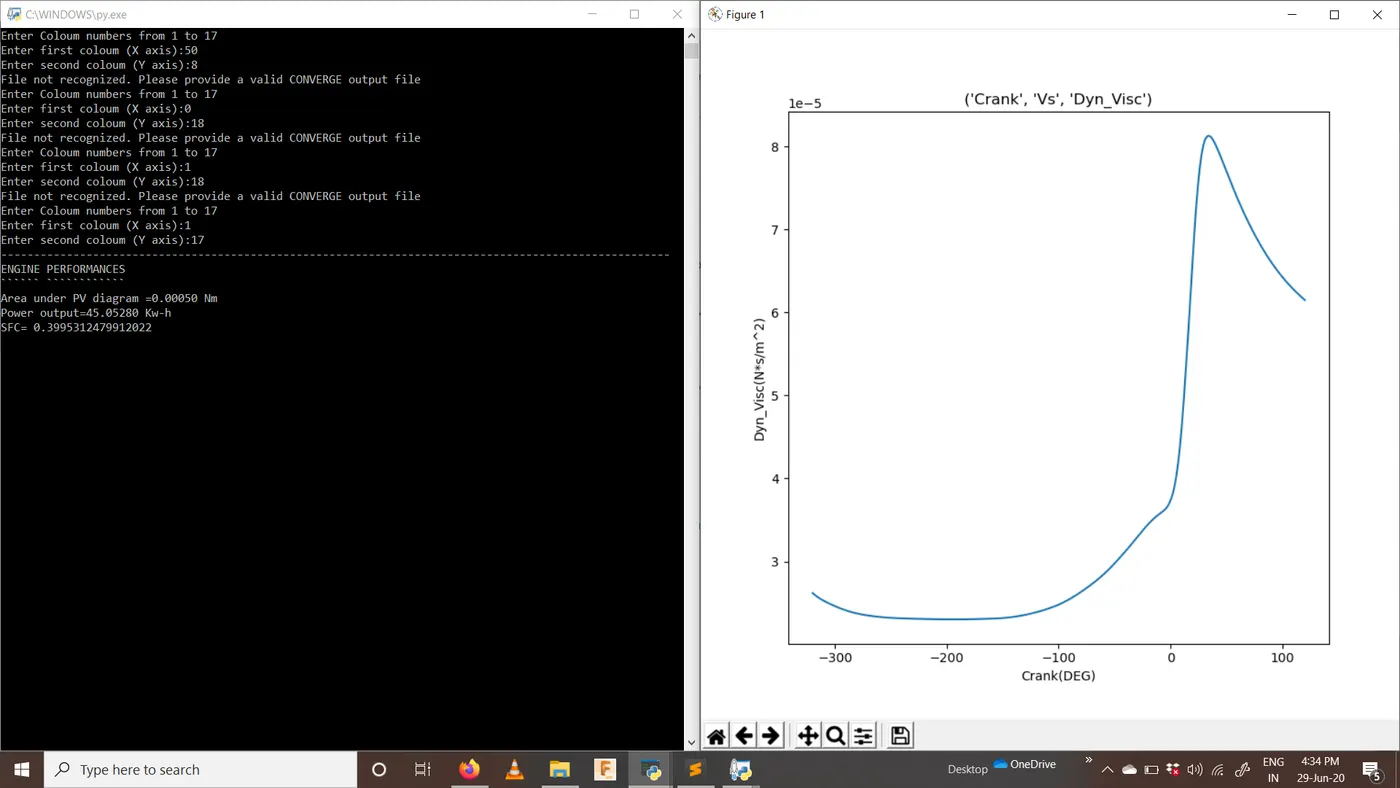
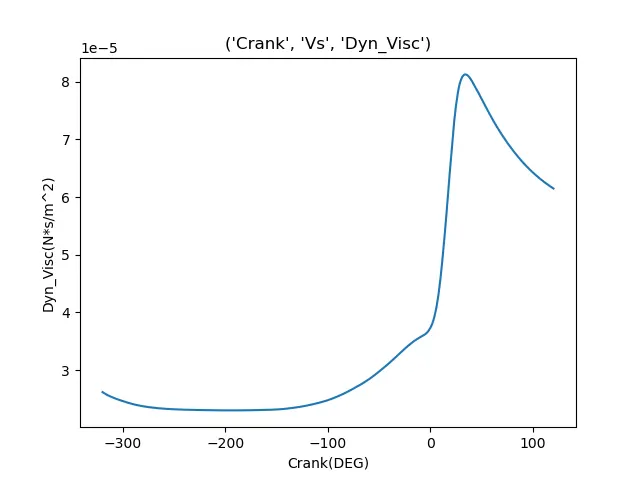
Here program executed and plots and values are created and listed below.
PLOT:
Result:
Area under PV diagram = 0.0005005866274680075
Power output=45.05280 Kw-h
SFC= 0.39953 Kg/kW-h
This program parses file “engine data” and concurrent values are plotted. And engine power and SFC calculated.
SCREENSHOT: