Week 6 - Data analysis
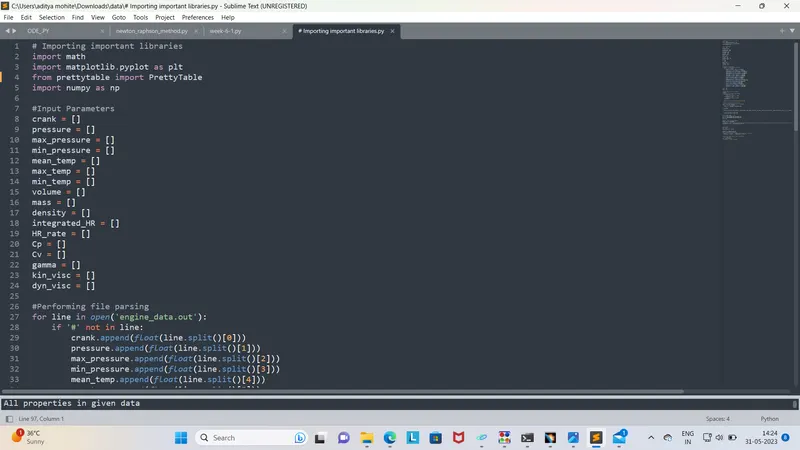
# Importing important libraries
import math
import matplotlib.pyplot as plt
from prettytable import PrettyTable
import numpy as np

#Input Parameters
crank = []
pressure = []
max_pressure = []
min_pressure = []
mean_temp = []
max_temp = []
min_temp = []
volume = []
mass = []
density = []
integrated_HR = []
HR_rate = []
Cp = []
Cv = []
gamma = []
kin_visc = []
dyn_visc = []

#Performing file parsing
for line in open('engine_data.out'):
    if '#' not in line:
        crank.append(float(line.split()[0]))
        pressure.append(float(line.split()[1]))
        max_pressure.append(float(line.split()[2]))
        min_pressure.append(float(line.split()[3]))
        mean_temp.append(float(line.split()[4]))
        max_temp.append(float(line.split()[5]))
        min_temp.append(float(line.split()[6]))
        volume.append(float(line.split()[7]))
        mass.append(float(line.split()[8]))
        density.append(float(line.split()[9]))
        integrated_HR.append(float(line.split()[10]))
        HR_rate.append(float(line.split()[11]))
        Cp.append(float(line.split()[12]))
        Cv.append(float(line.split()[13]))
        gamma.append(float(line.split()[14]))
        kin_visc.append(float(line.split()[15]))
        dyn_visc.append(float(line.split()[16]))

title = []
units = []

# Taking title from data provided
linecount = 1
for line in open('engine_data.out'):
    if linecount == 3:
        title.append(line.split())
    if linecount == 4:
        units.append(line.split())
    linecount+=1

t = [0,1,2,3,4,5,6,7,8,9,10,11,12,13,14,15,16]

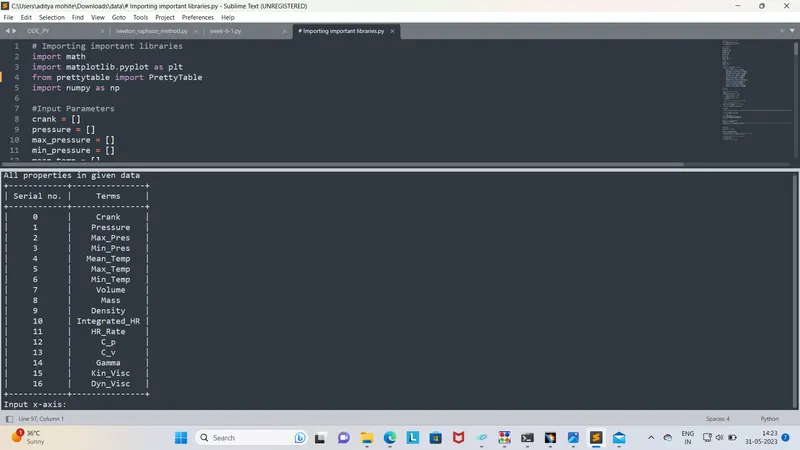
print('All properties in given data')
table = PrettyTable(['Serial no.', 'Terms'])
for i in range(0,len(t)):
    table.add_row([t[i], title[0][i+1]])

print(table)

a = [crank, pressure, max_pressure, min_pressure, mean_temp, max_temp, min_temp, volume, mass, density, integrated_HR, HR_rate, Cp, Cv, gamma, kin_visc, dyn_visc]

x = int(input('Input x-axis: '))
y = int(input('Input y-axis: '))

plt.plot(a[x],a[y], 'r--')
plt.xlabel(title[0][x+1]+units[0][x+1])
plt.ylabel(title[0][y+1]+units[0][y+1])
plt.show()

pressure = np.array(pressure)*1e6
volume= np.array(volume)
area_under_pv = np.trapz(pressure,volume) #np.trapz integrates along given axis using trapezoidal rule and calculate the area under the curve
print('Work done = ', area_under_pv,'Joules')


#Power output
rpm = 1500
time_of_one_rev = rpm/60

onecycle = 2*time_of_one_rev
power = area_under_pv/onecycle
print('Power of engine = ',power,"Watt"'(when rpm is 1500)')
print('Power of engine = ', power/0.746, 'HP')

#Calculating Brake Specific Fuel Consumption
m = 20*pow(10,-6)
bsfc = (3600*m)/power
print('BSFC = ', bsfc, 'g/kWH')
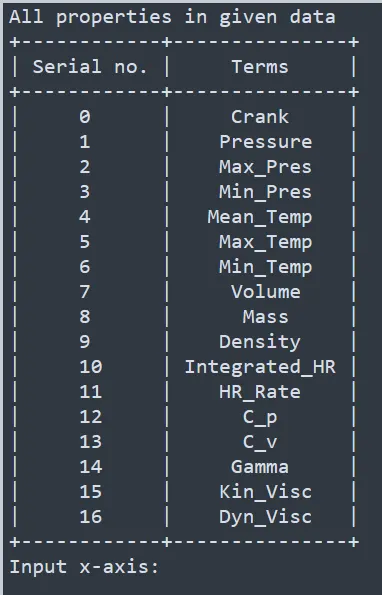
All properties in given data
+------------+---------------+
| Serial no. |     Terms     |
+------------+---------------+
|     0      |     Crank     |
|     1      |    Pressure   |
|     2      |    Max_Pres   |
|     3      |    Min_Pres   |
|     4      |   Mean_Temp   |
|     5      |    Max_Temp   |
|     6      |    Min_Temp   |
|     7      |     Volume    |
|     8      |      Mass     |
|     9      |    Density    |
|     10     | Integrated_HR |
|     11     |    HR_Rate    |
|     12     |      C_p      |
|     13     |      C_v      |
|     14     |     Gamma     |
|     15     |    Kin_Visc   |
|     16     |    Dyn_Visc   |
+------------+---------------+
Input x-axis: