Week 6 - Data analysis
Introduction
data analysis
Data Analysis is the technique to collect, transform, and organize data to make future predictions, and make informed data-driven decisions. It also helps to find possible solutions for a business problem. There are six steps for Data Analysis. They are:
- Ask or Specify Data Requirements
- Prepare or Collect Data
- Clean and Process
- Analyze
- Share
- Act or Report
Each step has its own process and tools to make overall conclusions based on the data.
here output from converge Engine Data are split and stored in a variable to analyse the data and create Graphical output
Basic performance calculation of engine
Brake-specific fuel consumption (BSFC)
Brake-specific fuel consumption (BSFC) measures the fuel efficiency of any prime mover that burns fuel and produces rotational or shaft power. It is typically used for comparing the efficiency of an IC engine with a shaft output.
mathematically
BSFC= m / p
m - Specific Fuel consumption in mg or g
p- power in w ( constant volume intagral of pv)
Python Code
# program by Jagaveerapandiyan
import math
import matplotlib.pyplot as plt
import numpy as np
from scipy.integrate import simps
from tabulate import tabulate
# file check
try:
		open('engine_data.out','r')
		print('File Succesfully recognized')

except:
		print('file not found, please provide a valide converge file')

data='engine_data.out'

# file parsing
column_cou = 0
row_cou = 0
header = 0
column_num = []
column_title = []
data_units= []
# extracting column value data
for line in open(data,'r'):
	if '#' not in line:
		row_cou = row_cou +1
# extracting heading (3) & units (4)
	else:
		header = header + 1
		if header ==3:
			column_title.append(line.split())

		if header ==4:
			data_units.append(line.split())


#print(row_cou)
#print(data_units)
print(column_title)
print('choose above title to calculate value starts from 0')
# enter value to get result for graph
x = int(input(' enter column number for x-axis: '))
y = int(input('enter column number for y-axis: ') )

line_count = 1
x_value = []
y_value = []

for line in open(data,'r'):
	if '#' not in line :
		x_value.append(float(line.split()[x]))
		y_value.append(float(line.split()[y]))

xlabel= (column_title[0][x+1] + data_units[0][x+1])
ylabel= (column_title[0][y+1] + data_units[0][y+1])
"""
print('--------------------------------------------------')
print('|',xlabel,'  ','|',ylabel,'  ','|')
for i in range(0,len(x_value)):
		print('|',x_value[i],'  ','|',y_value[i],' |')
print('---------------------------------------------------')
"""

plt.plot(x_value,y_value)
plt.xlabel(xlabel)
plt.ylabel(ylabel)
plt.title(column_title[0][x+1] +  'vs'  + column_title[0][y+1] )
plt.savefig(column_title[0][x+1] + 'vs' + column_title[0][y+1] + '.png')
plt.show()


if x== 1 and y== 7:


#power output
# revalution per minute
	rpm = 1500
# secound per revalution
	spr = 60/rpm
# secound per cycle
	spc = 2*spr

	pvarea = np.trapz(x_value,y_value)
	power = pvarea/spc
	print('-----------------------------')
	print('Basic performance calculation')
	print ('power=',power,'watt')
	print ('power=',power*0.00135962,'HP')

# Specific Fuel consumption mg of fuel to g
	m= 20*1e-6
# Brake Specific Fuel Consumption
	bsfc = 3.6*1e6*(m/pvarea)


	print('bsfc=',bsfc,'g/kw.H')
	print("-----------------------------")

else:
	print('specify pressure & volume to display Basic performance calculation')
Auto storage of output
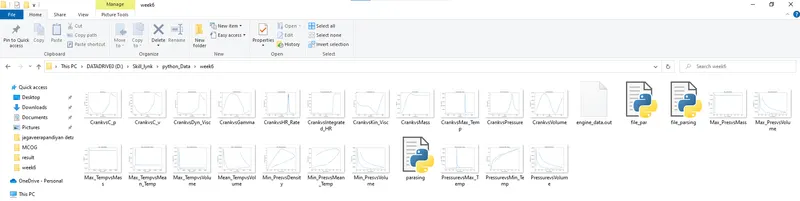
Output

Compatibility check
if the file is not in the folder

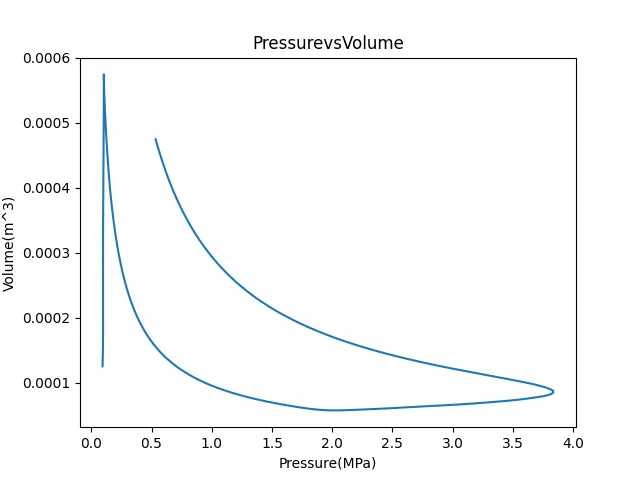
Pressure Vs Volume
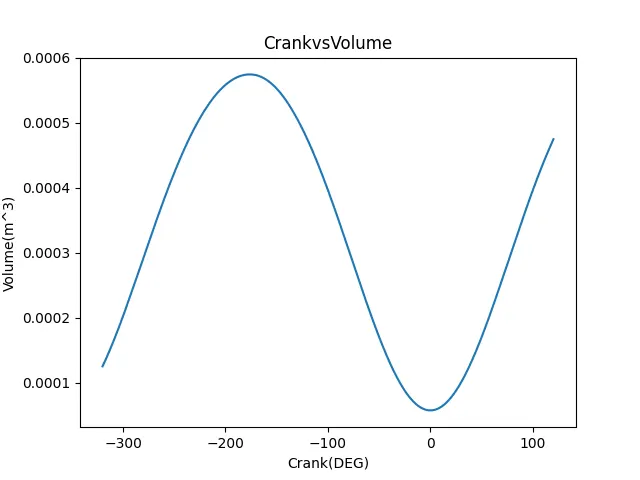
Crank Vs Volume
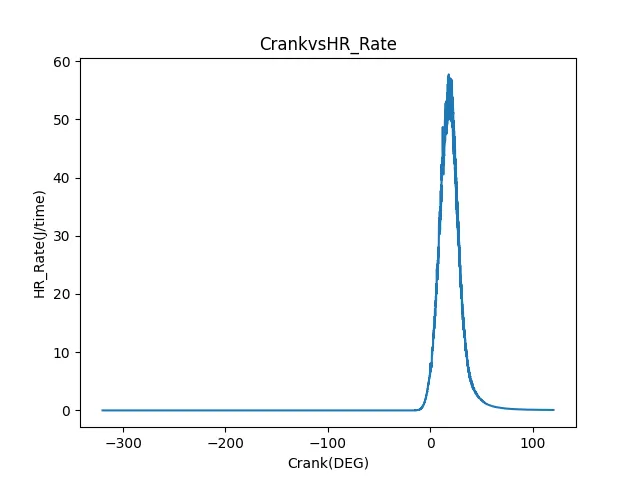
crank Vs HR rate
Description
- read the output converge file as open & read command and display as provided according to file availability
- by using for & if statements split the x and y variable and stored in it this is program by providing specific input of columns to extract in x & y variables
- plot the x & y variable and stored in location
- built basic performance calculations if p & v specified or else command to display information
Result
Data analysis is done from existing output converge data and plot the graph and find the BSFC=143831.25 g/hwh
Reference
https://www.geeksforgeeks.org/data-analysis-with-python/
https://en.wikipedia.org/wiki/Brake-specific_fuel_consumption#:~:text=Brake%2Dspecific%20fuel%20consumption%20(BSFC,divided%20by%20the%20power%20produced.