Week 6 - Data analysis
AIM: Data analysis is a technique by which a set of data can be extracted, organized, transform to predict the future data-driven value or forecast.
PROBLEM: To plot the p-v diagram form 'engine_data.out' file and by trapizoidale rule writing program to calculate area which is work done for the engine.
FORMULAE:
Power: Power(P)= `(2*pi*rpm*W)/(60*1000)` Where, rpm=1500, W=work done=P-V diagram area
Specific Fuel Consumption: = `(mass_(fuel)*3600)/P` where, P=power
P-V Plot and TRAPEZOIDAL RULE: Trapezoidal rule is a numerical method where a large non-regular geometrical area has been divided by small trapezoidal area instead of rectangular area like mesh and then integrate them gives us the approx. closest result of the area.
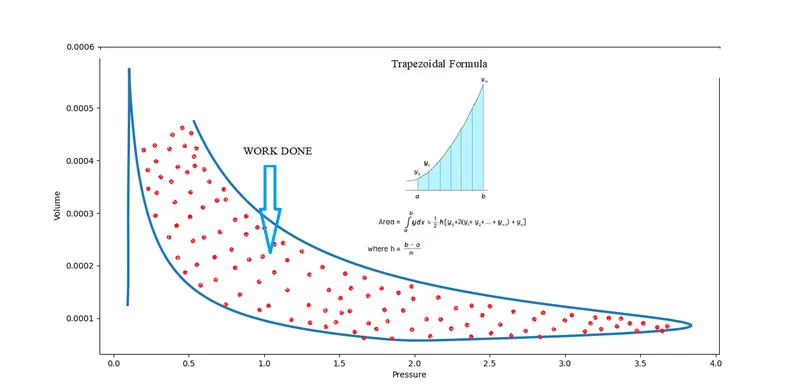
TOOL: Python programming language
import matplotlib.pyplot as plt
import numpy as np
import os.path
from numpy import trapz
import math

"""
Compatibility check
"""
# preliminary check to see if the file is accessible in the directory
if os.path.isfile('engine_data.out'):
    print ("File exists")
else:
    print ("File not exist")

#
filename=input('Enter filename: ')
if filename=='engine_data.out':
	print('This a valid filename')
else:
	print('File name is invalid')
	exit()

# from data table import  parameters
param=['Crank', 'Pressure','Mean Temperature','Volume','Mass','Density','Integrated HR','HR Rate','Cp','Cv','Gamma','Kinematic viscosity','Dynamic viscosity']
dim_units=['Degree','MPa','K','m^3','kg','kg/m^3','J','(J/time)','J/kg-K','J/kg-K','none','m^2/s','N*s/m^2']
num=np.linspace(0,13,14)

# Creating a list of data to plot
for i in range(0, len(param)):
   print(num[i+1],param[i], '=', dim_units[i])


"""
Data visualiser: Part 1
"""

line_count = 1 # line counter

column_x=[]
column_y=[]
title_x=[]
title_y=[]

a=int(input('Enter the desired column index for a plot on the x coordinate: '))
print(a)
b=int(input('Enter the desired column index for a plot on the y coordinate: '))
print(b)

# file parsing starts here
for line in open('engine_data.out'):

	if '#' not in line:
		# adds the floated array into the new array called crank array
		column_x.append(float(line.split()[a]))
		column_y.append(float(line.split()[b]))

	else:
		if line_count is 3:
			# when split the data using the split comand we tend to get the data in form of an array
			#print(line.split())
			# Below line adds the floated array into the new array called crank array
			title_x.append(line.split()[a+1])
			title_y.append(line.split()[b+1])

		line_count = line_count+1

# to check the datatype: 'print(type(title_x))'

# note the brackets and colons while the list is being printed
print(title_x)
print(title_y)

# In these below command we see that the string is printed without paranthesis and colons
print(','.join(title_x))
print(','.join(title_y))

# To create a new variable to print the correct xlabel and ylabel characters
label_x = (','.join(title_x))
label_y = (','.join(title_y))

plt.plot(column_x, column_y, linewidth = 3)
plt.xlabel(label_x)
plt.ylabel(label_y)
plt.show()


"""
Basic performance calculation:(PV diagram)
"""
if a==7 and b==1:

	# here since the work done from the graph, we can equate work donw to torque
	rpm = 1500
	area = np.trapz(column_y, column_x, dx=1.0)
	print('Area = ',area)
	# converting mega pascals to pascals
	area_curve=area*10**6
	# The p-v plot area is equal to tthe work done calculated by trapizoidal rule which is in numpy
	work_done = area_curve
	print(area_curve)
	power=(2*math.pi*rpm*work_done)/(60*1000)
	print('Power in kW = ',power)
	mass_fuel=20*pow(10, -6)
	specific_fuel_consumption=(mass_fuel/power)*3600
	print('Specific fuel consumption in g/(kW*hr)',specific_fuel_consumption)