Week 6 - Data analysis
Aim : Data analysis in Python
Objective : To write and plot the graph to analysic the given data
Solution :
formula
Area under the P-V curve = Work done per cycle - T
Output Power P = Work done * speed
assume 4-stroke engine
P = T*(N/2*60*1000) kW
Mass flow(F)= f*(N/120)*1e-6 [g/s]
Brake Specific Fuel Consumption (BSFC) = F/P
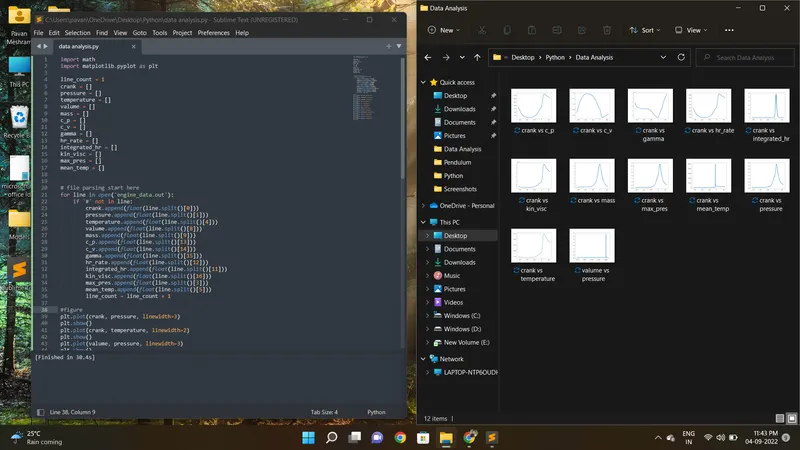
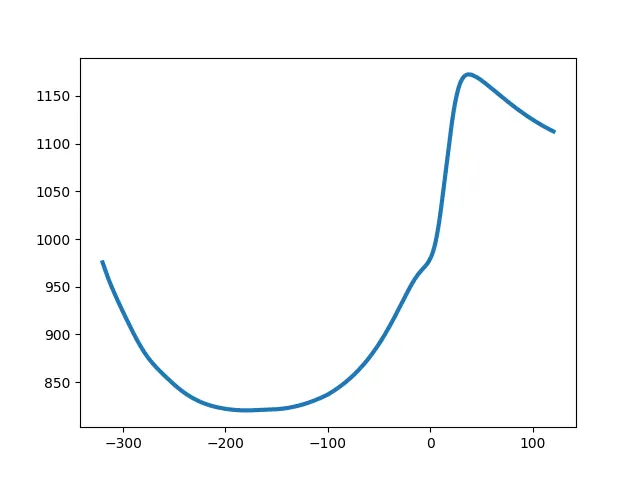
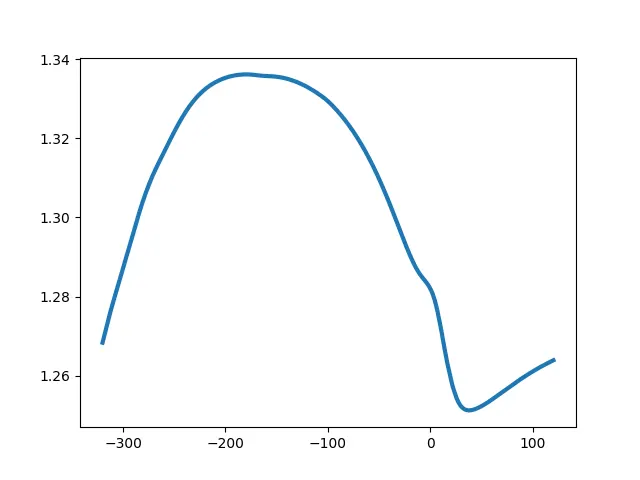
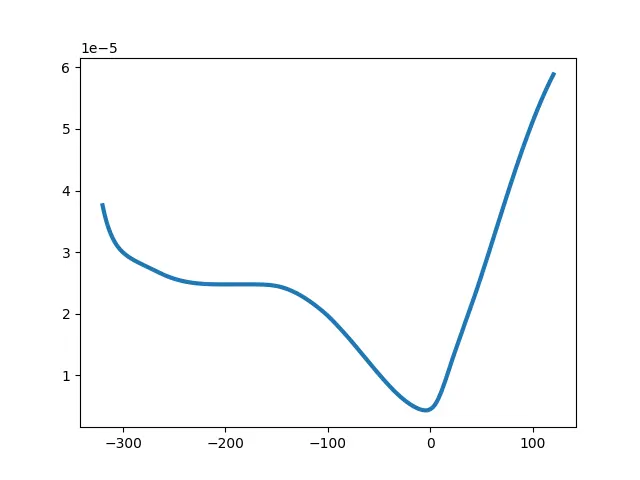
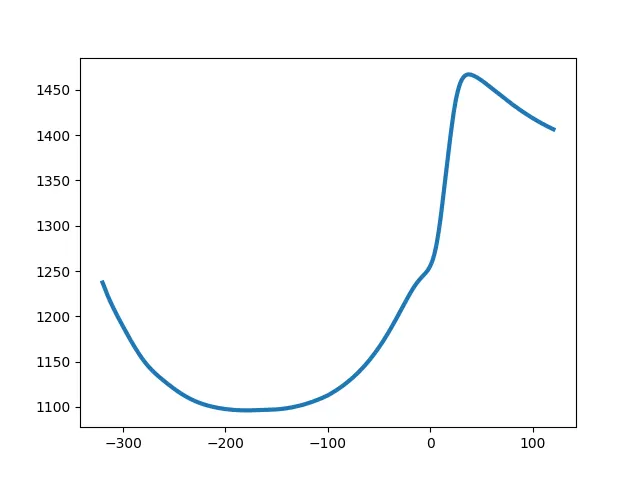
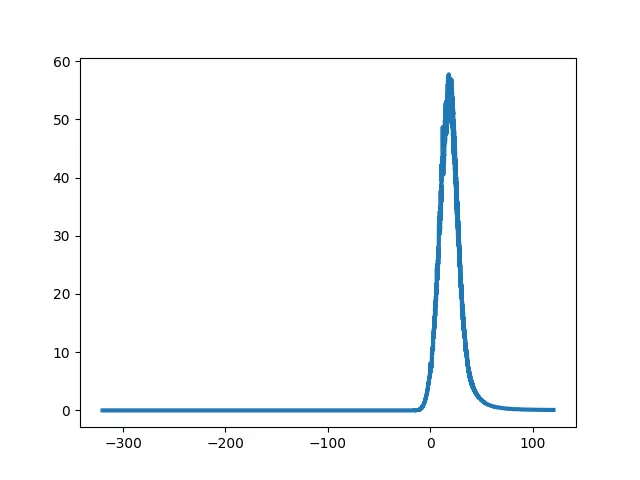
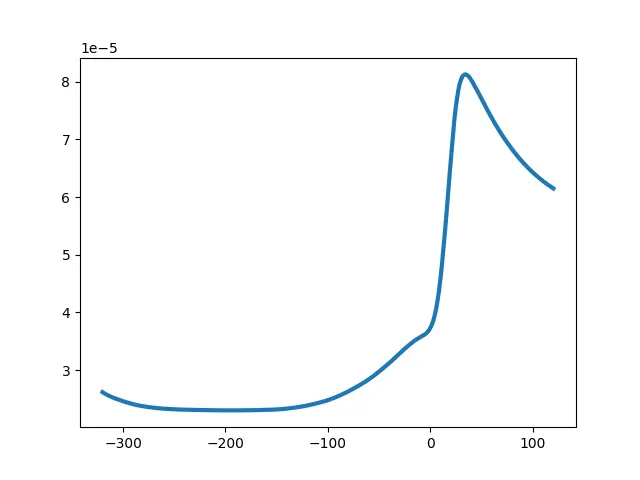
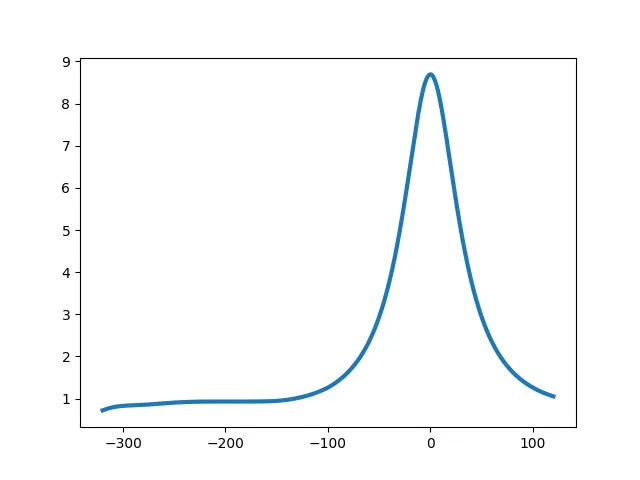
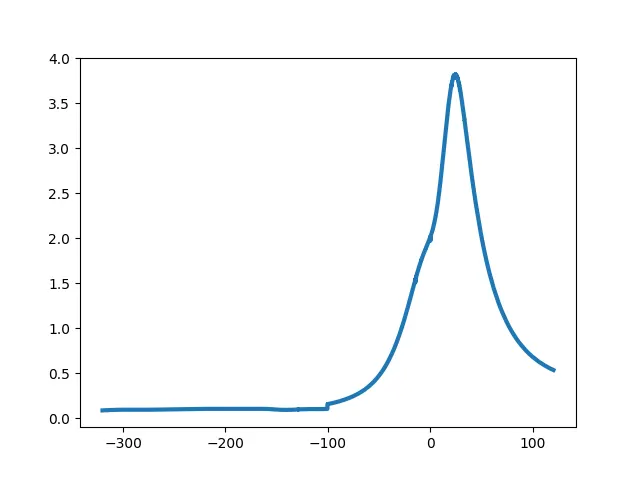
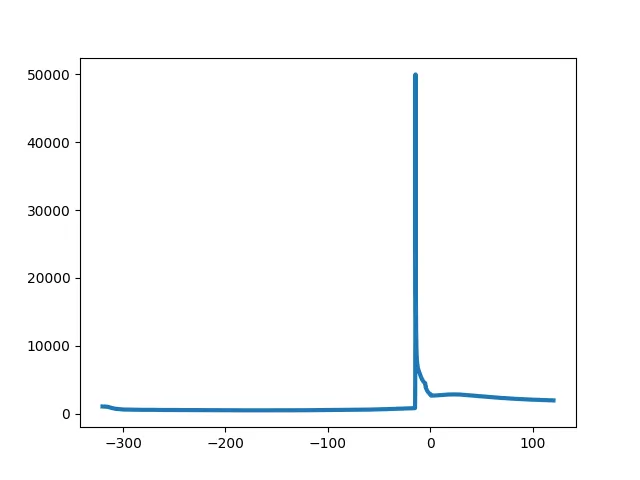
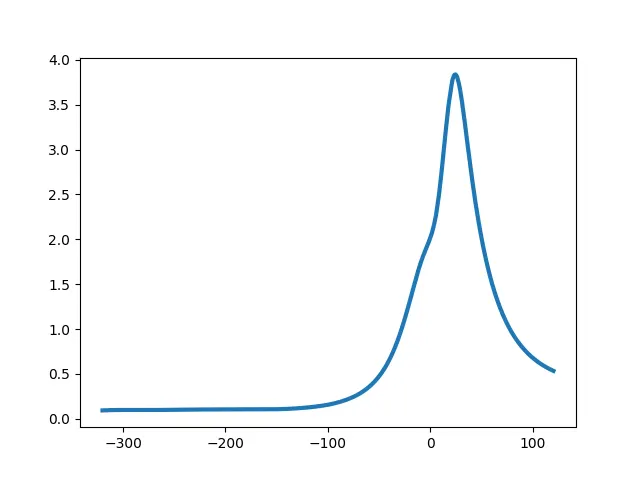
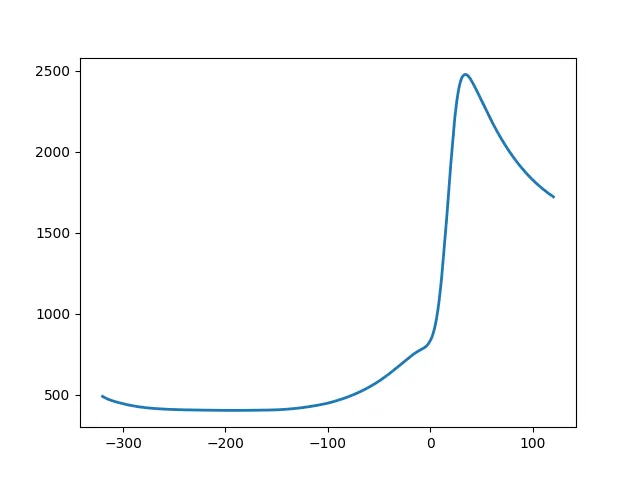
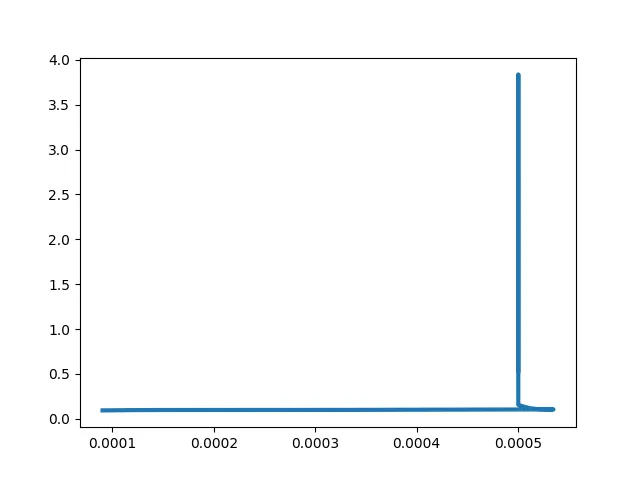
All curve attach in file
Conclusion:
- This program is the handling of various types of data.
- It is possible to add more of the performance calculations and further automate the analysis procedure.
- This program can also be used simply to visualies.