Week 6 - Data analysis
Objective:
1. To parse the data from a file provided.
2. To calculate the area under the curve of Pressure vs Volume.
3. To calculate the engine's power output and specific fuel consumption.
Process:
The area under the curve is calculated using the Trapezoidal rule.
work_done = area under the curve of Pressure vs Volume
power = work_done * rpm/120
specific fuel consumption = fuel per second/power
fuel per second = fuel/stroke
The following code takes the value inputs from the user and provides the appropriate results as per the inputs provided.
#import modules
import numpy as np
import matplotlib.pyplot as plt
import math
import os

#checking data compatability
try:
	with open('engine_data.out') as file:
		read_data = file.read()
except:
	print('File doesn''t exist. Please provide the correct file to parse')
	exit()
#initialisation of parameters
header_count = 0
line_count = 0

column_name = []

#getting column names from file

for line in open('engine_data.out', 'r'):
	if '#' in line:
		header_count = header_count + 1
		if header_count ==3:
			col = line.split()
			for i in range(0, len(col)):
				column_name.append(col[i])
				column_num = i
	else:
		line_count = line_count + 1
		columns = len(line.split())
#getting values into parameters array created above
values = np.zeros((line_count, columns))
row = 0

for line in open('engine_data.out', 'r'):
	if '#' not in line:
		column = 0
		value = line.split()
		while column < columns:
			values[row, column] = value[column]
			column = column +1
		row = row+1
#plotting each and every column and saving separately
col_num = 1
while col_num <= columns:
	plt.plot(values[:, col_num-1])
	plt.ylabel(column_name[col_num])
	plt.title(column_name[col_num])
	plt.savefig(column_name[col_num] + '.png')
	plt.figure()
	plt.grid()
	col_num = col_num + 1
x_value = int(input('Enter the column no. to plot on x-axis'))
y_value = int(input('Enter the column no. to plot on y-axis'))
print('The parameters chosen on x-axis:	' + column_name[x_value] + '	and Y-axis:	' + column_name[y_value])

#plotting chosen parameters:
plt.grid()
x_values = values[:, x_value-1]
y_values = values[:, y_value-1]
plt.plot(x_values, y_values)
plt.xlabel(column_name[x_value])
plt.ylabel(column_name[y_value])
plt.title(column_name[x_value] + 'vs' + column_name[y_value])
plt.savefig(column_name[x_value] + 'vs' + column_name[y_value])

#calculation of paramteres if user choses volume and pressure parameters
if x_value == 8 and y_value==2:
	work_done = abs(np.trapz(x_values, y_values))
	rpm = 1500
	work_stroke_sec = rpm/120
	power = work_done*work_stroke_sec
	fuel_stroke = 20*1e-6
	f_sec = fuel_stroke *rpm*60
	sfc = f_sec/(power*1e+03)
	print('Area under P-V diagram:	', work_done, 'MJ')
	print('Power:	', power, 'kW')
	print('specific fuel consumption for 20 micrograms of fuel:	', sfc, 'gram/kWh')
else:
	pass
Results:
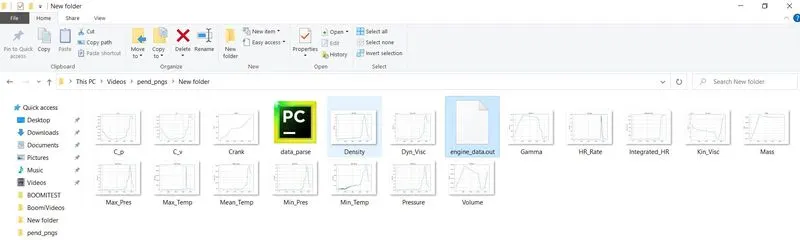
The above figure contains the saved plots generated using the code and taking column numbers as input.
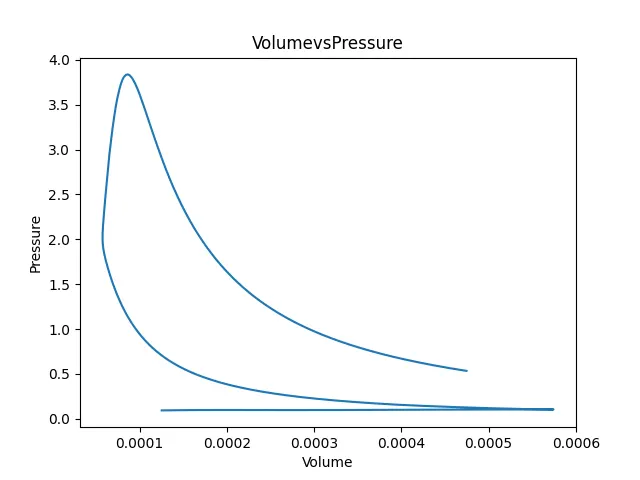
The above plot is generated by taking the input as 8 and 2 (column numbers in the data provided).

The above figure contains the area under the curve, power output of engine and specific fuel consumption results after taking input from the user for pressure and volume columns.