Week 6 - Data analysis
Code :
import math
import matplotlib.pyplot as plt
import numpy as np
from scipy.integrate import simps
from numpy import trapz


#Taking inputs from user
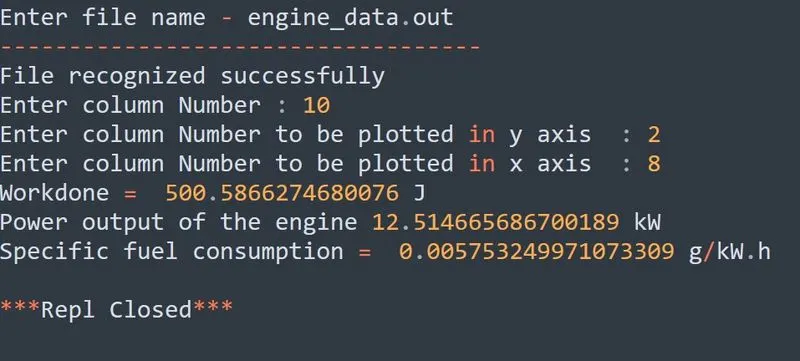
file_name = input("Enter file name - ")
print('-----------------------------------')

#Checking the file
if file_name == 'engine_data.out':
	print("File recognized successfully")
else:
	print("File not recognized, Please give the valid output file")
	exit()

Crank = []
Pressure = []
Max_Pres =[]
Min_Pres = []
Mean_Temp = []
Max_Temp = []
Min_Temp = []
Volume = []
Mass = []
Density = []
Integrated_HR = []
HR_Rate = []
C_p = []
C_v = []
Gamma = []
Kin_Visc = []
Dyn_Visc =[]

#Extracting datas
for line in open(file_name):
	if '#' not in line:
		Crank.append(float(line.split()[0]))
		Pressure.append(float(line.split()[1]))
		Max_Pres.append(float(line.split()[2]))
		Min_Pres.append(float(line.split()[3]))
		Mean_Temp.append(float(line.split()[4]))
		Max_Temp.append(float(line.split()[5]))
		Min_Temp.append(float(line.split()[6]))
		Volume.append(float(line.split()[7]))
		Mass.append(float(line.split()[8]))
		Density.append(float(line.split()[9]))
		Integrated_HR.append(float(line.split()[10]))
		HR_Rate.append(float(line.split()[11]))
		C_p.append(float(line.split()[12]))
		C_v.append(float(line.split()[13]))
		Gamma.append(float(line.split()[14]))
		Kin_Visc.append(float(line.split()[15]))
		Dyn_Visc.append(float(line.split()[16]))


#Storing all datas in a list
columns = (Crank,Pressure,Max_Pres,Min_Pres,Mean_Temp,Max_Temp,Min_Temp,Volume,Mass,Density,Integrated_HR,HR_Rate,C_p,C_v,Gamma,Kin_Visc,Dyn_Visc)

#extracting name of the columns
line_count = 1
for line in open('engine_data.out'):
	if line_count is 3:
		names = line.split()
	line_count = line_count+1


#getting column number from user for plotting individual column
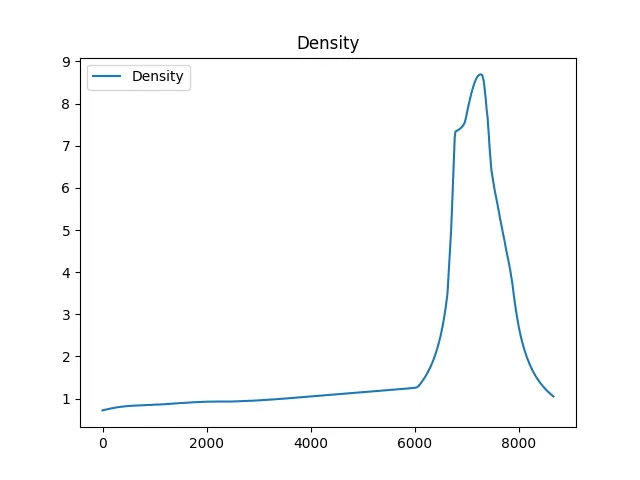
c_input = input("Enter column Number : ")
column = int(c_input)
filename = names[column]+'.png'
plt.title(names[column])
plt.plot(columns[column-1],label=names[column])
plt.legend()
plt.savefig(filename)
plt.show()

#Getting column numbers from user for plotting graph

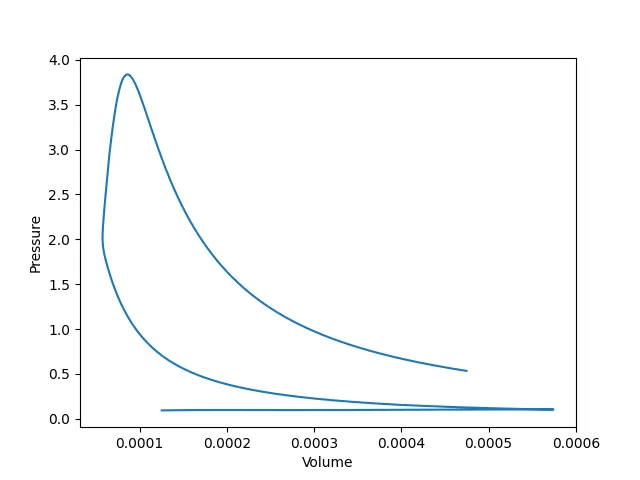
c_input1 = input("Enter column Number to be plotted in y axis  : ")
yaxis = int(c_input1)
c_input2 = input("Enter column Number to be plotted in x axis  : ")
xaxis = int(c_input2)

plt.plot(columns[xaxis-1],columns[yaxis-1])
plt.xlabel(names[xaxis])
plt.ylabel(names[yaxis])
plt.savefig(names[xaxis]+'Vs'+names[yaxis]+'.png')
plt.show()

#calculations

x = columns[1]
y = columns[7]

#changing to pascal
P = 1000000*np.array(x)
V = np.array(y)

#area under the curve
area = np.trapz(P,V)
print('Workdone = ',area,'J')

#Calculating Power
power = (area*(1500/60))/1000
print("Power output of the engine",power,'kW')

#Calculating Specific fuel consumption
sfc = 20*pow(10,-6)*3600/power
print('Specific fuel consumption = ',sfc, 'g/kW.h')
Plot:
User Input and Output: