Project 1 - Parsing NASA thermodynamic data
File Parsing Code:
clear all
close all
clc

f1 = fopen('THERMO.dat','r')
for i = 1:5
    fgetl(f1);
end

for j = 1:53
    %Extracting Species name & Temperature values
    l1 = fgetl(f1);
    line1 = strsplit(l1,' ');
    species1 = line1{1};
    low_temp = str2num(line1{length(line1)-3});
    high_temp = str2num(line1{length(line1)-2});
    mid_temp = str2num(line1{length(line1)-1});


    %Extracting Line7 constants
    l2 = fgetl(f1);
    lf2 = findstr(l2,'E');

    a1 = str2num(l2(1:lf2(1)+3));
    a2 = str2num(l2(lf2(1)+4:lf2(2)+3));
    a3 = str2num(l2(lf2(2)+4:lf2(3)+3));
    a4 = str2num(l2(lf2(3)+4:lf2(4)+3));
    a5 = str2num(l2(lf2(4)+4:lf2(5)+3));

    %Extracting Line8 constants
    l3 = fgetl(f1);
    lf3 = findstr(l3,'E');

    a6 = str2num(l3(1:lf3(1)+3));
    a7 = str2num(l3(lf3(1)+4:lf3(2)+3));
    a8 = str2num(l3(lf3(2)+4:lf3(3)+3));
    a9 = str2num(l3(lf3(3)+4:lf3(4)+3));
    a10 = str2num(l3(lf3(4)+4:lf3(5)+3));


    %Extracting Line9 constants
    l4 = fgetl(f1);
    lf4 = findstr(l4,'E');

    a11 = str2num(l4(1:lf4(1)+3));
    a12 = str2num(l4(lf4(1)+4:lf4(2)+3));
    a13 = str2num(l4(lf4(2)+4:lf4(3)+3));
    a14 = str2num(l4(lf4(3)+4:lf4(4)+3));

    %Calculation

    t1 = linspace(low_temp,mid_temp,100);
    t2 = linspace(mid_temp,high_temp,100);
    t = [t1 t2];

    cp1 = 8.3145*(a1 + a2*t1 + a3*t1.^2 + a4*t1.^3 + a5*t1.^4);
    h1 = (a1 + (a2*t1)/2 + (a3*t1.^2)/3 + (a4*t1.^3)/4 + (a5*t1.^4)/5 + a6./t1).*(8.3145*t1);
    s1 = 8.3145*(a1*log(t1) + a2*t1 + a3*t1.^2/2 + a4*t1.^3/3 + a5*t1.^4/4 + a7);


    cp2 = 8.3145*(a8 + a9*t2 + a10*t2.^2 + a11*t2.^3 + a12*t2.^4);
    h2 = (8.3145*t2).*(a8 + a9*t2/2 + a10*t2.^2/3 + a11*t2.^3/4 + a12*t2.^4/5 + a13./t2);
    s2 =  8.3145*(a8*log(t2) + a9*t2 + a10*t2.^2/2 + a11*t2.^3/3 + a12*t2.^4/4 + a14);


    x = species1;
    ele = ['C','N','H','O','A'];
    at_wt = [12.02,14.01,1.008,16.00,39.948];

    m_wt = 0;
    for s = 1:length(x)
        for k=1:length(ele)
            if strcmpi(x(s),ele(k))
                m_wt = m_wt + at_wt(k);
                pos = k;
            end
        end
        num = str2num(x(s));
        if(num)
            m_wt = m_wt + (at_wt(pos)*(num-1));
        end
    end


    mkdir(['C:\Users\Manoj R\Desktop\Species\',species1])

    %Plotting

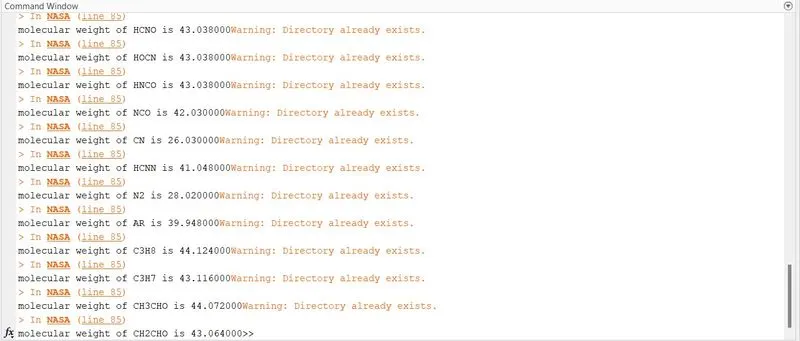
    fprintf('molecular weight of %s is %f' ,species1,m_wt)

    figure(1)
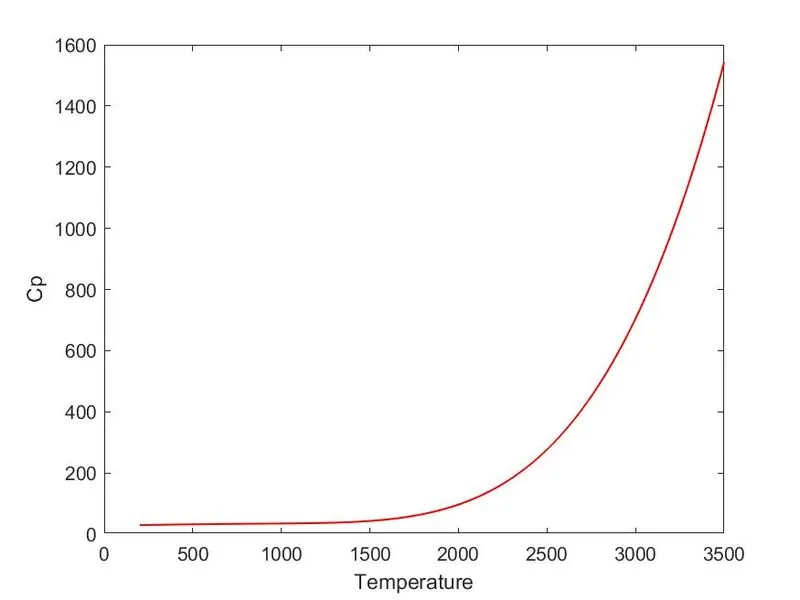
    cp = [cp1 cp2];
    plot(t,cp,'linewidth',1,'color','r')
    xlabel('Temperature')
    ylabel('Cp')

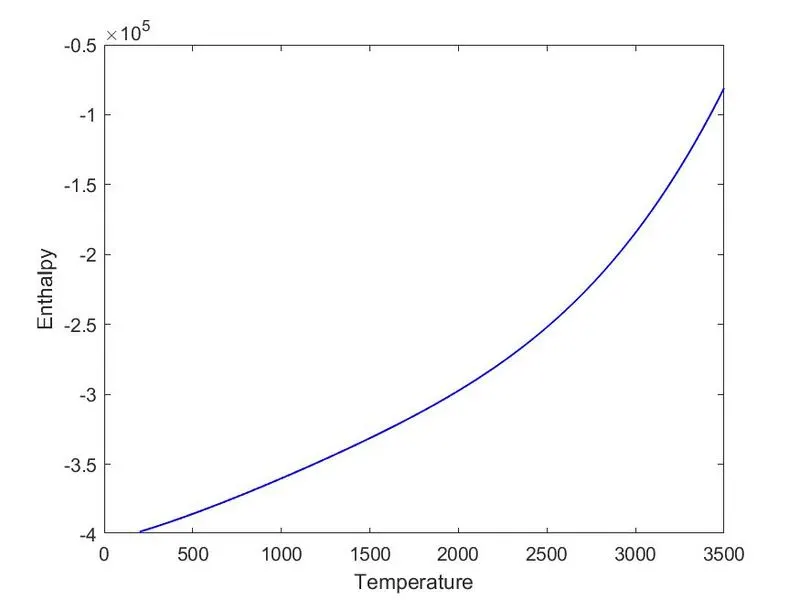
    figure(2)
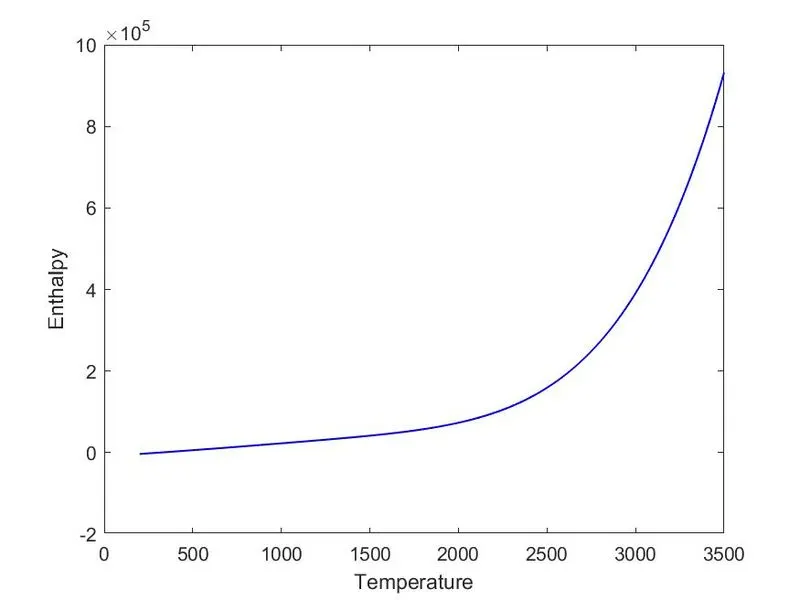
    h = [h1 h2];
    plot(t,h,'linewidth',1,'color','b')
    xlabel('Temperature')
    ylabel('Enthalpy')


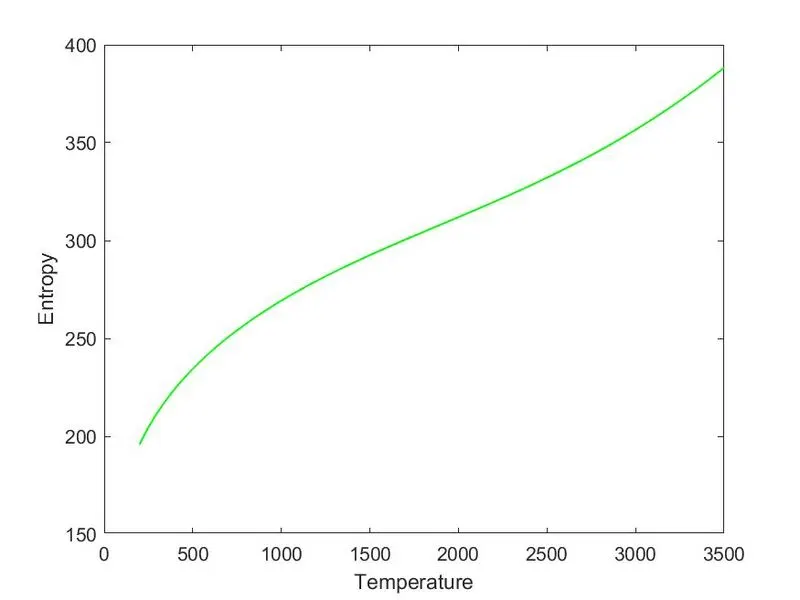
    figure(3)
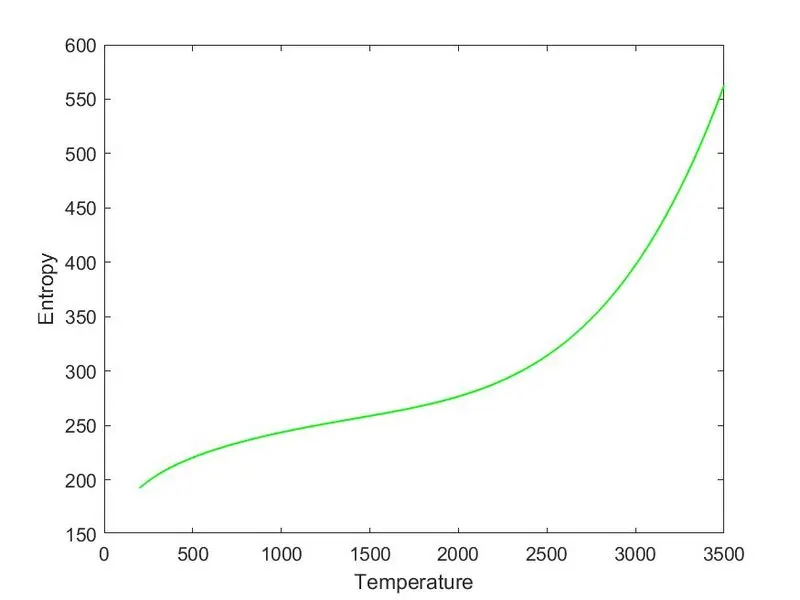
    s = [s1 s2];
    plot(t,s,'linewidth',1,'color','g')
    xlabel('Temperature')
    ylabel('Entropy')

    cd(['C:\Users\Manoj R\Desktop\Species\',species1])

    saveas(1,'cpvst','jpg')
    saveas(2,'hvst','jpg')
    saveas(3,'svst','jpg')

end
Plots for O2
Plots for N2
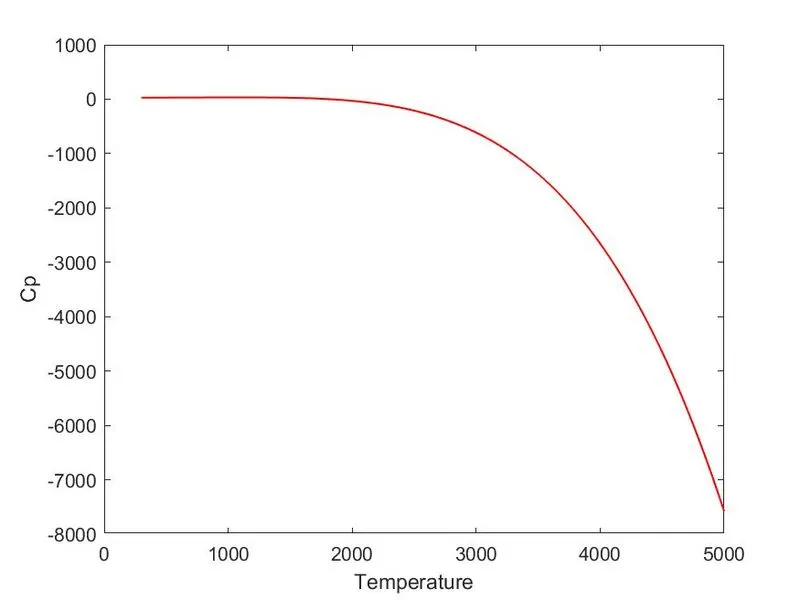
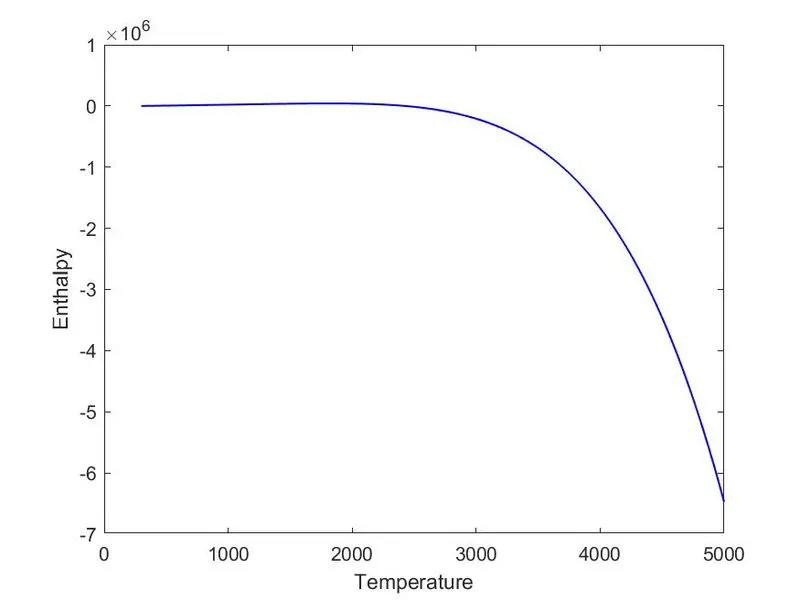
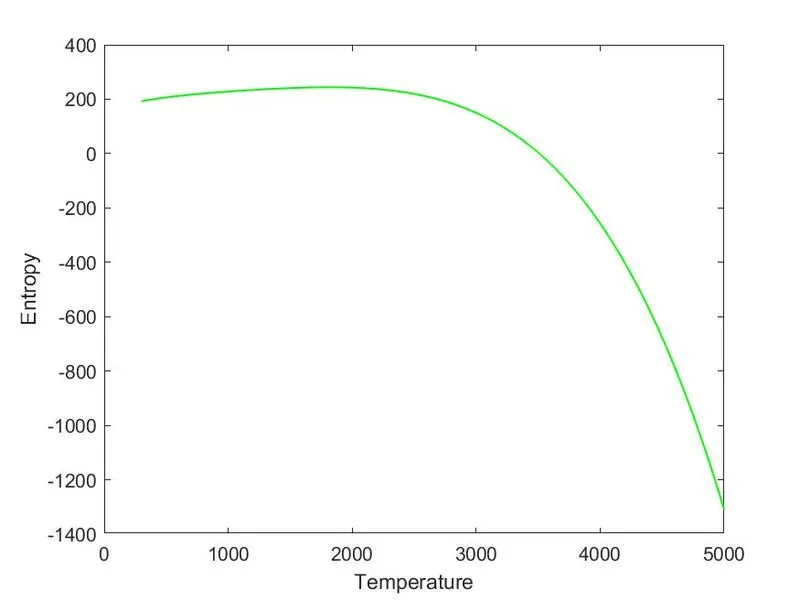
Plots for CO2
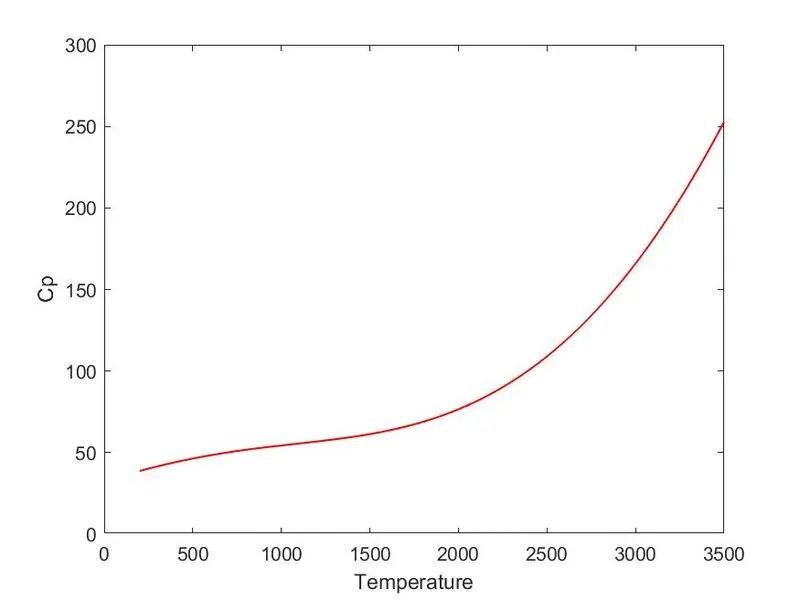
Molecular Weight output