Week 6 - Data analysis
DATA ANALYSIS
OBJECTIVE:
- Read data from file.
- Checking for file compatibility
- Plotting data column wise and saving them using file header
- Plotting data from one column against data from another, labelling them using header data
- Calculating area under a curve (pv diagram)
- Calculating power output of the engine using the area
- Calculating Specific Fuel consumption
Compatability check:
- You code should exit gracefully, if a non-compatible file is provided as an input. It should say something like "File not recognized. Please provide a valid CONVERGE output file"
Basic performance calculation:
- Calculate the area under the P-V diagram. P is in column 2 and V is in column 8.
- Calculate the power output of this engine. Assume that RPM is 1500
- This engine consumed 20 micro grams of fuel (per 1 stroke cycle). Calculate its specific fuel consumption.
CODE EXPLANATION:
- Importing useful modules from different libraries.
- Printing General Instructions and then asking for input a CONVERGE file from User.
- In compatability check, if CONVERGE file exists at specified directory then it will show 'Data file is Succesfully opened.'
- If a non-compatible file is provided as an input. It would say something like "Please Enter a valid filename." & the code should exit gracefully.
- Here, line_count is for counting a lines of CONVERGE data file.
- In third line, spliting a different parameters of CONVERGE data file.
- Splitting of line is identified by ' '. --> [Delimiter(Blank Space)] That's why it has total 18 columns but first column '#' has no data. After neglecting first column in consideration, it has total 17 columns that contains useful data.
- In fourth line, splitting an Units of different parameters.
- Printing different parameters with their respective units.
- Getting an input from the user. Here, X-axis parameter is independent variable and Y-axis parameter is dependent variable. This terminology is used for data visualization.
- Defining an empty array x_data & y_data.
- In third line, splitting a different parameters and then assigning into X_label & Y_label w.r.t. given input.(For title of Plot)
- Then splitting a different parameters plus their respective units. And, putting them into x_label & y_label w.r.t. given input.
- If '#' is not in a line then extracting all that data in float form & appending into x_data & y_data w.r.t. given input.
- Assigning a title,xlabel,ylabel & filename to a plot w.r.t. given input.And,saving it in a predefined directory.
- If X=8 & Y=2 then calculating area under the curve of P-V diagram using "trapz" from "numpy".And,Defining workdone in KJ, Power in KW & Specific Fuel Consumption in g/KWh by using respective formulas.
- And, all these done automatically.
CODING:
#Importing libraries
import matplotlib.pyplot as graph
import numpy as np
from numpy import trapz as trp

#Compatability check
try:
 f=open('engine_data.out','r')
except FileNotFoundError:
 print('File not recognized. Please provide a valid CONVERGE output file!')
 sys.exit()

#input
file = 'engine_data.out'
count = 0
count_header = 0
column_title = []
column_units = []
for line in open(file,'r'):
    if '#' not in line:
        count = count + 1
        columns = len(str.split(line))
    else:
        count_header = count_header +1
        if count_header == 3:
            line_content = str.split(line)
            for i in range(0,len(line_content)):
                column_title.append(line_content[i])
        elif count_header == 4:
            line_content = str.split(line)
            for i in range(0,len(line_content)):
                column_units.append(line_content[i])

if (count_header < 4 or count < 1 or columns < 8):
    print('Invalid data file')
else:
    data = np.zeros((count,columns,1))
    row = 0
    for line in open(file,'r'):
        if '#' not in line:
            column = 0
            data_line = str.split(line)
            while (column < columns):
                data[row,column] = float(data_line[column])
                column = column + 1
            row = row + 1
    column_number = 1
    while (column_number <= columns):
        graph.plot(data[:,column_number-1])
        graph.ylabel(column_title[column_number]+column_units[column_number])
        graph.savefig(column_title[column_number]+'.png')
        graph.figure()
        column_number = column_number + 1

    x_column_number = 8
    y_column_number = 2
    x_data = np.array(data[:,x_column_number-1])
    y_data = np.array(data[:,y_column_number-1])
    graph.plot(x_data,y_data)
    graph.xlabel(column_title[x_column_number]+column_units[x_column_number])
    graph.ylabel(column_title[y_column_number]+column_units[y_column_number])
    graph.savefig(column_title[y_column_number]+' VS '+column_title[x_column_number]+'.png')

    area = trp(y = y_data.transpose(), x = x_data.transpose())
    print('Area under pv diagram:',area,'(MJ)')

    #Power in kw = Nm * RPM / 9550
    RPM = 1500
    power = area * 1e+06*RPM/(9550)
    print('Power:',power,'(kw)')
    fuel_per_stroke = 20*1e-06
    fuel_per_sec = fuel_per_stroke*RPM*60
    Spec_fuel_cons = fuel_per_sec/ (power * 1e+03)
    print('Specific Fuel Consumption:',Spec_fuel_cons,'(g/J)')
OUTPUT:
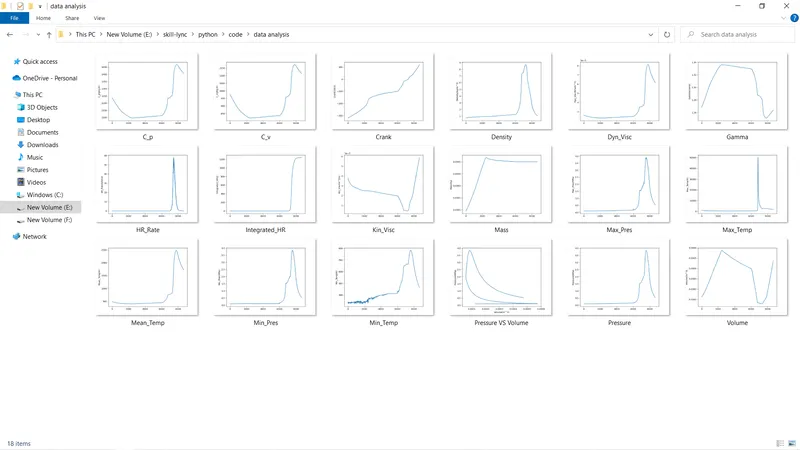
Area under pv diagram: [0.00050059] (MJ)
Power: [78.62617185] (kw)
Specific Fuel Consumption: [2.28931405e-05] (g/J)
CONCLUSION:
- Code is written to create the visualizer tool using PYTHON which will extract data from a converge output file which Generate plot as per the user preference.
- And also calculate the area under the P-V diagram, power output of this engine and Specific fuel consumption.
https://drive.google.com/drive/folders/15JbtmH9WWbPmL59mJbih6r9YSM0tplua