Week 6 - Data analysis
AIM:
write a code fot the provided data output file as a challenge parsing data analysis.
PROCEDURE:
1. importing math, mathplotlib , numpy , scipy for trapz
2. try option used to check and analys the compatibility of data file
try:
file = open('engine_data.out')
line_count = 1
3. when the file is not recognized , provide the converge output file
4. creating of the empty array for pressure and volume in the data file is present in column 2 and 8 respectively
pressure = []
volume = []
5.then coding for it
for line in open('engine_data.out'):
if '#' not in line:
pressure.append(float(line.split()[P-1]))
volume.append(float(line.split()[V-1]))
line_count = line_count + 1
6. making the p-v plot by,
plt.plot (volume,pressure,linewidth=3)
plt.xlabel('Volume')
plt.ylabel('Pressure')
plt.title('P-V Diagram')
plt.show()
7. the input values are ,
speed of engine, rpm = 1500
rps = 1500/60
stroke cycle ,stroke_cycle = rps/2
fuel_consumption , fuel_con = 20
no. of cylinder , n = 1
8.for calculating the area under the p-v diagram,
area = np.trapz(pressure,volume)
9.for calculating the power output of engine,
power_output = n*area*stroke_cycle/(1000)
10.for calculating the specific fuel consumption,
sfc = (fuel_con*pow(10,-6)*stroke_cycle*3600)/(power_output*1000)
11. transposing coulmns nto raw matrix and converting them into float type from string type,
transpose = np.transpose(data)
float_f = transpose.astype(np.float)
12. for making the other graphs,
- creating array for parameters
- too chice any two parameter for plotting
print('choose any two from the following options')
print(' 1 crank n 2 pressure n 3 maximum_pressure n 4 minimum_pressure n 5 mean_temperature n 6 maximum_temperature n 7 minimum_temperatue n 8 volume n 9 mass n 10 densisty n 11 integrated_HR n 12 HR_rate n 13 Cp n 14 Cv n 15 gamma n 16 kinematic_viscosity n 17 dynamic_viscosity')
- the parameter can add in by,
X = int(input('enter your choice on X_axis n'))
Y = int(input('enter your choice on Y_axis n'))
12. making the plot by other 2 parameters is,
plt.figure()
plt.plot(float_f [x-1] , float_f [y-1],linewidth= 3,colour='red')
plt.title('plot for' + parameters [x-1] + 'vs' + parameter[y-1])
plt.xlabel(parameter [x-1] )
plt.ylabel(parameter [y-1] )
plt.savefig(parameter[x-1] + 'vs' + parameter[y-1])
plt.show()
RESULT:
p-v diagram
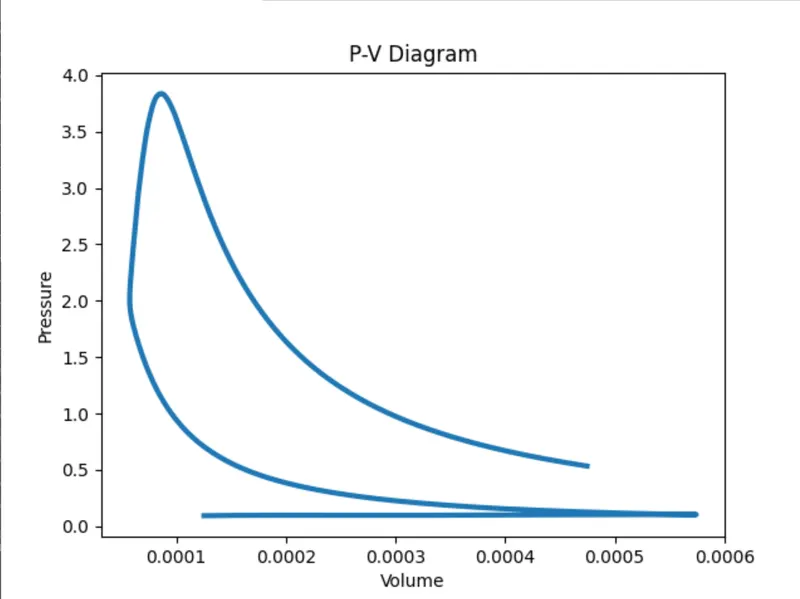
area under the curve = 0.0005005866274680075units
power outut from engine = 6.257332843350094e-06KW
specific fuel consuption, SFC = 143.83124927683275(kg/hr)/(KW)

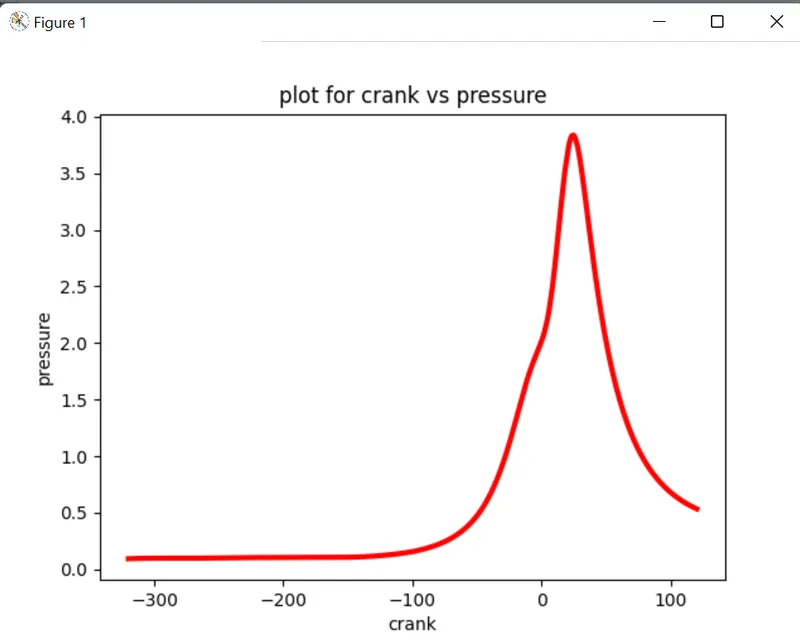
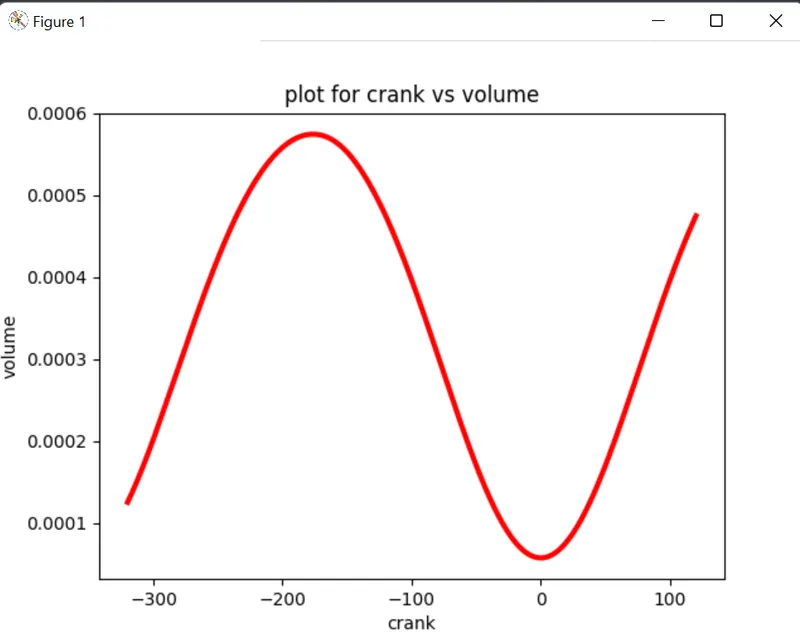
for other plots are,
crank vs pressure
crank vs volume
"""
   program to caculate the  engine parameter to plot
"""

import math
import matplotlib.pyplot as plt
import numpy as np
from scipy.integrate import simps as simps , trapz as trapz

#file input
file = 'engine_data.out'

#compatibility check
try:
	file = open('engine_data.out')
	line_count = 1

except:
	print('file not recognized. please provide a valid CONVERGE output file')

# creating of the empty array to store the value of pressure and volume
pressure = []
volume = []

#pressure and volume in the data file is present in column 2 and 8 respectively
P = 2
V = 8
# getting a null array and storing all data values of the data file into it
data = []

for line in open('engine_data.out'):
	if '#' not in line:
		pressure.append(float(line.split()[P-1]))
		volume.append(float(line.split()[V-1]))

		line_count = line_count + 1

# plotting p_v diagram
plt.plot (volume,pressure,linewidth=3)
plt.xlabel('Volume')
plt.ylabel('Pressure')
plt.title('P-V Diagram')
plt.show()


# inputs
rpm = 1500
rps = 1500/60
stroke_cycle = rps/2
fuel_con = 20
n = 1

# calculation of area under PV diagram
area = np.trapz(pressure,volume)
print('area under the curve = ' +str(area) +'units')

#calculation of power
power_output = n*area*stroke_cycle/(1000)
print('power outut from engine = ' +str(power_output) +'KW')

#calculation  of sfc
sfc = (fuel_con*pow(10,-6)*stroke_cycle*3600)/(power_output*1000)
print('specific fuel consuption, SFC = ' +str(sfc) + '(kg/hr)/(KW)')

print('------------------------------------------------------')

# transposing coulmns nto raw matrix and converting them into float type from string type
transpose = np.transpose(data)
float_f = transpose.astype(np.float)

# array for parameters
parameters = ['crank' , 'pressure' , 'maximum_pressure' , 'minimum_pressure' , 'mean_temperature' , 'maximum_temperature' , 'minimum_temperature' , 'volume' , 'mass' , 'density' , 'intrgrated_HR' , 'HR_rate' , 'Cp' , 'Cv' , 'gamma' , 'kinematic_viscosity' , 'dynamic_viscosity']

# choice two parameters for plotting
print('choose any two from the following options')
print(' 1 crank n 2 pressure n 3 maximum_pressure n 4 minimum_pressure n 5 mean_temperature n 6 maximum_temperature n 7 minimum_temperatue n 8 volume n 9 mass n 10 densisty n 11 integrated_HR n 12 HR_rate n 13 Cp n 14 Cv n 15 gamma n 16 kinematic_viscosity n 17 dynamic_viscosity')

X = int(input('enter your choice on X_axis n'))
Y = int(input('enter your choice on Y_axis n'))

#plotting other gragh based on your choice
plt.figure()
plt.plot(float_f [x-1] , float_f [y-1],linewidth= 3,colour='red')
plt.title('plot for' + parameters [x-1] + 'vs' + parameter[y-1])
plt.xlabel(parameter [x-1] )
plt.ylabel(parameter [y-1] )
plt.savefig(parameter[x-1] + 'vs' + parameter[y-1])
plt.show()