Data analysis
Data analysis
AIM:
- Take column numbers as the input and plot the respective columns as separate images
- Each file should be saved by the name of the colum
- Label information should automatically be extracted and must appear as labels in the plots
PROGRAM
import matplotlib.pyplot as plt
import numpy as np
from numpy import trapz

fname = input("Enter the filename:  ")

if fname == 'engine_data.out':
	print('file is valid')

else:

	print('file is invalid')

	exit()

def compatibility_check(a):

	if 'CONVERGE' not in a:

		print('please provide converge output file to process')

		exit()

	else:

		print('compatibility check is successful')

		pass

FILE = []


for line in open(fname):

	if '#' in line:

		FILE.append(line.split())

compatibility_check(FILE[0])

noc = len(FILE[1])
head = len(FILE[2])
col_no = []
col_val = []
col_units = []

z = FILE[1].index('column')
for i in range(z,noc-1):

	col_no.append(i)

for j in FILE[2]:

	if j is not '#':

		col_val.append(j)

for k in FILE[3]:

	if k is not '#':

		col_units.append(k)

print('data available are:')

for a in range(1,len(col_no)):

	print(a,col_val[a],col_units[a])

xaxis = int(input('Enter xaxis column no:'))-1
yaxis = int(input('Enter yaxis column no:'))-1

x = []
y = []

for line in open(fname):

	if '#' not in line:

		x.append(float(line.split()[xaxis]))
		y.append(float(line.split()[yaxis]))

plt.plot(x,y,linewidth=1.5)
plt.xlabel(col_val[xaxis])
plt.ylabel(col_val[yaxis])
plt.show()

pressure = []
vol = []

for line in open(fname):
	if '#' not in line:

		pressure.append(float(line.split()[1]))
		vol.append(float(line.split()[7]))

Pressure = 1e6*np.array(pressure)
Volume = np.array(vol)
area = np.trapz(Pressure,Volume)
print('workdone =',area, 'joules')
cyclepersec = 750/60
power = area*(cyclepersec/1000)
print('power=',power,'kw')
mass_flow = 20e-6
sfc = mass_flow*3600/power
print('specific fuel consumption =',sfc,'g/kwh')
RESULTS
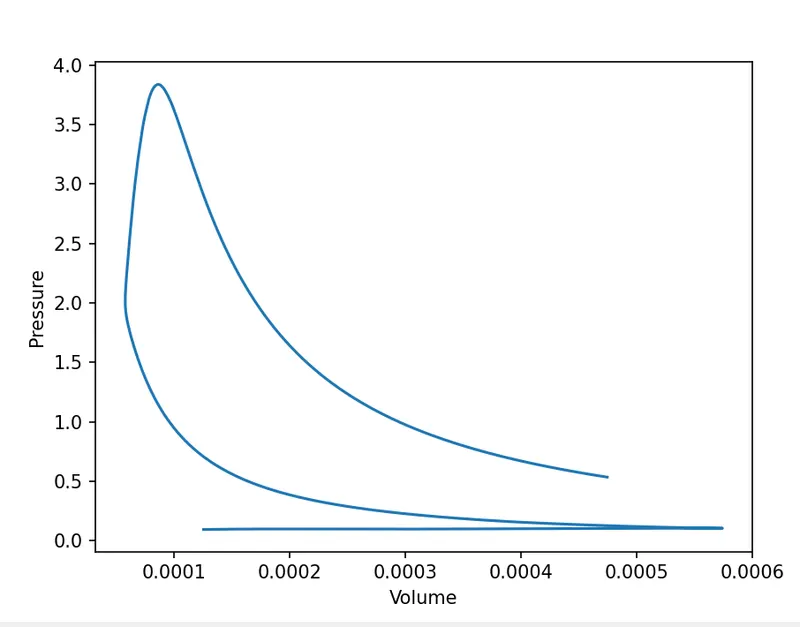
workdone = 500.5866274680076 joules
power= 6.257332843350095 kw
specific fuel consumption = 0.011506499942146618 g/kwh