Week 6 - Data analysis
Objective: To read the data from the file provided and perform some calculations and also to plot the graphs between different parameter.
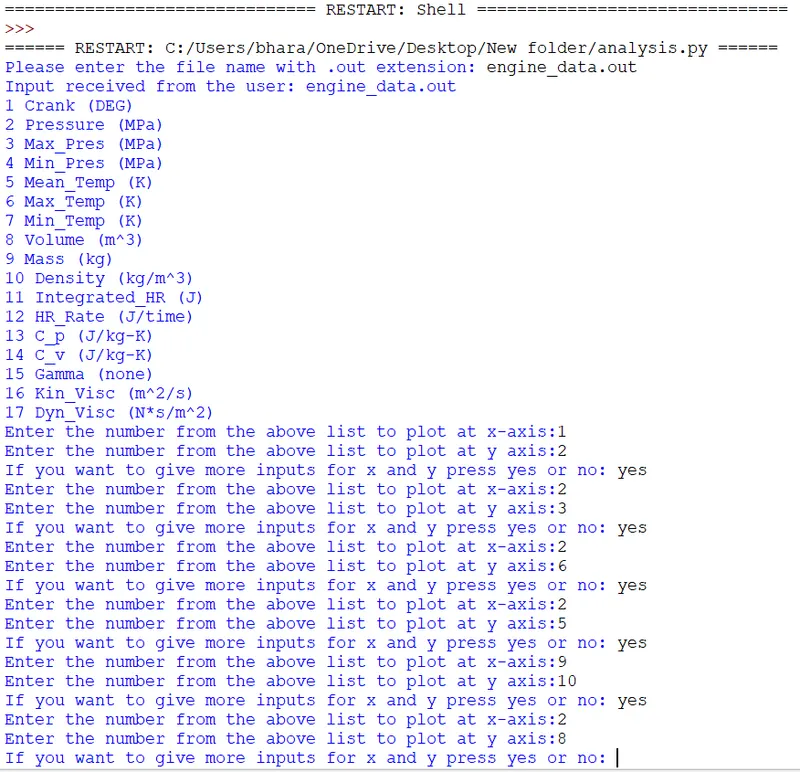
Concept: The concept is to read the data file(engine_data.out) provided. Actually, the data file name with extension is taken from the user and then the data file is read. Then the parameters present in the data file is printed with the numbers. The user is asked to enter the parameters for which the plot is to be obtained. Then Basic performance calculations are calculated but not manually.
Formulae:
- `w=(Area)*100`
- `power=2* π*RPM* w/60`
- Fuel consumption(F)`=20*(1e-6)*RPM* (0.5 )/60`
- `BSFC=(F/P)*3600`
Procedure:
- Importing the required libraries.
- Accepting data only with ".out" extension from the user input
- Validating that the input given by the user is correct or not by using try and except () method.
- Reading the data file.
- Print all the parameters name so that the user can choose to plot the graph between them.
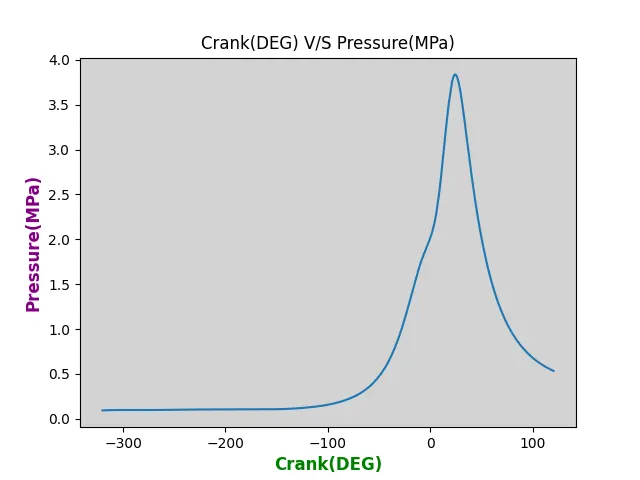
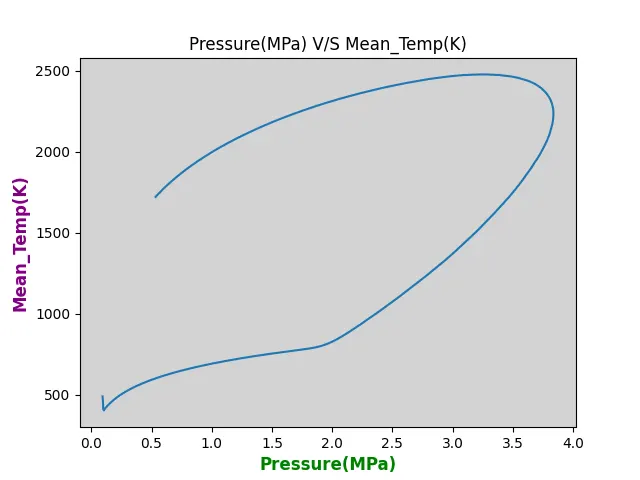
- Plotting results on graph depending upon user input
- Basic performance calculations can be done only when the user input is "pressure and volume". So, "if" condition is used.
Python Code:
import matplotlib.pyplot as plt
import numpy as np
import math
#accepts files only with ".out" extension
try:
    var1 = input("Please enter the file name with .out extension: ")
    print("Input received from the user:",var1)
except FileNotFoundError:
    print("File not recognized. Please provide a valid CONVERGE output file")
#reading the data from the datafile
file_object = open(var1,'r')
name=[]
units=[]
crank=[]
line_count = 1
#to print parameters present inside the data file
for i in file_object:
    crank.append(i)
    if len(crank)==5:
        a=crank[2]
        b=crank[3]
        a=a.split()
        b=b.split()
        c=0
        a.pop(0)
        for i in a:
            c=c+1
            name.append(i)
            units.append(b[c])
            print(str(c)+" "+i+" "+b[c])
def value(var2,var3):
    x_data = []
    y_data = []
    file_object = open(var1,'r')
    for line in file_object:
        if '#' not in line:
            x_data.append(float(line.split()[var2-1])) #storing value of different parameters
            y_data.append(float(line.split()[var3-1]))

    #plotting results
    ax=plt.axes()
    ax.set_facecolor('lightgrey')
    plt.figure(1)
    plt.xlabel(name[var2-1]+units[var2-1],color='green',fontsize='large',fontweight='bold')
    plt.ylabel(name[var3-1]+units[var3-1],color='purple',fontsize='large',fontweight='bold')
    plt.title(name[var2-1]+units[var2-1] + ' V/S '+ name[var3-1]+units[var3-1])
    plt.plot(x_data,y_data)
    plt.show()
    #basic performance calculations
    if (var2==8 and var3==2):
        rpm=1500
        area=np.trapz(y_data,x_data) #IN MJ
        print("area =",area,"MJ")
        Workdone=area*1000 #IN KJ
        print("wordone =",Workdone,"KJ")
        Power = 2*math.pi*rpm*Workdone/60 #IN KW
        print("power =",Power,"KW")
        Fuelconsumption = (20*(1e-6))*rpm*(0.5/60) #IN GRAMS PER HOUR
        BSFC = ((Fuelconsumption)/(Power))*3600
        print("BSFC = ",BSFC,"g/KWhr")

loop='yes'
while loop=='yes':
    g = int(input("Enter the number from the above list to plot at x-axis:")) #TAKING THE INPUT FROM THE USER WHAT VALUES TO TAKE AT X AXIS
    u = int(input("Enter the number from the above list to plot at y axis:")) #TAKING THE INPUT FROM THE USER WHAT VALUES TO TAKE AT Y AXIS
    value(g,u) #calling function
    loop=input('If you want to give more inputs for x and y press yes or no: ')
Output:
Python Terminal:
Plots:
Conclusion: Basic performance calculations have been obtained and results were plotted using python code.