Week 6 - Data analysis
Week 6 – Challenge – Data Analysis.
Aim: - Performing the data analysis from the simulation of engine and plot various results.
Objective: -
- To read the file and visualize the data in the correct format.
- To check for the compatibility of data inside the file.
- To calculate the plot without any manual coding interface.
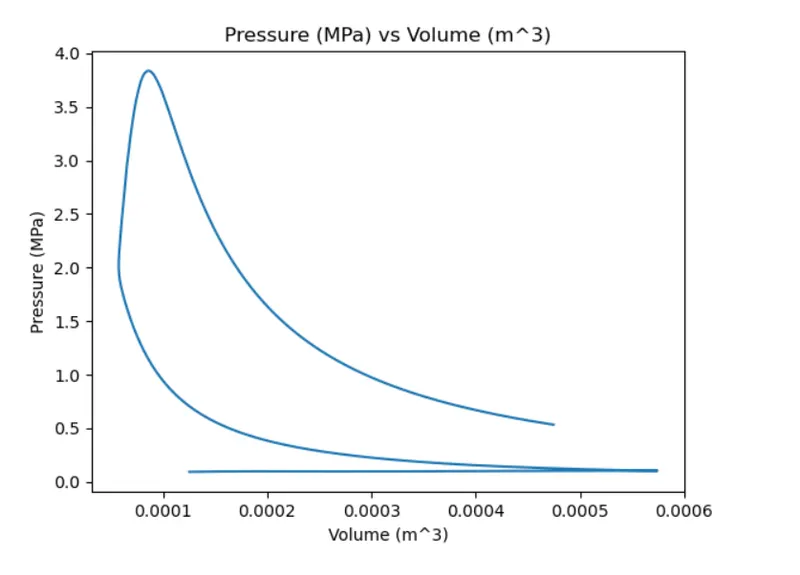
- To calculate the area under the P-V diagram for engine.
- To calculate the power output of engine at 1500 RPM.
- To calculate the specific fuel consumption of engine for engine consumed 20 micrograms of fuel.
Introduction: -
Data analysis is the field of engineering where data from the simulation or any experimental research is being studied and future performance improvement in the product are capitalized. In the data analysis the most important part is how to read the file from the source and how good it can be visualized to make proper graph and results which are easily readable to user. Python being as programming language is dominated in the data analysis from last one decade. It provides user friendly syntax which become easy to use and understand while extracting the data from file.
In this code the engine simulation data is being investigated and used to calculate the power output, area under the curve and specific fuel consumption. It is better practice to look into data before making any approach towards the code. Understanding of data makes life easier for programmer. In the data file there are almost 17 columns and more than 8000 value. From the data it is quite understand it is for a four stroke engine with petrol ignition system. The formula for calculation of power output, area under the curve and specific fuel consumption are given below:
For Power output:
`P=A×n×(10)^6`
where A is the area under the curve
n is number of cycles per second
`n=(N/(2×60))`
`SFC=(Fuel ConSumed)/(Power Output)`
Code Structure:
The code has been divided into three different section. In section 1 the reading of the file is coded which is most important one. After that in section 1 the compatibility of data file is written. In section 2 data extraction from the file is done prior to acquiring data for the calculation of engine parameters. In section 3, all the data gather and performed the engine calculation.
Section 1:
The code started with importing important modules necessary for the program like numpy, matplotlib, scipy. From the scipy module integrate function is being called in for the calculation of area under the curve. After that input parameter is used in python to call the file in the code. If file name is not correct then it will throw and exception to write correct file name with prescribed extension which is done using command ‘FileNotFoundError’. In the same section code provide authority to check the respective data present in the file or not. If not found, then it will throw an error about file is not correct.
Section 2:
In second section, the data extraction is done and stored in 3 variables for 1st three lines in which a column variable is created which stores the number of column present in the data sheet. After that a ‘data’ variable is created which stores the number of column data from file. Then those three variables are used to create and input function for user to select the which data they want to plot between. First a two variable list was developed to plot between them. After that while function is used whether user want to select data or not.
Section 3:
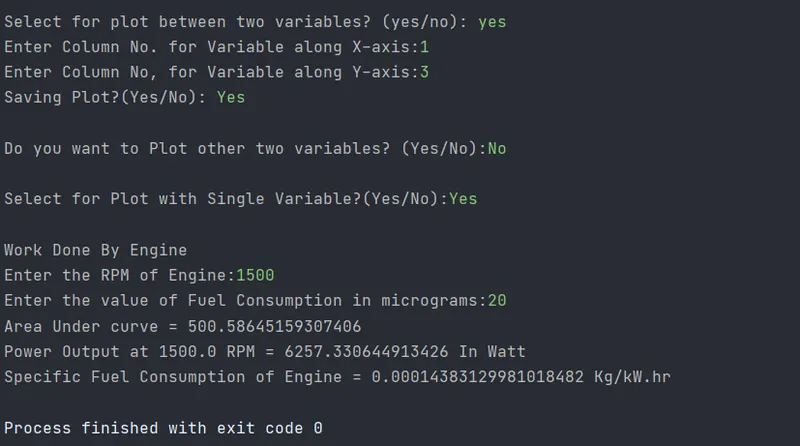
Section 3 has the details of the plotting for the engine parameters, in which area under the curve, power output and specific fuel consumption is calculated. The user has allowed to enter the RPM of engine and fuel quantity to calculate those parameters.
The code for entire section is given below:
"""
Week 6 Challenge - Data Analysis
Objectives: -
1) Should take column number as input
2) Each file should be save as name of column
3) There should be compatibility check for file
4) Calculate area under P-V diagram
5) Calculate specific fuel consumption
"""
import matplotlib.pyplot as plt
import math
import numpy as np
from scipy.integrate import simps

# Creating Input command to call out data file
filename = input('Enter the Name of Data file of Converge with extension .out:')

# Check for the Compatibility of File with respect to data in file.
try:
    f = open(filename)
    f.close()
except FileNotFoundError:
    print('File Not Found. Please enter correct Name of Converege File with .out Extension:')
    exit()

# Check for data present in Converge File
i = 0
for line in open(filename):
     if '#' not in line:
         break
     i = i+1

j = 0
for line in open(filename):
    j = j+1
    if j>1:
        break
if j==1:
    print('Data Is not present In Converge file')
    exit()

# Performing Data Extraction for Converge File
i = 0
for line in open(filename):
    if i==2:
        a = line.split()
        i = 0
        break
    if i==1:
        b = line.split()
        i = i+1
    if 'column' in line.split():
        c = line.split()
        i = 1

c.remove('column')
c.remove('#')
c = np.array(c,dtype=np.int64)
b.remove('#')
a.remove('#')
num_column = len(c)

# Acquiring the data for calculation
data_counter = 0
data = np.arange(0,num_column)

for line in open(filename):
    if '#' not in line:
        d = line.split()
        d = np.array(d,dtype=np.float32)
        data = np.vstack([data,d])
        data_counter = data_counter + 1
data = np.delete(data,0,0)

# Data Visualization from the Converge File
print('Type-')
for i in c:
    print('{} for {}'.format(i,b[i-1]))

print('')
x = input('Select for plot between two variables? (yes/no): ')

while(x.lower()=='yes'):
    tp1 = input('Enter Column No. for Variable along X-axis:')
    tp2 = input('Enter Column No, for Variable along Y-axis:')
    tp1 = int(tp1)
    tp2 = int(tp2)
    plt.figure()
    plt.plot(data[:,tp1-1],data[:,tp2-2])
    plt.xlabel('{} {}'.format(b[tp1-1],a[tp1-1]))
    plt.ylabel('{} {}'.format(b[tp2-1],a[tp2-1]))
    plt.title('{} {} Vs {} {}'.format(b[tp2-1],a[tp2-1],b[tp1-1],a[tp1-1]))
    q = 'n'
    q = input('Saving Plot?(Yes/No): ')
    if(q.lower()=='Yes'):
        plt.savefig("{}--{}.png".format(b[tp2-1],b[tp1-1]))
    plt.show()
    print('')
    x = input('Do you want to Plot other two variables? (Yes/No):')
print('')

x = input("Select for Plot with Single Variable?(Yes/No):")
while(x.lower()=='Yes'):
    tp = input("Enter the column No. of Variable")
    tp = int(tp)
    plt.figure()
    plt.plot(np.arange(0,data_counter),data[:,tp-1])
    plt.xlabel('Data Point Number')
    plt.ylabel('{} {}'.format(b[tp-1],a[tp-1]))
    q = 'n'
    q = input('Want to Save the Plot?(Yes/No)')
    if(q.lower()=='Yes'):
        plt.savefig("{}.png".format(b[tp-1]))
    plt.show()
    print('')
    x = input('Do you want any other single variable to plot? (Yes/No)')
print('')

# Calculations for Engine Variables
# Work Done by Engine
print("Work Done By Engine")
b1 = [i.lower()for i in b]
pressure_col = b1.index('pressure')
volume_col = b1.index('volume')
pressure = data[:,pressure_col]
volume = data[:,volume_col]
A = 0
# Area under the curve
A = simps(pressure,volume,even='first')*np.power(10,6)

# Power output of Engine
rpm = float(input('Enter the RPM of Engine:'))
fuel = float(input('Enter the value of Fuel Consumption in micrograms:'))
num_cycle = rpm/(2*60)
Power = A*num_cycle

# Calculation of Specific Fuel Consumption
f = (fuel*num_cycle*3600)/np.power(10,9)
sfc = (f*1000)/Power

# Results
print('-----------------------------------------------------------------------------------------')
print("Area Under curve = {}".format(A))
print("Power Output at {} RPM = {} In Watt".format(rpm,Power))
print("Specific Fuel Consumption of Engine = {} Kg/kW.hr".format(sfc))
Results:
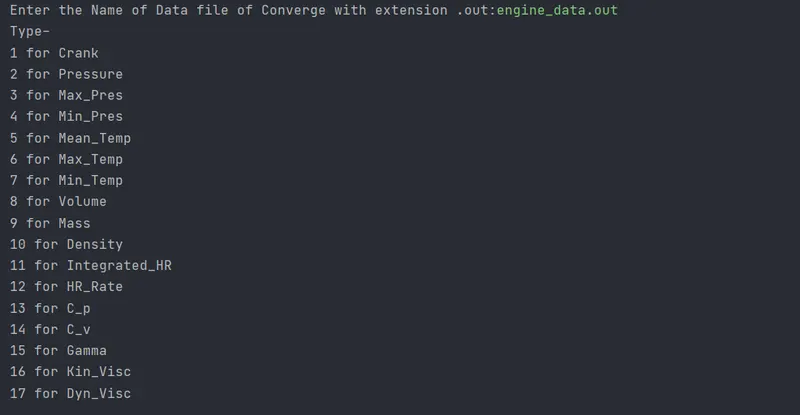
1) Calling the file and Variables
2) Engine Parameters
3) Plot 1 - Pressure vs Volume
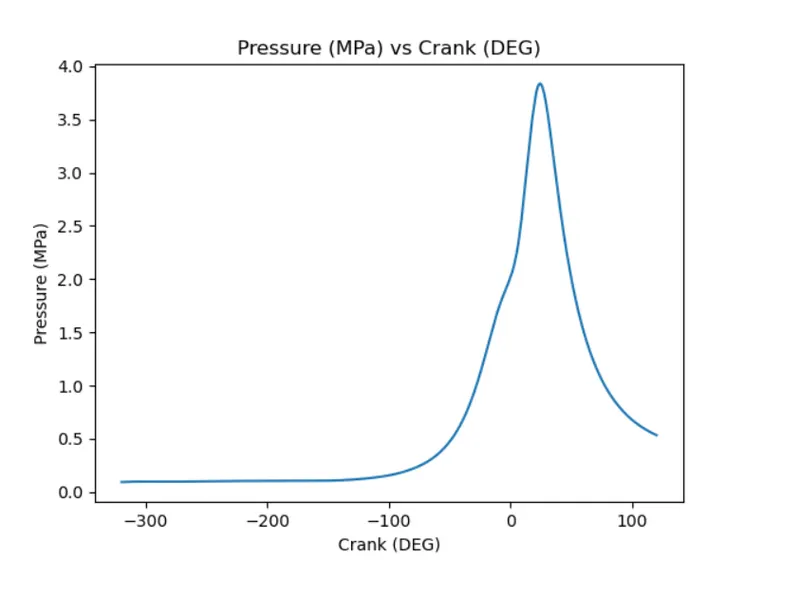
4) Plot 2 - Pressure Vs Crank Angle