Week 6 - Data analysis
Aim:
To write a script for the data analysis with the given engine data and to find specific fuel consumption.
Data Analaysis is the process of collecting,transforming cleaning and modelling data of discovering the required information.
Program:
import matplotlib.pyplot as plt
import numpy as np
import math


#input

try:
	data = open(filename,'r')

except:

	print('file not recognized,please provide a valid CONVERGE output file!')

factor = ['crank angle','pressure','maximum pressure','minimum pressure','mean temperature','maximum tmperature','minimum temperature','volume','mass','density','heat rejection','heat rejection rate','c_p','c_v','gamma','kinematic viscosity','dynamic viscosity']
print('factor')

factors_num = ['crank angle= 0','pressure= 1','maximum pressure= 2','minimum pressure= 3','mean temperature= 4','maximum tmperature= 5','minimum temperature= 6','volume= 7','mass= 8','density= 9','heat rejection= 10','heat rejection rate= 11','c_p= 12','c_v= 13','gamma= 14','kinematic viscosity= 15','dynamic viscosity= 16']
print('factors_num')

#calculate area under P-V
x = 1
y = 7
volume = []
pressure = []
for line in open('engine_data.out','r'):
	if '#' not in line:
		volume.append(float(line.split()[x]))
		pressure.append(float(line.split()[y]))
plt.plot(volume,pressure)
plt.title('volume vs pressure')
plt.xlabel(volume)
plt.ylabel(pressure)
plt.show()

#calculating the area under p-v diagram
area=np.trapz(volume,pressure)
print('Area=',area,'m^2')
workdone=area*pow(10,6)

#calculating the power output of the engine
#n = 1500 rpm
power = 2*(math.pi)*1500*area/60
print('\npower=',power,'kw')

#calculating the specific fuel consumption
#fuel consumption
fc = 20*pow(10,-6)
#fuel consumption per hour
fch = fc*1500*60
#specific fuel consumption
sfc = fch/power
print('\nsfc=',sfc,'g/kwh')
Code explanation:
The required libraries have been imported for the required script. Here the engine data is downloaded and been saved where other program path have been saved.
Here the compactability have been checked and scripted to show whether the data is successfully imported or if file is not found show provide a valid CONVERGE output file.
Using the input function the x and y axis of the required graph is taken and using the loop the required values are stored in array. With this following the garph is plotted and displayed.
The power output of the engine is calculated and specific fuel consumption is also been calculated.
Result:
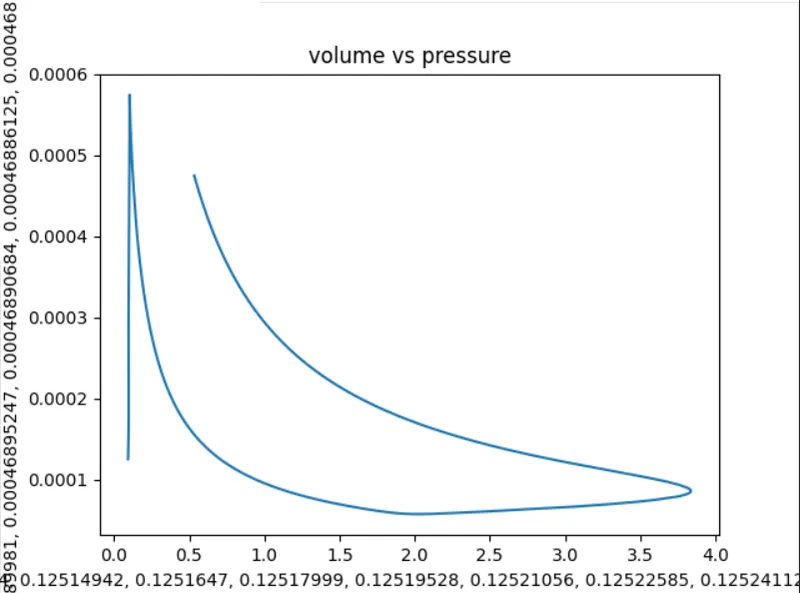
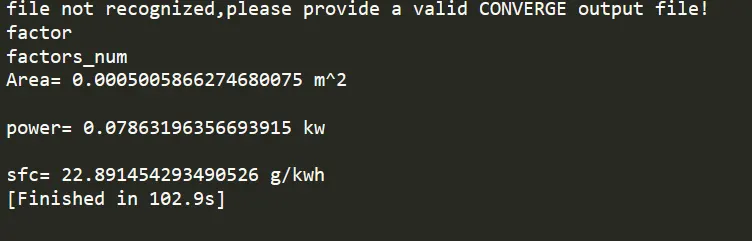
The graph is obtained with the script to find the workdone of pv diagram,power output of the engine and specific fuel consumption.