Week 6 - Data analysis
AIM: To create a script for the following operations
Data visualizer
The script should take column numbers as the input and plot the respective columns as separate images
1. Each file should be saved by the name of the column
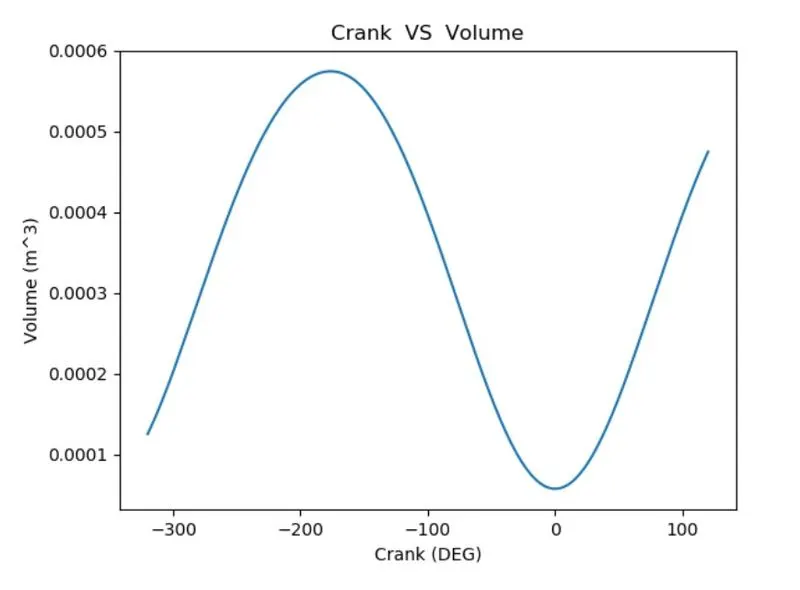
2. The plot labels should be extracted from the file. If I request for a plot between column 1 (crank angle) and column 8(volume), then the label information should automatically be extracted and must appear as labels in plots. THIS SHOULD NOT BE DONE MANUALLY
Basic performance calculation
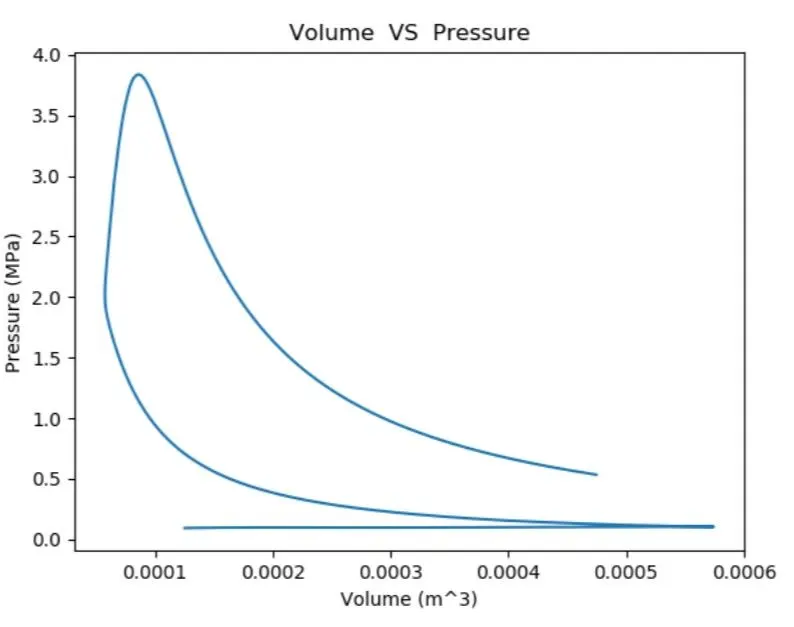
1. Calculate the area under the P-V diagram. P is in column 2 and V is in column 8.
2. Calculate the power output of this engine. Assume that RPM is 1500
3. This engine consumed 20 micrograms of fuel (per 1 stroke cycle). Calculate its specific fuel consumption
PROCEDURE:
* Import the necessary modules.
* Create an empty list for arrays to be appended. use open file and input command to enable the user to input the required file name and open it for parsing
* Use try and except the command to check if the file is compatible
* After the file is opened in reading mode, We need to use a counter variable for line count.
* using if statement we can separate the lines containing # and lines not containing # and use' ' as delimiter we can separate the words on each line
* The split command will convert data into the form of strings.
* Use float command to convert these strings into floating-point numbers and then append them to the respective list.
* Use this command in a for loop to perform the same task for each line.
* Create an array of various columns with respect to its columns numbers.
* Using for loop specifies a different filename for each column specified by the user.
* Again use input command such that the user can specify the columns they want to use for plotting.
* Create the plots for Columns[x] and Columns[y] with respect to the user's desire.
* After the plotting is done and saved, We can use these data to find the area under the graph.
* For this, we need to import trapz from numpy to perform the calculation.
* From the value of the area and the given parameters we can calculate the power and specific fuel consumption.
NOTE: We need to use SublimeREPL to run the command because the input command does not work in sublime BUILD.
CODE:
import math
import matplotlib.pyplot as plt
import numpy as np
#definig the empty arrays
Crank=[]
Pressure=[]
Max_pressure=[]
Min_pressure=[]
Mean_Temp=[]
Max_Temp=[]
Min_Temp=[]
Volume=[]
Mass=[]
Density=[]
Integrated_HR=[]
HR_rate=[]
C_p=[]
C_v=[]
Gamma=[]
Kin_Vice=[]
Dyn_Vice=[]
#Enabling the user to enter reqired filename
file=input('Enter the name of the input file: n')
print(file)
#Command to open the file
try:
file_data=open(file,'r')
print('n Data file is successfully opened')
except FileNotFoundError:
print('n please enter a valid file name')
#Reading the data from the data file by each line using the loop
#Intialising a counter varilable
line_count=1
for line in file_data:
if line_count==3:
columns=line.split()
if line_count==4:
units=line.split()
line_count=line_count + 1
if '#' not in line:
#Append th e data into th eempty arrays
Crank.append(float(line.split()[0]))
Pressure.append(float(line.split()[1]))
Max_pressure.append(float(line.split()[2]))
Min_pressure.append(float(line.split()[3]))
Mean_Temp.append(float(line.split()[4]))
Max_Temp.append(float(line.split()[5]))
Min_Temp.append(float(line.split()[6]))
Volume.append(float(line.split()[7]))
Mass.append(float(line.split()[8]))
Density.append(float(line.split()[9]))
Integrated_HR.append(float(line.split()[10]))
HR_rate.append(float(line.split()[11]))
C_p.append(float(line.split()[12]))
C_v.append(float(line.split()[13]))
Gamma.append(float(line.split()[14]))
Kin_Vice.append(float(line.split()[15]))
Dyn_Vice.append(float(line.split()[16]))
#Assinging the column number for each column
print("please selcet the columns no. form the list below:")
for i in range(1,17+1):
filename=str(columns[i]) + srt(units[i])
print(filename)
columns=np.array([[0],Crank,Pressure,Max_pressure,Min_pressure,Mean_Temp,Max_Temp,Min_Temp,Volume,Mass,Density,Integrated_HR,HR_rate,C_p,C_v,Gamma,Kin_Vice,Dyn_Vice])
#Enabling the user to input of column values
x=int(input('Enter the column number you want in x-axis: '))
y=int(input('Enter the column number you want on y-axis: '))
#plotting the graph with respective to the colmns values
plt.plot(columns[x],columns[y])
#specification varying for each plot
plt.title(str(columns[x])+' '+'VS'+' '+str(columns[y]))
plt.xlabel(str(columns[x])+' '+str(units[x]))
plt.ylabel(str(columns[y])+' '+str(units[y]))
plt.savefig(str(columns[x])+' '+'vs'+' '+str(columns[y]))
plt.show()
#For finding the area under the graph, Power output and specific Fuel consumtion
if x==8 and y==2:
Area=np.trapz(columns[x],columns[y])
Workdone = area*1000
RPM=1500
Power=2*math.pi*RPM*Workdone/60
#To calculate specific fuel consumption use the formula BDFC= Fuel_cosumtion/power
fuel_per_stroke=20*pow(10,-6)
fuel_per_sec=fuel_per_stroke*RPM*(0.5/60)
fuel_per_hour=fuel_per_sec*3600
BSFC=fuel_per_hour/Power
print('area under the PV-grapth: ',area)
print('workdone: ',Workdone,'KJ')
print('Power output of the engine: ',power,'KW')
print('specific fuel consumption: ',BSFC,'g/KWH')
RESULT
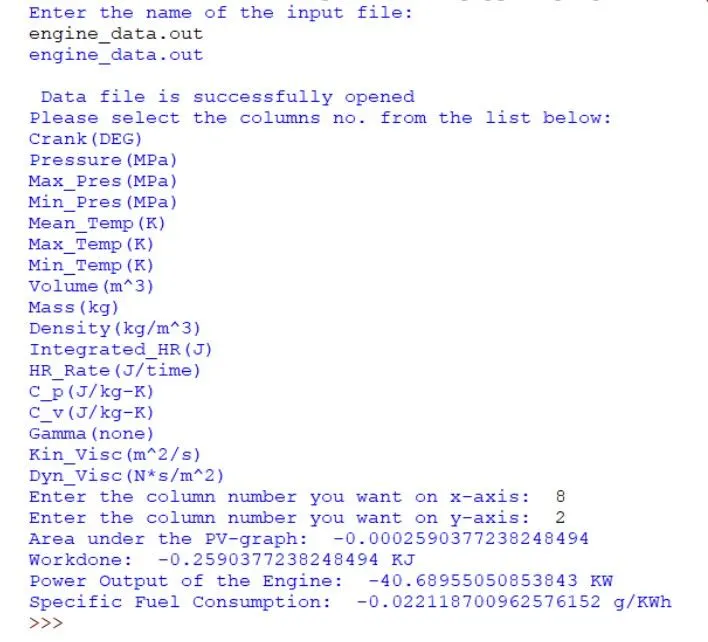
#IDLE
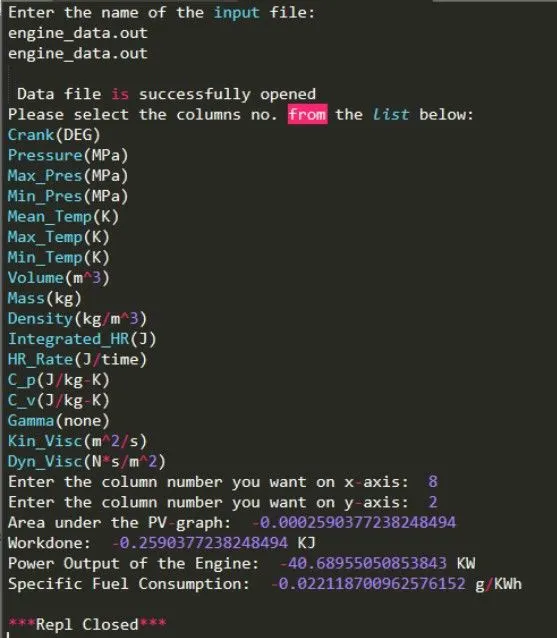
#SublimeREPL
PLOT
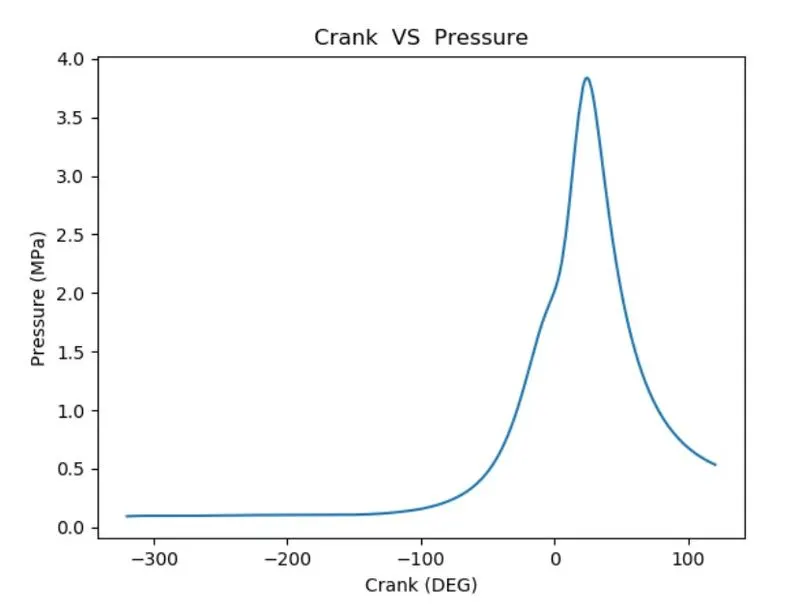
CALCULATION OUTPUT:
The area under the PV-graph: -0.0002590377238248494
Workdone: -0.2590377238248494 KJ
Power Output of the Engine: -40.68955050853843 KW
Specific Fuel Consumption: -0.022118700962576152 g/KWh
https://drive.google.com/drive/folders/1r1KMa1z-_xgY295lJvlMbJnruvxjzb92?usp=sharing