Week 6 - Data analysis
Week 6 Challenge - Data Analysis
Aim:
The aim of this assignment is to perform file parsing on the given thermodynamic data file.
Objective:
- To perform a compatibility check on the thermodynamic data file that will be used for the file parsing process.
- To output a plot between any two given parameters in the thermodynamic data file and save the plot with a file name that is based on the parameters.
- To calculate the area under the graph for the parameters of pressure and volume.
- To calculate the power output of the engine and specific fuel consumption of the engine when the speed is 1500 rpm and fuel consumption is 20mg per stroke cycle.
Problem Statement:
How to perform file parsing on the given thermodynamic file in Python to accomplish the objectives listed above?
Procedure:
Firstly, download thermodynamic file using the given link and save the file in the same directory where the python scripts are saved. Open a new python script and import the basic modules listed below:
- math
- matplotlib
- numpy
To perform the compatibility check, use the 'input' function in order to receive user input when the code is being run. This function can ask the user to enter the name of the thermodynamic data file along with the file extension. Next, use an "if" statement so that the code performs two different things based on the file name that was asked to be entered. If the file name is "engine_data.out", proceed with the file parsing. Use the else statement, to print a statement that asks to input a valid file name e.g." File unrecognised. Please provide a valid CONVERGE data file".
Within the "if" statement, if the file name is valid, create a set of empty arrays for every parameter that is listed in the thermodynamic file. In addition, create two more empty arrays for the units of the variables, and for the parameter itself. Also, create a variable that tracks the line count of the data file.
import math
import matplotlib.pyplot as plt
import numpy as np

file_name = input('Enter File Name:')
if file_name == ('engine_data.out'):
	crank = []
	pressure = []
	max_pressure = []
	min_pressure = []
	mean_temp = []
	max_temp = []
	min_temp = []
	volume = []
	mass = []
	density = []
	int_hr = []
	hr_rate = []
	cp = []
	cv = []
	gamma = []
	kin_visc = []
	dyn_visc = []
	ct= 1
	parameter = []
	units = []
Proceed with the file parsing using the "for line in open()" function, to allow Python to open the thermodynamic data file and read the data from the file. Add a count of plus one to the previously created "ct" variable so that for every line that is read from the file, the line count will be added by one.
Use another "if" statement to add the data of the parameter name and the units of the parameters, if the line in the thermodynamic file begins with a "#" symbol. This statement must use the 'line.split' and 'append' functions to add to the empty arrays of parameter and units, based on the line count of where that data is found in the file.
To parse the data below each parameter, use another if statement to add the data to the respective empty arrays, when the line does not begin with a "#" symbol. This will also make use of the 'line.split' and 'append' functions and the index position of the columns.
for line in open("engine_data.out"):
	ct = ct+1
	if '#' in line:
		if ct == 4:
			parameter.append(line.split())
		if ct== 5:
			units.append(line.split())


	if "#" not in line:
		crank.append(float(line.split()[0]))
		pressure.append(float(line.split()[1]))
		max_pressure.append(float(line.split()[2]))
		min_pressure.append(float(line.split()[3]))
		mean_temp.append(float(line.split()[4]))
		max_temp.append(float(line.split()[5]))
		min_temp.append(float(line.split()[6]))
		volume.append(float(line.split()[7]))
		mass.append(float(line.split()[8]))
		density.append(float(line.split()[9]))
		int_hr.append(float(line.split()[10]))
		hr_rate.append(float(line.split()[11]))
		cp.append(float(line.split()[12]))
		cv.append(float(line.split()[13]))
		gamma.append(float(line.split()[14]))
		kin_visc.append(float(line.split()[15]))
		dyn_visc.append(float(line.split()[16]))
Next, create a new variable that stores the names of the parameters in the thermodynamic data file, within an array.
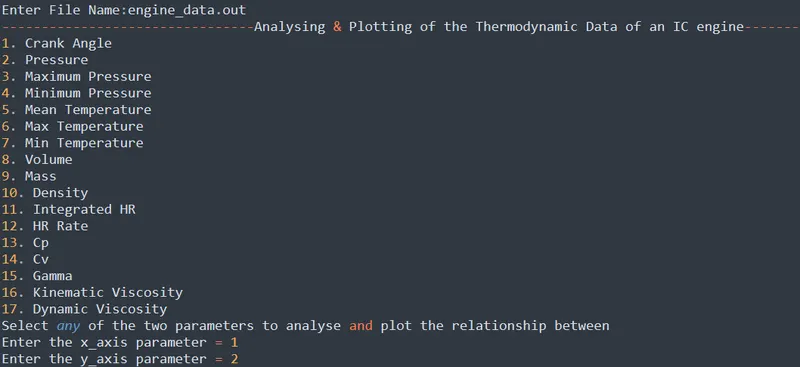
After, use the "print" statement to list out all the parameters in the data file, in the correct order. The "print" statement can also output additional statement to make the program appear more interactive e.g. "Select any of the two parameters to analyse and plot the relationship between". Create two more variables for "x" and "y" which will require user input to provide the two data parameters for which the graphs will be plotted along the x and y axis. This input will take the serial number of the parameter rather than the parameter itself. For instance, "2" would select the "Pressure" parameter.
# Array for Parameters and their respective units

	parameter_select = [crank, pressure, max_pressure, min_pressure, mean_temp, max_temp, min_temp, volume, mass, density, int_hr, hr_rate, cp, cv, gamma, kin_visc, dyn_visc]

# UI for Program
	print("--------------------------------Analysing & Plotting of the Thermodynamic Data of an IC engine------------------------")
	print('1. Crank Angle')
	print('2. Pressure ')
	print('3. Maximum Pressure')
	print('4. Minimum Pressure')
	print('5. Mean Temperature')
	print('6. Max Temperature')
	print('7. Min Temperature')
	print('8. Volume')
	print('9. Mass')
	print('10. Density')
	print('11. Integrated HR')
	print('12. HR Rate')
	print('13. Cp')
	print('14. Cv')
	print('15. Gamma')
	print('16. Kinematic Viscosity')
	print('17. Dynamic Viscosity')

	print('Select any of the two parameters to analyse and plot the relationship between')
	x = int(input('Enter the x_axis parameter = '))
	y = int(input('Enter the y_axis parameter = '))
In order to plot the data between the two parameters that were input by the user, use an "if" statement that will make use of the 'parameter' and 'units' arrays. These arrays are required for the serial number positions that the parameters hold in the thermodynamic file. These commands will go through the length of the two arrays.
Use the 'plt.plot' command to plot the graph between the two different parameters that were selected by the user. In order to display the correct parameter and the respective units along the axes of the plot, perform matrix multiplication between the two arrays. Perform the same for the title and when saving the plot using the 'plt.savefig' function. Ensure to save the plot as a '.png' file.
# Data Plotting
	for i in range(0, len(parameter)):
		for j in range(0, len(units)):
			plt.plot(parameter_select[x], parameter_select[y], linewidth = 3)
			plt.xlabel(parameter[0][x] + units[0][x])
			plt.ylabel(parameter[0][y] + units[0][y])
			plt.title('Plot of ' + parameter[0][x] + " Vs. " + parameter[0][y])
			plt.savefig(parameter[0][x] + " Vs. " + parameter[0][y] + '.png')
Finally, perform the necessary calculations to determine the output power and specific fuel consumption of the engine. Using the 'input' function, create two more variables that require the user to input the known data of the engine speed in rpm and the fuel consumption on micrograms per stroke. To calculate the work done by the engine, we need to integrate the PV diagram of the engine.
Use the 'np.trapz' function from the numpy module to calculate the area under the PV diagram. Within the function, ensure that the parameter of pressure and volume are selected using their serial number positions. This function can be saved with the variable "work_done". Since the pressure parameter is measured in MPa, we need to convert the work done by 1 million to obtain the work done in Joules.
To calculate the power output, use the formula given below:
`P_(out) = (W_d * N)/(60*1000)`
where,
`P_(out)` - Output power of the engine (kW)
`W_d` - Work done by the engine (J)
`N`- Speed of the engine (rpm)
To calculate the specific fuel consumption, divide the speed of the engine by 60. This is because we need to first determine the revolutions per second from the revolutions per minute. Create a new variable for the revolutions per second to store this value. Create another variable for total number of strokes by multiplying the revolutions per second by 4. This is because, I assume the engine to be a 4 stroke one, and the fuel consumption value used is 20 micrograms per stroke. In a four stroke engine, one revolution of the crankshaft, results in four strokes in the cylinder.
Multiply the fuel consumption value by the total number of strokes to obtain the fuel consumption in micrograms per second.
The specific fuel consumption is determined by multiplying the fuel consumption (now in micrograms per second) with 0.0036 and dividing by the power output value.
Additionally, the 'print' statement can be used to display the work done, power output, and specific fuel consumption of the engine in a more interactive manner.
# Engine Performance Calculation

	fuel_consump= float(input('Enter the fuel consumption of the engine in Micro gram/Stroke:'))
	rpm = float(input('Enter the engine speed in rpm:'))

	work_done = np.trapz(parameter_select[2], parameter_select[8])
	work_done = work_done * pow(10,6)
	print('Work Done by the Engine is:' + str(work_done) + 'J')

	pow_out = (work_done*(rpm/60))/1000
	print("Power output of Engine is:" + str(pow_out) + 'kW')

	rps = rpm/60
	total_strokes = 4*rps
	fuel_consump = fuel_consump * total_strokes
	sfc = (fuel_consump * 0.0036)/pow_out
	print('The Specific Fuel Consumption of the Engine is:' + str(sfc) + 'g/kW.hr')

else:
	print('File unrecognised. Please provide a valid CONVERGE data file.')
Output:
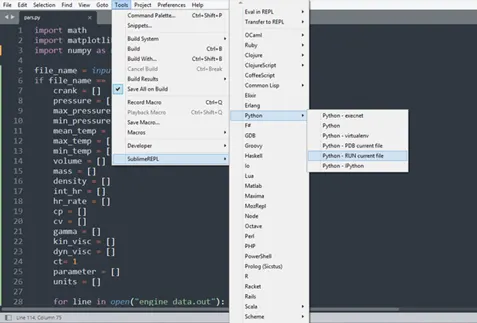
Note: The code will only run and take user inputs if the "SublimeREPL" package is installed to Sublime Text. Once installed, navigate to "Tools > SublimeREPL > Python > Python - RUN current file".
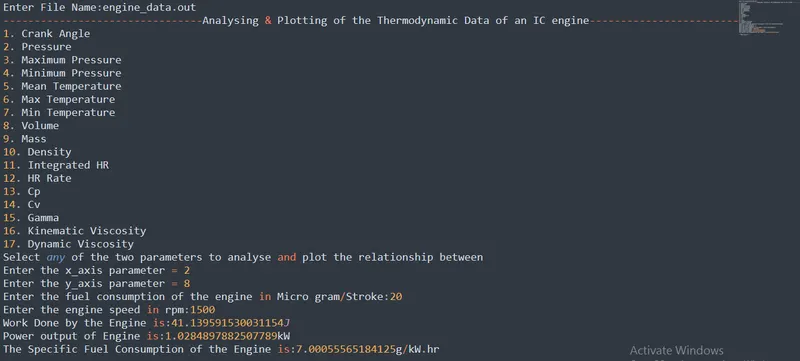
The screenshot below shows the output that is obtained when the code is run and the correct file name is used for the file parsing. In addition, the engine performance calculation results are also shown.
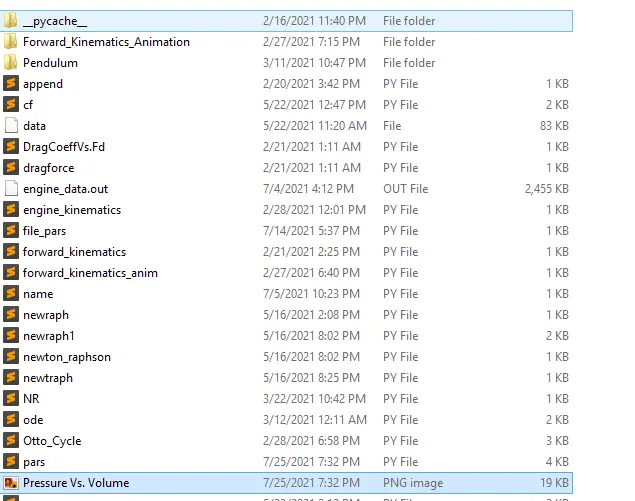
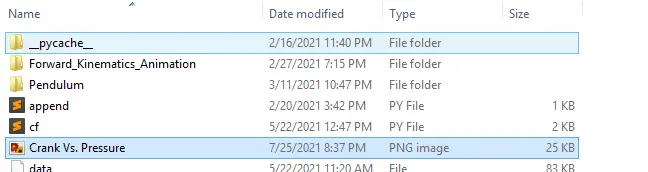
The plot between the pressure and volume is saved (with the required file name) in the python directory as shown in the screenshot below:
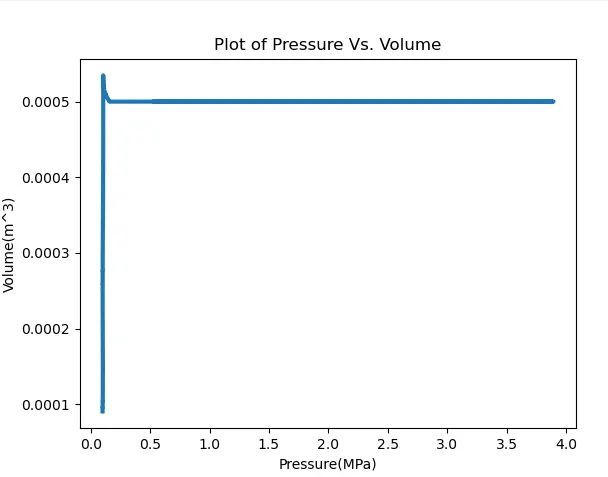
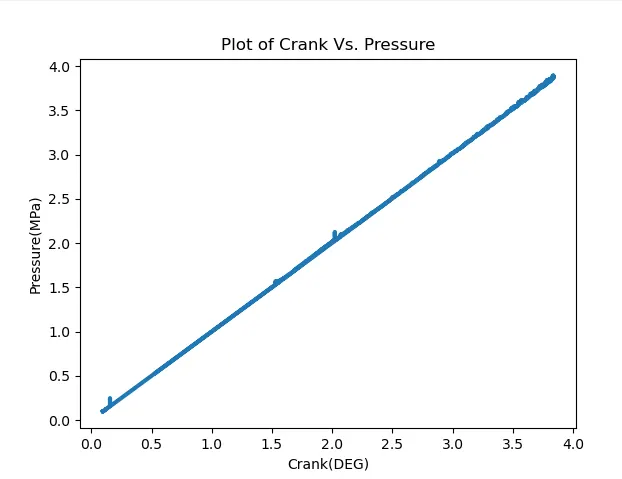
The PV diagram is shown in the screenshot below:
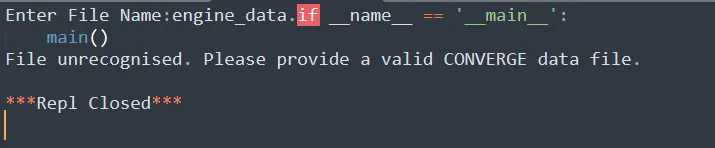
If the incorrect file name is entered, the following error will appear:
An example of when the parameters of crank angle and pressure are selected, are shown in the screenshots below:
Conclusion:
In conclusion, file parsing of the provided thermodynamic data file was performed in python. In addition, a plot between any two selected parameters can be generated and saved. Also, the necessary engine performance calculations were performed to obtain the following results:
The work done by the engine is: 41.14 Joules
The power output of the engine is: 1.03kW
The specific fuel consumption of the engine is: 7.00g/kW-hour