Week 6 - Data analysis
Data analysis
Aim:
- The script should take column numbers as the input and plot the respective columns as separate images.
- Each file should be saved by the name of the column.
- The plot labels should be extracted from the file.
- If we request a plot between column 1 (crank angle) and column 8(volume), then the label information should automatically be extracted and appear as labels in the plots.
- Compatability check, in which Code should exit gracefully if a non-compatible file is provided as an input.
Basic performance calculation
- Calculate the area under the P-V diagram. P is in column 2 and V is in column 8.
- Calculate the power output of this engine. Assume that RPM is 1500
- This engine consumed 20 micrograms of fuel (per 1 stroke cycle). Calculate its specific fuel consumption.
Procedure:
- For Compatability check, the file should match with the main file so we take that input as a string and match it with the if-else loop
- The a and b as integer inputs to use later.
- We start reading file A after opening it in for loop.
- in this, we use 3 if conditions in which we save the line of unit and properties in an array and append them into an empty array.
- when we split the line it comes in form of an array.
- from this, I can get any column data of that row/line just by indexing the required value
- As the crank angle has 1 indexing, pressure has 2 like this we can get any data we want.
- convert that data into floating-point numbers as it might be a string.
- Add this to my crank array.
- Now, save the file name and plot figure.
- We calculated the below area, power, etc by simply defining the formula in python.
- At last, we print all of them.
Code:
import math
import numpy as np
import matplotlib.pyplot as plt

colomData_1= []
colomData_2=[]
Units=[]
properties = []

A= input('Input a file name:  ')
if A == 'engine_data.out':
    print('Ok, valid file')
else:
    print('Please enter a valid file name')
    exit()

a = input ("Enter the first column index value:  ")
b = input ("Enter the second column index value:  ")
a= int(a)
b= int(b)

line_count =1
for line in open(A):

    line_count = line_count + 1
    if line_count == 4:
        properties.append(line.split())
        P1 = (line.split()[a])
        P2 = (line.split()[b])

    if line_count == 5:
        Units.append(line.split())
        U1 = (line.split()[a])
        U2 = (line.split()[b])

    if '#' not in line:
        colomData_1.append(float(line.split()[a-1]))
        colomData_2.append(float(line.split()[b-1]))

flilename = 'property%04d.png' % line_count
plt.figure(line_count)
plt.plot(colomData_1, colomData_2, linewidth =3)
plt.ylabel(P1 + U1)
plt.xlabel(P2 + U2)
plt.savefig(flilename)

# Calculate the area under the P-V diagram

pressure= []
volume=[]
for line in open('engine_data.out'):
    if '#' not in line:
        pressure.append(float(line.split()[1]))
        volume.append(float(line.split()[7]))


Area= np.trapz(pressure,volume)* pow(10,6)
print(Area)

# Calculate the power output of this engine
RPM = 1500
Power = Area * (RPM/60)
Fuel_mass = 20 * pow(10,-6)
# Calculate its specific fuel consumption
Specific_fuel_cons= Fuel_mass/ Power
print('Wokedone = ', Area)
print('Power= ', Power)
print('Specific fuel consumption = ',Specific_fuel_cons)
Results:
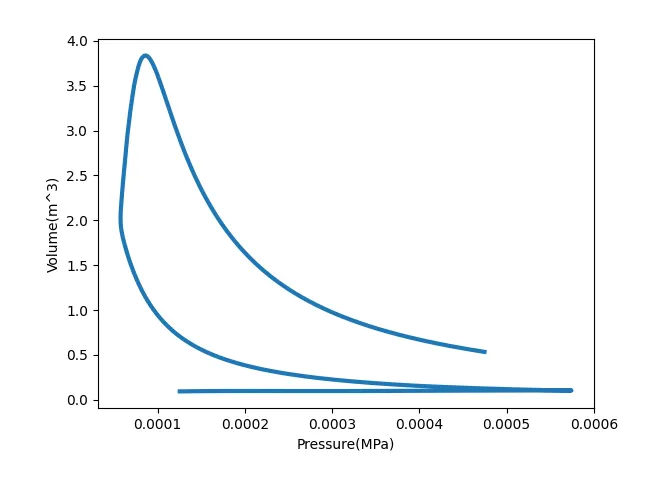
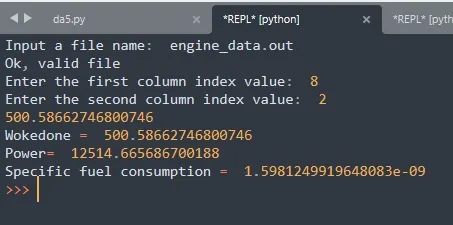
As show above figure we can plot between any property just by giving the column number. And can calculate the results.