Week 6 - Data analysis
Problem statement:
Data visualizer
- Write a script should take column numbers as the input and plot the respective columns as separate images
- Each file should be saved by the name of the column
- The plot labels should be extracted from the file. If, I request for a plot between column 1 (crank angle) and column 8(volume), then the label information should automatically be extracted and must appear as labels in the plots. THIS SHOULD NOT BE DONE MANUALLY
Compatability check
- Code should exit gracefully, if a non-compatible file is provided as an input. It should say something like "File not recognized. Please provide a valid CONVERGE output file"
Basic performance calculation
- Calculate the area under the P-V diagram. P is in column 2 and V is in column 8.
- Calculate the power output of this engine. Assume that RPM is 1500
- This engine consumed 20 micro grams of fuel (per 1 stroke cycle). Calculate its specific fuel consumption.
Data Analysis:
Data analysis is a process of inspecting, cleansing, transforming, and modeling data with the goal of discovering useful information, informing conclusions, and supporting decision-making.
Steps Followed:
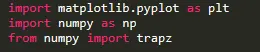
1. Import the modules
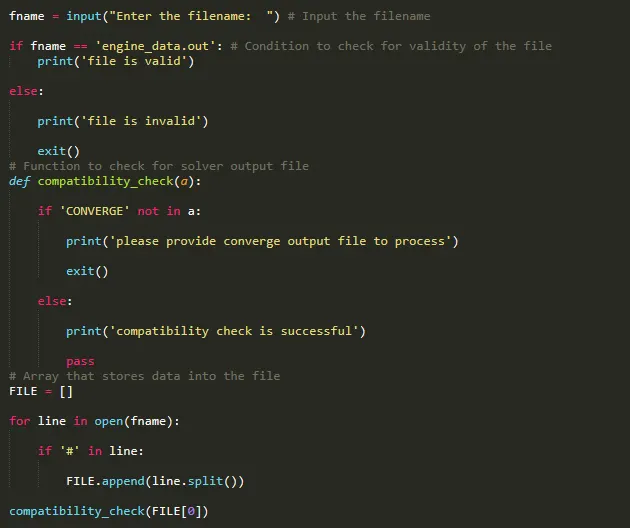
2.Check the file for compatibility
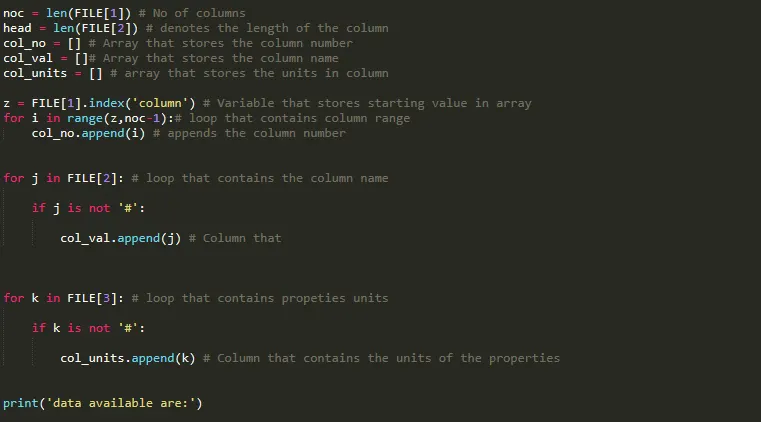
3. Printing the data quantites as column number,quantites and its units
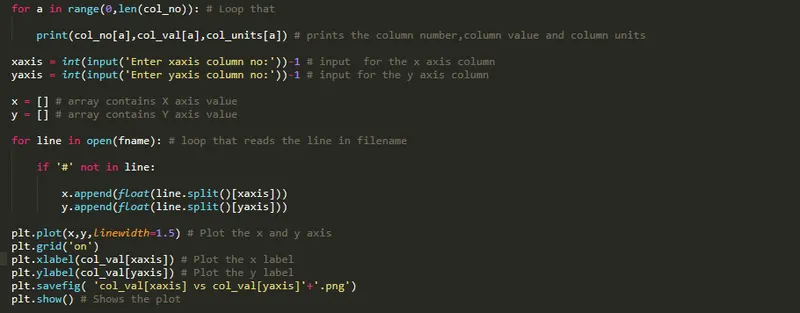
4. Plotting the two quantites and save it in .png format
5. Calculation of certain engine performance quantites as shown below
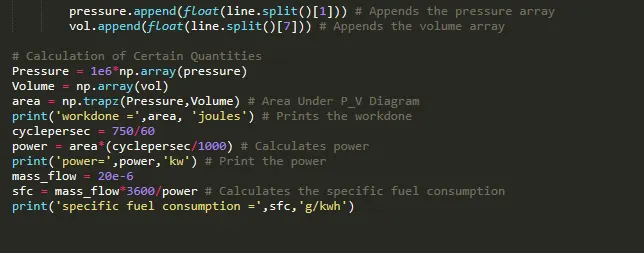
import matplotlib.pyplot as plt
import numpy as np
from numpy import trapz

fname = input("Enter the filename:  ") # Input the filename

if fname == 'engine_data.out': # Condition to check for validity of the file
	print('file is valid')

else:

	print('file is invalid')

	exit()
# Function to check for solver output file
def compatibility_check(a):

	if 'CONVERGE' not in a:

		print('please provide converge output file to process')

		exit()

	else:

		print('compatibility check is successful')

		pass
# Array that stores data into the file
FILE = []

for line in open(fname):

	if '#' in line:

		FILE.append(line.split())

compatibility_check(FILE[0])


noc = len(FILE[1]) # No of columns
head = len(FILE[2]) # denotes the length of the column
col_no = [] # Array that stores the column number
col_val = []# Array that stores the column name
col_units = [] # array that stores the units in column

z = FILE[1].index('column') # Variable that stores starting value in array
for i in range(z,noc-1):# loop that contains column range
	col_no.append(i) # appends the column number


for j in FILE[2]: # loop that contains the column name

	if j is not '#':

		col_val.append(j) # Column that


for k in FILE[3]: # loop that contains propeties units

	if k is not '#':

		col_units.append(k) # Column that contains the units of the properties


print('data available are:')

for a in range(0,len(col_no)): # Loop that

	print(col_no[a],col_val[a],col_units[a]) # prints the column number,column value and column units

xaxis = int(input('Enter xaxis column no:'))-1 # input  for the x axis column
yaxis = int(input('Enter yaxis column no:'))-1 # input for the y axis column

x = [] # array contains X axis value
y = [] # array contains Y axis value

for line in open(fname): # loop that reads the line in filename

	if '#' not in line:

		x.append(float(line.split()[xaxis]))
		y.append(float(line.split()[yaxis]))

plt.plot(x,y,linewidth=1.5) # Plot the x and y axis
plt.grid('on')
plt.xlabel(col_val[xaxis]+col_units[xaxis]) # Plot the x label
plt.ylabel(col_val[yaxis]+col_units[yaxis]) # Plot the y label
plt.savefig( col_val[xaxis]+'_Vs_'+col_val[yaxis] +'.png')
plt.show() # Shows the plot


pressure = [] # Array that contains the pressure value
vol = [] # Array that contains the volume value

for line in open(fname):
	if '#' not in line:

		pressure.append(float(line.split()[1])) # Appends the pressure array
		vol.append(float(line.split()[7])) # Appends the volume array

# Calculation of Certain Quantities
Pressure = 1e6*np.array(pressure)
Volume = np.array(vol)
area = np.trapz(Pressure,Volume) # Area Under P_V Diagram
print('workdone =',area, 'joules') # Prints the workdone
cyclepersec = 750/60
power = area*(cyclepersec/1000) # Calculates power
print('power=',power,'kw') # Print the power
mass_flow = 20e-6
sfc = mass_flow*3600/power # Calculates the specific fuel consumption
print('specific fuel consumption =',sfc,'g/kwh')
Output:
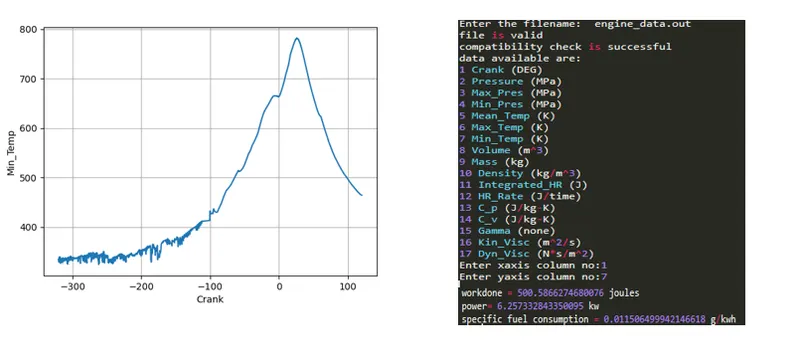
Conclusion
As data analysis for the given file has been carried out as per the data provided.