Week 6 - Data analysis
Aim:
- To parse the given engine data and write a scrpit to plot the user defined data sets.
- To check the compatibilty of the file.
- Calculate the area under PV diagram, Power and the specific fuel consumption.
Program Logic:
- At first,the compatibility check of the file is performed using the "try,except" command.
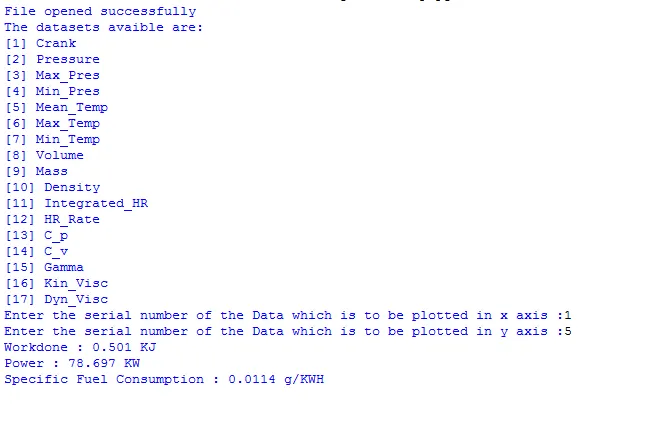
- Once the compatibility check is performed, the engine data file is opened and the available datasets are extracted and printed.
- The available datasets has a unique serial number, A user input is asked with respect to the serial numbers of the data to plot the curve.
- The user input is stored and is used as the serial number of the datasets whose curves are to be plotted. The datsets are stored in seperate lists.
- The same serial numbers are used to extract the Labels and units of the dataset.
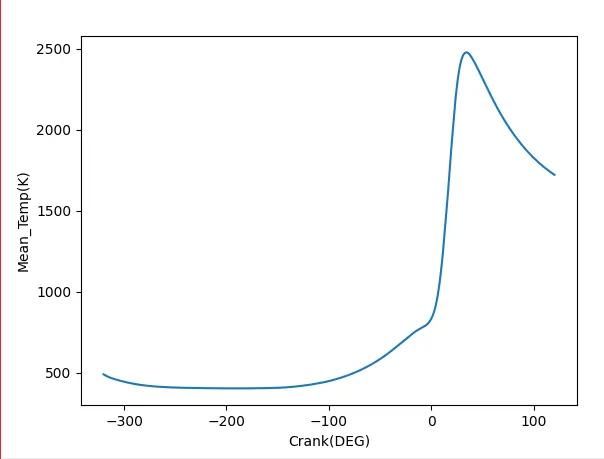
- The list is then plotted given the desired output.
- The area under PV diagram is calculated using the "trapz" command.
- The Power and Specific fuel consumption is then calculated using the concerned formulae.
Program:
# FILE PARSING
#Importing Libraries:
import math
import matplotlib.pyplot as plt
import numpy as np

#Intializations:
a = []
b = []
line_ct = []
ct = 1

#Compatibility check:
try:
        f = open('engine_data.out')
        print('File opened successfully')
        f.close()
except FileNotFoundError:
        print('File not recognized. Please provide a valid CONVERGE output file')

#Extracting Available Datasets:
f1 = open('engine_data.out')
print('The datasets avaible are:')
for lineno in f1:
        for i in range(1,18):
                if ct == 3:
                        print([i],lineno.split()[i])
        ct = ct + 1
f1.close()

#Taking User Input:
c = input('Enter the serial number of the Data which is to be plotted in x axis :')
d = input('Enter the serial number of the Data which is to be plotted in y axis :')
c = int(c)
d = int(d)

#Extracting User defined Data:
f2 = open('engine_data.out')
for line in f2:
        if '#' not in line:
                a.append(float(line.split()[c-1]))
                b.append(float(line.split()[d-1]))
f2.close()

#Extracting Data for X and Y Label:
f3 = open('engine_data.out')
ct2 = 1
for line in f3:
        for j in range(1,18):
                if ct2==3: # Extracting Label Data
                        e = str(line.split()[c])
                        f = str(line.split()[d])
                if ct2==4: # Extracting Units
                        g = str(line.split()[c])
                        h = str(line.split()[d])
        ct2 = ct2 + 1
f3.close()

#Creating Labels:
k = e + g
l = f + h

#Calculating Work Done,Power and Specific Fuel Consumption:
p = []
v = []
f4 = open('engine_data.out')
for lines in f4:
        if '#' not in lines:
                p.append(float(lines.split()[1]))
                v.append(float(lines.split()[7]))
f4.close()
RPM = 1500
fps = 20*(10**-6)
Workdone = round((np.trapz(p,v)*1000),3)
Power = round((2*math.pi*RPM*Workdone/60),3)
fph = (fps*RPM*(0.5/60))*3600
SFC = round((fph/Power),4)

print('Workdone :',Workdone,'KJ')
print('Power :',Power,'KW')
print('Specific Fuel Consumption :',SFC,'g/KWH')

#Plotting Data:
plt.plot(a,b)
plt.xlabel(k)
plt.ylabel(l)
plt.show()
Output:
Result:
- A scrpit is written to plot the user defined data sets.
- Compatibilty check is performed.
- Area under PV diagram, Power and the specific fuel consumption are calculated.