Week 6 - Data analysis
Project Made By – Piyush Mishra
Aim
To create a Data Visualizer Tool that plots various user defines curves by using Python Coding
Governing Equation
For Basic Calculation like:
WorkDone by the Piston cylinder = Area under PV Curve (In MJ) = (1000*KJ)
Power = 2π*RPM*WorkDone/60 (In KW)
Fuel per Stroke = 20*10-6 (In grams per stroke)
Fuel per Sec = {Fuel per Stroke} *RPM*(1/120) (In grams per second)
Fuel per Hour = {Fuel per Sec} *3600 (In grams per hour)
BSFC = {Fuel per Hour} / {Power} (In g/KWh)
Objectives of the Project
The Objectives for the Project are to be done by Python Programming. They are:
- The code should exit gracefully, if a non-compatible file is provided as an input.
- Construct a P-V diagram from data provided
- Calculate the area under the P-V diagram.
- Calculate the power output of this engine. Assume that RPM is 1500
- This engine consumed 20 micro grams of fuel (per 1 stroke cycle). Calculate its specific fuel consumption.
- Your script should take column numbers as the input and plot the respective columns as separate images
- Each file should be saved by the name of the column
- The plot labels should be extracted from the file. If, it is requested to a plot between column 1 (crank angle) and column 8(volume), then the label information should automatically be extracted and must appear as labels in the plots. THIS SHOULD NOT BE DONE MANUALLY
Body of Content
Python Programing is used here with explanation:
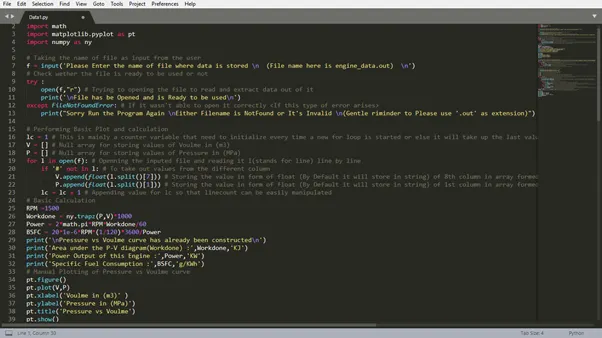
# Importing Important modules
import math
import matplotlib.pyplot as pt
import numpy as ny

# Taking the name of file as input from the user
f = input('Please Enter the name of file where data is stored \n  (File name here is engine_data.out)  \n')
# Check wether the file is ready to be used or not
try :
	open(f,"r") # Trying to opening the file to read and extract data out of it
	print('\nFile has be Opened and is Ready to be used\n')
except FileNotFoundError: # If it wasn't able to open it correctly <If this type of error arises>
	print("Sorry Run the Program Again \nEither Filename is NotFound or It's Invalid \n(Gentle riminder to Please use '.out' as extension)")

# Performing Basic Plot and calculation
lc = 1 # This is mainly a counter variable that need to initialize every time a new for loop is started or else it will take up the last value of ct and we will get <indexerror: list index out of range>
V = [] # Null array for storing values of Voulme in (m3)
P = [] # Null array for storing values of Pressure in (MPa)
for l in open(f): # Openning the inputed file and reading it l(stands for line) line by line
	if '#' not in l: # To take out values from the different column
		V.append(float(l.split()[7])) # Storing the value in form of float (By Default it will store in string) of 8th column in array formed by spliting the each line from the datafile into a Null array
		P.append(float(l.split()[1])) # Storing the value in form of float (By Default it will store in string) of 1st column in array formed by spliting the each line from the datafile into a Null array
	lc = lc + 1 # Appending value for lc so that linecount can be easily manipulated
# Basic Calculation
RPM =1500
Workdone = ny.trapz(P,V)*1000
Power = 2*math.pi*RPM*Workdone/60
BSFC = 20*1e-6*RPM*(1/120)*3600/Power
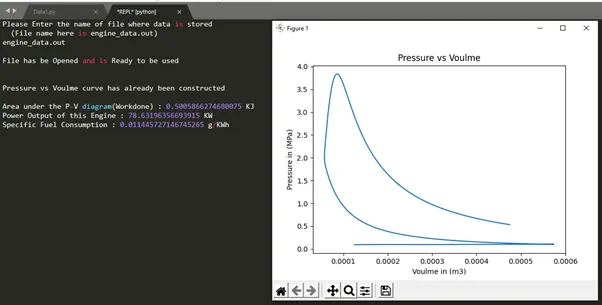
print('\nPressure vs Voulme curve has already been constructed\n')
print('Area under the P-V diagram(Workdone) :',Workdone,'KJ')
print('Power Output of this Engine :',Power,'KW')
print('Specific Fuel Consumption :',BSFC,'g/KWh')
# Manual Plotting of Pressure vs Voulme curve
pt.figure()
pt.plot(V,P)
pt.xlabel('Voulme in (m3)' )
pt.ylabel('Pressure in (MPa)')
pt.title('Pressure vs Voulme')
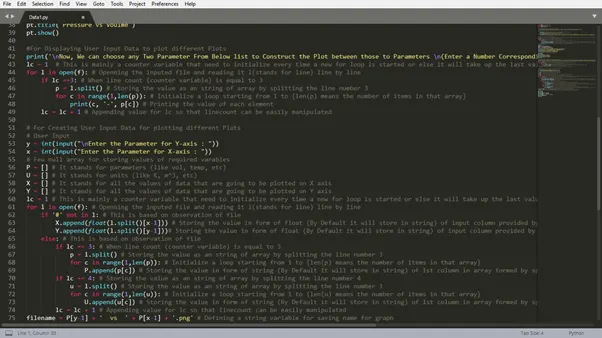
pt.show()

#For Displaying User Input Data to plot different Plots
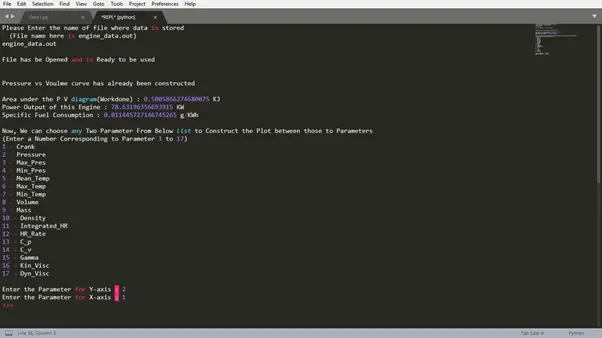
print('\nNow, We can choose any Two Parameter From Below list to Construct the Plot between those to Parameters \n(Enter a Number Corresponding to Parameter 1 to 17)')
lc = 1  # This is mainly a counter variable that need to initialize every time a new for loop is started or else it will take up the last value of ct and we will get <indexerror: list index out of range>
for l in open(f): # Openning the inputed file and reading it l(stands for line) line by line
	if lc ==3: # When line count (counter variable) is equal to 3
		p = l.split() # Storing the value as an string of array by splitting the line number 3
		for c in range(1,len(p)): # Initialize a loop starting from 1 to {len(p) means the number of items in that array}
			print(c, '-', p[c]) # Printing the value of each element
	lc = lc + 1 # Appending value for lc so that linecount can be easily manipulated

# For Creating User Input Data for plotting different Plots
# User Input
y = int(input("\nEnter the Parameter for Y-axis : "))
x = int(input("Enter the Parameter for X-axis : "))
# Few null array for storing values of required varables
P = [] # It stands for parameters (like vol, temp, etc)
U = [] # It stands for units (like K, m^3, etc)
X = [] # It stands for all the values of data that are going to be plotted on X axis
Y = [] # It stands for all the values of data that are going to be plotted on Y axis
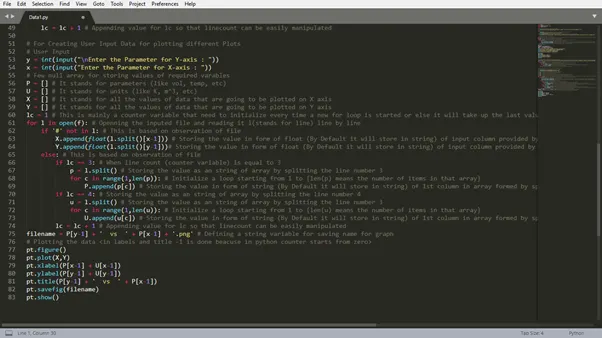
lc = 1 # This is mainly a counter variable that need to initialize every time a new for loop is started or else it will take up the last value of ct and we will get <indexerror: list index out of range>
for l in open(f): # Openning the inputed file and reading it l(stands for line) line by line
	if '#' not in l: # This is based on observation of file
		X.append(float(l.split()[x-1])) # Storing the value in form of float (By Default it will store in string) of input column provided by user in array formed by spliting the each line from the datafile into a Null array
		Y.append(float(l.split()[y-1]))# Storing the value in form of float (By Default it will store in string) of input column provided by user in array formed by spliting the each line from the datafile into a Null array
	else: # This is based on observation of file
		if lc == 3: # When line count (counter variable) is equal to 3
			p = l.split() # Storing the value as an string of array by splitting the line number 3
			for c in range(1,len(p)): # Initialize a loop starting from 1 to {len(p) means the number of items in that array}
				P.append(p[c]) # Storing the value in form of string (By Default it will store in string) of 1st column in array formed by spliting the each line from the datafile into a Null array
		if lc == 4: # Storing the value as an string of array by splitting the line number 4
			u = l.split() # Storing the value as an string of array by splitting the line number 3
			for c in range(1,len(u)): # Initialize a loop starting from 1 to {len(u) means the number of items in that array}
				U.append(u[c]) # Storing the value in form of string (By Default it will store in string) of 1st column in array formed by spliting the each line from the datafile into a Null array
		lc = lc + 1 # Appending value for lc so that linecount can be easily manipulated
filename = P[y-1] + '  vs  ' + P[x-1] + '.png' # Defining a string variable for saving name for graph
# Plotting the data <in labels and title -1 is done beacuse in python counter starts from zero>
pt.figure()
pt.plot(X,Y)
pt.xlabel(P[x-1] + U[x-1])
pt.ylabel(P[y-1] + U[y-1])
pt.title(P[y-1] + '  vs  ' + P[x-1])
pt.savefig(filename)
pt.show()
Output
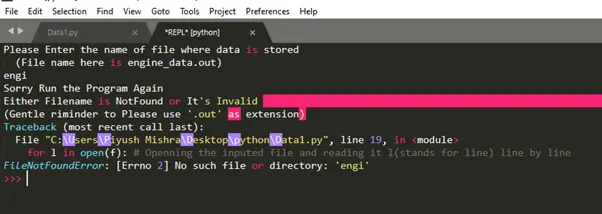
Compatibility Check
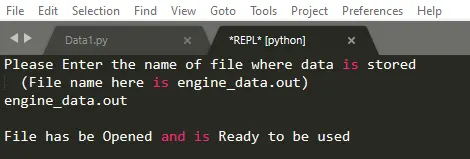
Failed Attempt
Successful Attempt
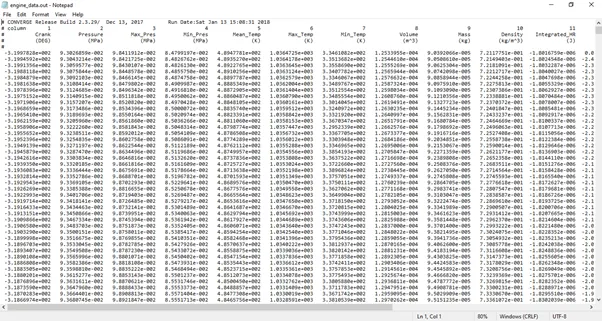
Screenshot of file:
First Result (This is Done manually)
Second Result
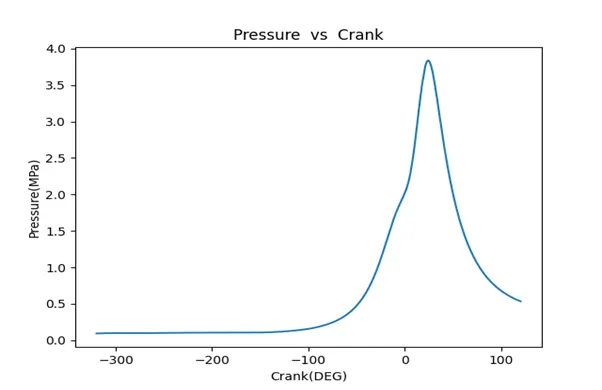
Graph: (User define y = 2{Pressure} and x =1{Crank})
Conclusion
We were finally able to get all the things as per the requirements