Week 6 - Data analysis
Assignment 7
OBJECTIVE: The main objective of this challenge, is to write a script by using python which is quite commonly used in companies for data analysis. As well as to plot the P-V Diagram, Calculating the Pressure value, Volume value, Work done, Power and Specific fuel consumption. And also
To write the script that should take column numbers as the input and plot the respective columns as separate images
To save the Each file by the name of the column
To plot the labels which is should be extracted from the file.
PROBLEM STATEMENT:
In this assignment we have to write a script, which is a complicated, and followed in the industries. REPL (Read-Eval-Print Loop) have to installed because which is an interactive programming space, Which takes the user inputs and gives the appropriate output.
SOFTWARE USED:
Python3.6 (64bit), subline text3 as text editor.
THEORY:
Data analysts are responsible for interpreting data and analyzing the results utilizing statistical techniques and providing ongoing reports. They develop and implement data analyses, data collection systems, and other strategies that optimize statistical efficiency and quality. They are also responsible for acquiring data from primary or secondary data sources and maintaining databases. Besides, they identify, analyze, and interpret trends or patterns in complex data sets. Data analysts review computer reports, printouts, and performance indicators to locate and correct code problems. By doing this, they can filter and clean data. Data analysts conduct full lifecycle analyses to include requirements, activities, and design, as well as developing analysis and reporting capabilities. They also monitor performance and quality control plans to identify improvements. Finally, they use the results of the above responsibilities and duties to better work with management to prioritize business and information needs.

DATA FILE:
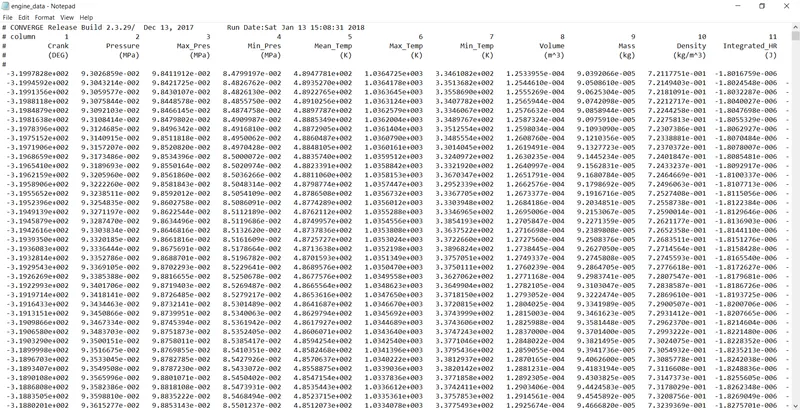
PROCEDURE: To write a script by using python which is quite commonly used in companies for data analysis.
1. Open subline text editor.
2. Open a new file and save it as ----.py
3. Write the comment that what is the program is about, which the line is never executed. And write the comment first followed by #(pound) or double quotation codes in starting and as well as at the end of comments. then
import matplotlib.pyplot as plt
import numpy as np
from numpy import trapz
here importing of trapz from numpy plays an important role while sloving this type of problems.
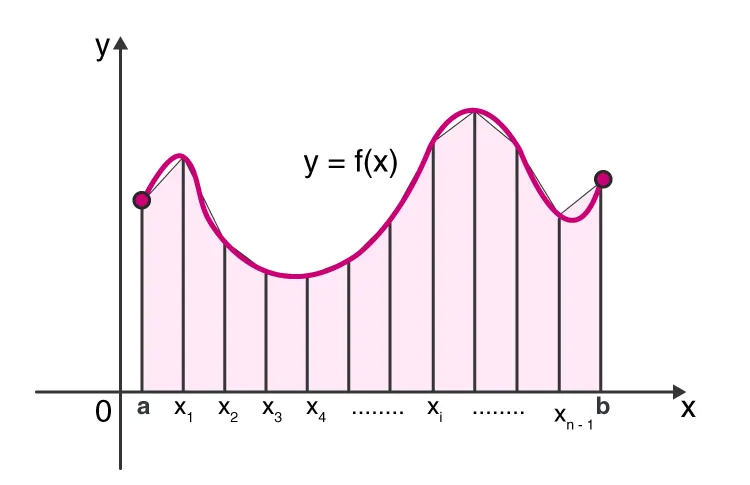
In Calculus, “Trapezoidal Rule” is one of the important integration rules. The name trapezoidal is because when the area under the curve is evaluated, then the total area is divided into small trapezoids instead of rectangles. This rule is used for approximating the definite integrals where it uses the linear approximations of the functions.
The trapezoidal rule is mostly used in the numerical analysis process. To evaluate the definite integrals, we can also use Riemann Sums, where we use small rectangles to evaluate the area under the curve.
4. Input function lets asks us for some text input. We can call this function to tell the program to stop and wait for the user to key in the data. If the filename which we enter is correct, it has to say that the file is valid or else file is invalid.
# Inputing the file name
filename = input("Enter the filename: ")

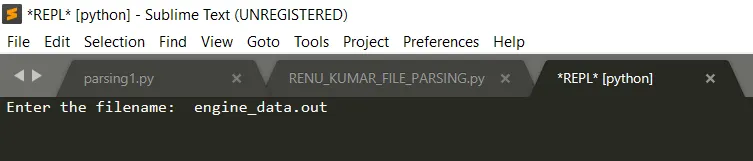
# If file name is correct
if filename == 'engine_data.out':
print('file is valid')
if we enter the correct name as file input, it shows that the file is valid

# If file name is not correct
else:
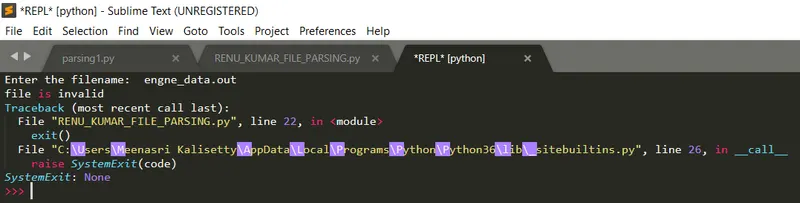
print('file is invalid')
exit()
if we doesn't enter the correct name for file input, it shows that the file is invalid
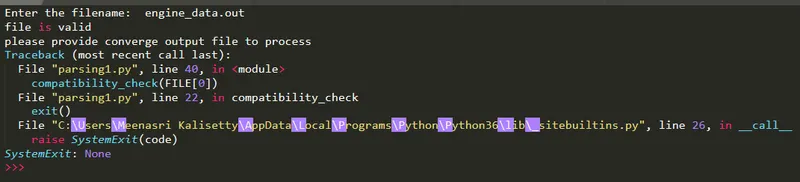
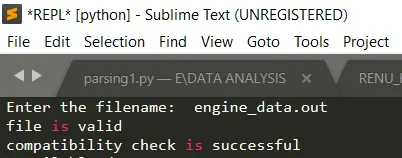
5. We have to provide a converge output file for processing the data in order to make the compatibility check is successful or else please provide converge output file to process had to be displayed.
#Check for the compatibility
def compatibility_check(a):
if 'CONVERGE' not in a:
print('please provide converge output file to process')
exit()
else:
print('compatibility check is successful')
pass
6. Now we have to open the file by using for loop command and split the values vertically by using the append function.
for line in open(filename):
if '#' in line:
FILE.append(line.split())
compatibility_check(FILE[0]) #checking for compatibility
7. Now we have define and input the first and second value in the file as well as to input the column number, column value and column units respectively.
fvalue = len(FILE[1]) #first value
svalue = len(FILE[2]) #second value
col_no = [] #column no.
col_val = [] #column value
col_units = [] #column units
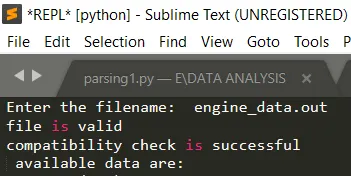
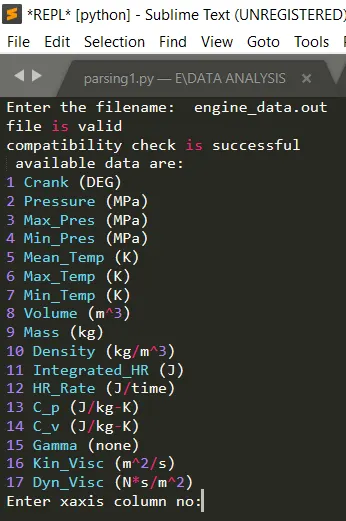
8. We have to check each and every line in the file and append command must be used in order to input the correct data as well as to check that the correct data is available or not. This makes the process easier. And it has to display the available data, along with its column number, column value and column units.
h = FILE[1].index('column')
for i in range(h,fvalue-1):
col_no.append(i) #column number operation
for j in FILE[2]:
if j is not '#':
col_val.append(j) #column value operation
for k in FILE[3]:
if k is not '#':
col_units.append(k) #colunm units operation
print('data available are:') #printing the available data
9. Now it has to display the available data, along with its column number, column value and column units.
for a in range(0,len(col_no)):
print(col_no[a],col_val[a],col_units[a]) #printing the column number, column value, and column units
xaxis = int(input('Enter xaxis column no:'))-1
yaxis = int(input('Enter yaxis column no:'))-1
It also displays that enter xaxis number, after entering xaxis number, it asks for enter yaxis number. we have to enter the respect values for plotting graph, it totally based on our requirements.
9. Now slitting the lines by axis by using append command
x = []
y = []
for line in open(filename):
if '#' not in line:
x.append(float(line.split()[xaxis])) #splitting the lines by axis
y.append(float(line.split()[yaxis]))
10. Providing the line width and plotting the graph along with its legends based on column number.
plt.plot(x,y,linewidth=1.8) #plotting graph by linewidth as 1.5
plt.xlabel(col_val[xaxis])
plt.ylabel(col_val[yaxis])
plt.show()
11. Spliting the lines and making the pv diagram graph by using column 1 and7
pressure = []
vol = []
for line in open(filename):
if '#' not in line:
pressure.append(float(line.split()[1])) #splitting the lines by column
vol.append(float(line.split()[7]))
12. Finding the pressure, Volume, area, work done, power and secific fuel consumption values
Pressure = 1e6*np.array(pressure) #pressure value
Volume = np.array(vol) #volume value
area = np.trapz(Pressure,Volume) #finding area with respect to pressure and volume
print('workdone =',area, 'joules') #calculating the work done
cyclepersec = 750/60 #finding the cycles per second
power = area*(cyclepersec/1000) #calculating the power
print('power=',power,'kw')
mass_flow = 20e-6 #finding the mass
sfc = mass_flow*3600/power # calculating the specific fuel consumption.
print('specific fuel consumption =',sfc,'g/kwh') #print the specific fuel consumption.
PROGRAM SCREEN SHOT
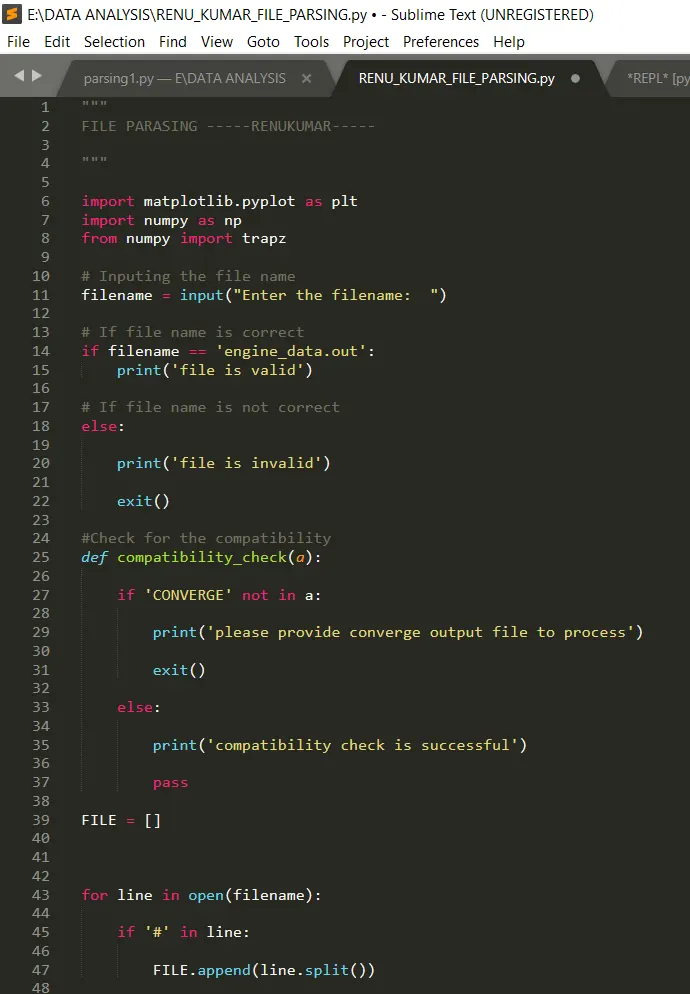
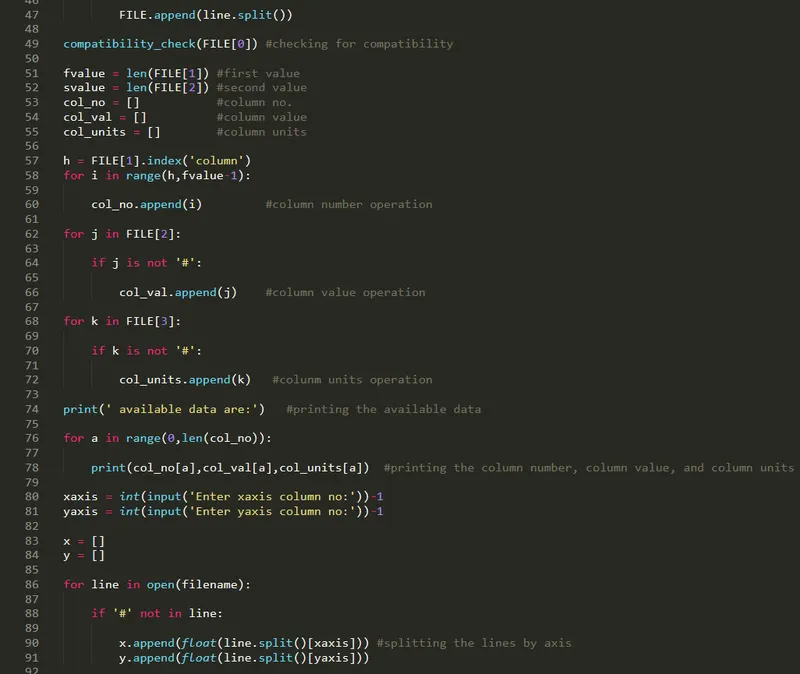
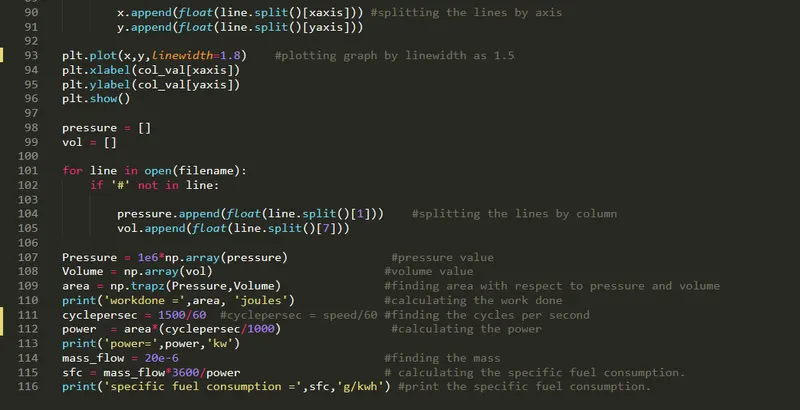
PROGRAM
"""
FILE PARASING -----RENUKUMAR-----

"""

import matplotlib.pyplot as plt
import numpy as np
from numpy import trapz

# Inputing the file name
filename = input("Enter the filename:  ")

# If file name is correct
if filename == 'engine_data.out':
	print('file is valid')

# If file name is not correct
else:

	print('file is invalid')

	exit()

#Check for the compatibility
def compatibility_check(a):

	if 'CONVERGE' not in a:

		print('please provide converge output file to process')

		exit()

	else:

		print('compatibility check is successful')

		pass

FILE = []


for line in open(filename):

	if '#' in line:

		FILE.append(line.split())

compatibility_check(FILE[0]) #checking for compatibility

fvalue = len(FILE[1]) #first value
svalue = len(FILE[2]) #second value
col_no = []           #column no.
col_val = []          #column value
col_units = []        #column units

h = FILE[1].index('column')
for i in range(h,fvalue-1):

	col_no.append(i)         #column number operation

for j in FILE[2]:

	if j is not '#':

		col_val.append(j)    #column value operation

for k in FILE[3]:

	if k is not '#':

		col_units.append(k)   #colunm units operation

print(' available data are:')   #printing the available data

for a in range(0,len(col_no)):

	print(col_no[a],col_val[a],col_units[a])  #printing the column number, column value, and column units

xaxis = int(input('Enter xaxis column no:'))-1
yaxis = int(input('Enter yaxis column no:'))-1

x = []
y = []

for line in open(filename):

	if '#' not in line:

		x.append(float(line.split()[xaxis])) #splitting the lines by axis
		y.append(float(line.split()[yaxis]))

plt.plot(x,y,linewidth=1.8)    #plotting graph by linewidth as 1.5
plt.xlabel(col_val[xaxis])
plt.ylabel(col_val[yaxis])
plt.show()

pressure = []
vol = []

for line in open(filename):
	if '#' not in line:

		pressure.append(float(line.split()[1]))    #splitting the lines by column
		vol.append(float(line.split()[7]))

Pressure = 1e6*np.array(pressure)               #pressure value
Volume = np.array(vol)                         #volume value
area = np.trapz(Pressure,Volume)               #finding area with respect to pressure and volume
print('workdone =',area, 'joules')             #calculating the work done
cyclepersec = 1500/60  #cyclepersec = speed/60 #finding the cycles per second
power  = area*(cyclepersec/1000)                #calculating the power
print('power=',power,'kw')
mass_flow = 20e-6                              #finding the mass
sfc = mass_flow*3600/power                     # calculating the specific fuel consumption.
print('specific fuel consumption =',sfc,'g/kwh') #print the specific fuel consumption.
RESULTS AND DISCUSSION
GRAPHS
PRESSURE VS VOLUME:
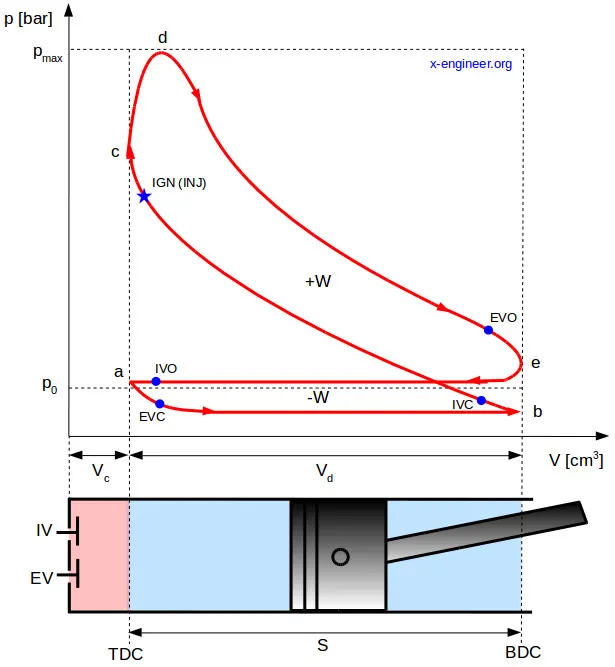
The internal combustion engine is a heat engine. It’s working principle is based on the variation of pressure and volume inside the engine’s cylinders. All heat engines are characterized by a pressure-volume diagram, also known as pV diagram, which basically shows the variation of the pressure in the cylinder function of its volume, for a complete engine cycle.
Also, the work produced by the internal combustion engine is directly dependent on the variation of the pressure and volume inside the cylinder.
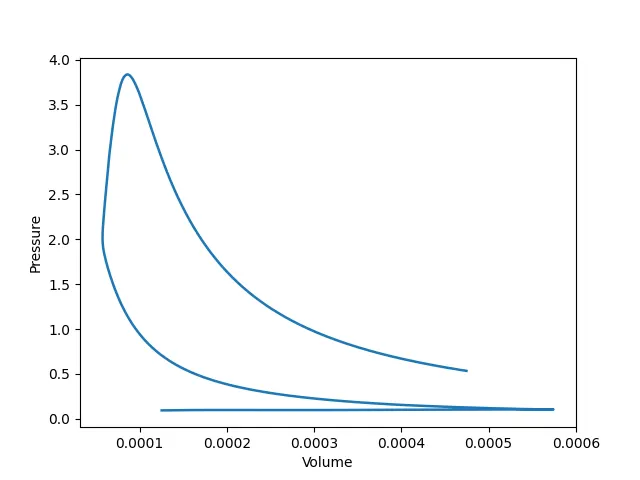
FIG: 1.1PRESSURE VS VOLUME
PRESSURE VS CRANK
VOLUME VS CRANK
OUTPUTS
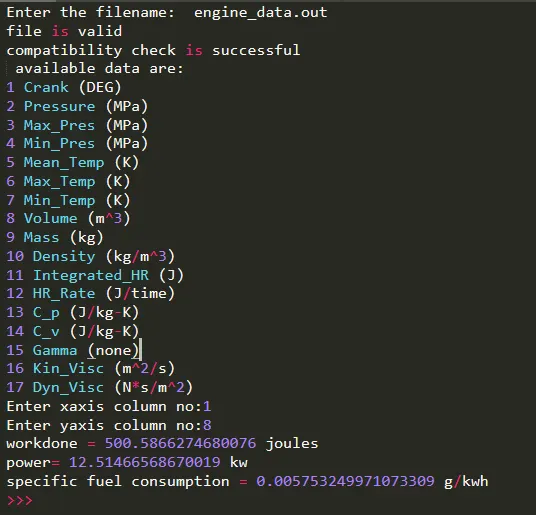
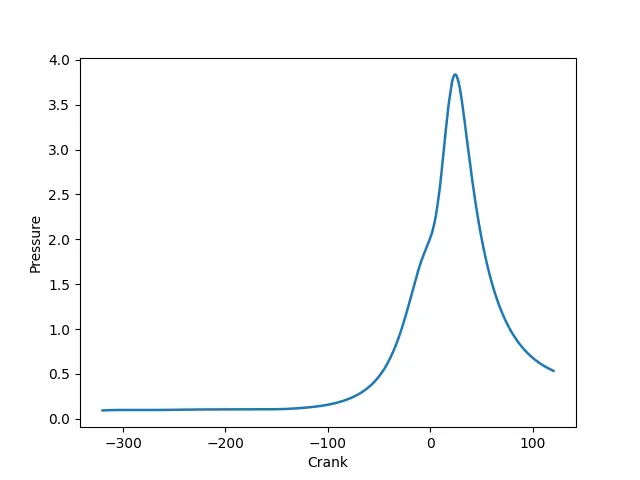
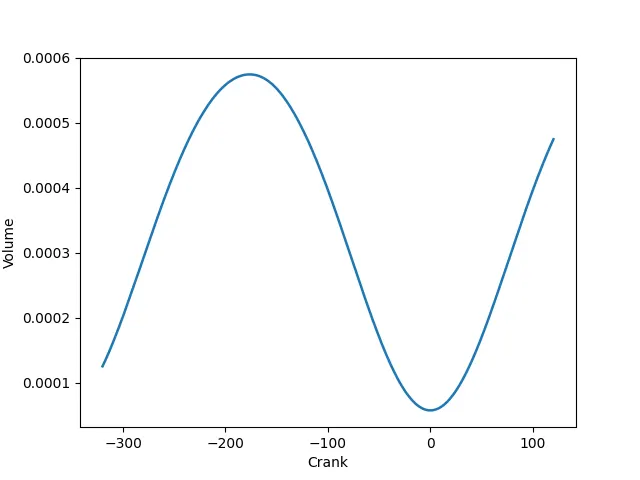
DISCUSSION: The above fig 1.1 shows the pv diagram which is seems to be like a otto cycle. so the given engine data file is a otto cycle engine file. basically it shows the variation of the pressure in the cylinder function of its volume, for a complete engine cycle. So iit is an otto cycle. Generaly crank angle and pressure plots are used for valve timing diagrams of an engine, so the given engine data is a four stroke engine and it is a Petrol (gasoline) engine. based on the reference. The workdone of an engine is = 500.5866274680076 joules, The power= of an engine is 12.51466568670019 kw, The specific fuel consumption of an engine = 0.005753249971073309 g/kwh
REFERENCE:
http://thecartech.com/subjects/engine/Internal_combustion_Engines24.htm