Week 6 - Data analysis
Problem Statement -
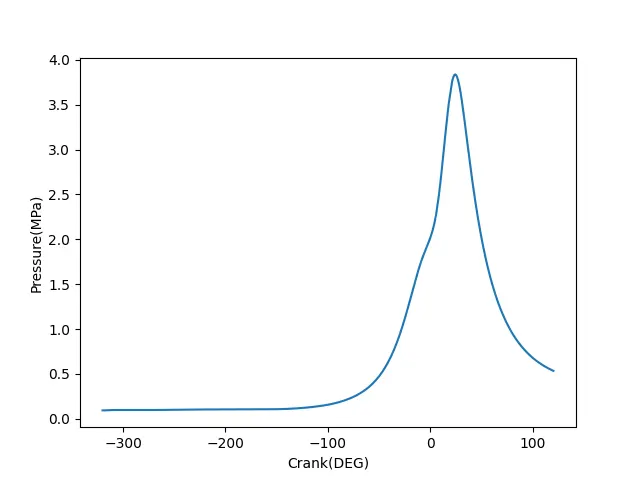
Create a data visualizer for converge output files. It should allow the user to output plots for various gas properties and also allows them to plot properties against each other. Lastly, it should compute and output basic performance parameters such as work done, power, and specific fuel consumption of the engine.
The program -
import math
import matplotlib.pyplot as plt
import numpy as np

for line in open('engine_data.out'):
    if '# CONVERGE' in line: #check for file compatbility, verify converge file
        #receive user input for the number of quantities to be plotted and column numbers of the quantity
        n = int(input("Enter number of columns you wish to visualize : "))
        ColNos = []
        for i in range(0, n):
            ele = int(input("Enter the coulmn number :"))
            if ele<=0 or ele>17:
                raise Exception('The value of input column number cannot be less than equal to zero or be greater than 17')
            ColNos.append(ele)

        X = []
        Y = []
        Xname = []
        Yname = []
        Xunits = []
        Yunits = []
        # ask if user wants to plot two quantities, and if yes, the column numbers of the two quantities
        answer = input("Do you wish to plot two Quantities, please enter yes or no : ")
        if answer == "yes":
            Col1 = input("Enter the column for quantity on x-axis :")
            Col2 = input("Enter the column for quantity on y-axis :")
            Col1 = int(Col1)
            Col2 = int(Col2)
            for line in open('engine_data.out'):
                if '#          Crank' in line:
                    names = line.split()
                if '#          (DEG)' in line:
                    unit = line.split()
                if '#' not in line:
                    values = line.split()
                    X.append(float(values[Col1 - 1]))
                    Y.append(float(values[Col2 - 1]))
            Xname.append(names[Col1])
            Yname.append(names[Col2])
            Xunits.append(unit[Col1])
            Yunits.append(unit[Col2])
            labelX = [r + s for r, s in zip(Xname, Xunits)]
            labelY = [p + q for p, q in zip(Yname, Yunits)]
            VS = [" VS "]
            filename = [c + d for c, d in zip(labelX, labelY)]

            g = plt.figure(1)
            plt.plot(X,Y)
            plt.xlabel(labelX[0])
            plt.ylabel(labelY[0])
            g.savefig(filename[0])
        #if the user elects not to plot two quantities against each other, print following -
        else:
            print("You have elected to not plot any quantities against each other")

        # extract name of the properties and respective units as per previous user input
        propname = []
        units = []
        for i in range(0,n):
            for line in open('engine_data.out'):
                if '#          Crank' in line:
                    names = line.split()
                if '#          (DEG)' in line:
                    unit = line.split()
            propname.append(names[ColNos[i]])
            units.append(unit[ColNos[i]])

        #element wise concatenation of two lists
        label = [x + y for x, y in zip(propname, units)]

        #check the number of columns to be plotted
        #extract values of the properties from the input of column numbers
        #use the values to create plots. use the property name and units for axis labels
        #save the figure window and assign file name as property name
        prop = []
        if n == 1:
            for line in open('engine_data.out'):
                if '#' not in line:
                    values = line.split()
                    prop.append(float(values[ColNos[i]-1]))
            h = plt.figure(2)
            plt.plot(prop)
            plt.xlabel('time')
            plt.ylabel(label[0])
            plt.show()
            h.savefig(propname[0])

        if n > 1:
            for i in range(0,n):
                for line in open('engine_data.out'):
                    if '#' not in line:
                        values = line.split()
                        prop.append(float(values[ColNos[i]-1]))

                h = plt.figure(2)
                plt.plot(prop[(i*8665):((i+1)*8665)])
                plt.xlabel('time')
                plt.ylabel(label[i])
                h.savefig(propname[i])
                plt.show()

        #Basic Performance Calculations
        #Work done, Power, Sfc
        pressure = []
        volume = []
        rpm = 1500
        fuel_con_per_stroke = 20
        for line in open('engine_data.out'):
                    if '#' not in line:
                        values = line.split()
                        pressure.append(float(values[1]))
                        volume.append(float(values[7]))
        #Integrate along the given axis using the composite trapezoidal rule.
        work_done = np.trapz(pressure, volume)
        power = (math.pi*2*work_done*rpm)/60
        fuel_rate = (fuel_con_per_stroke*rpm)/(2*60*1000)
        sfc = (fuel_rate*3600)/(power*1000)

        print('work done in MJ = ', work_done)
        print('power in kW = ', power)
        print('specific fuel consumption in g/kWh = ', sfc)
        break
    #If the input file is not compatible, output error message and exit the program
    else:
        print('File not recognized. Please provide a valid CONVERGE output file')
        break
-> The program starts with a file compatibility check. For the file to compatible, the output file's first line should have the words - '# CONVERGE'. Else, the program exits with a message saying - 'File not recognized. Please provide a valid CONVERGE output file.'
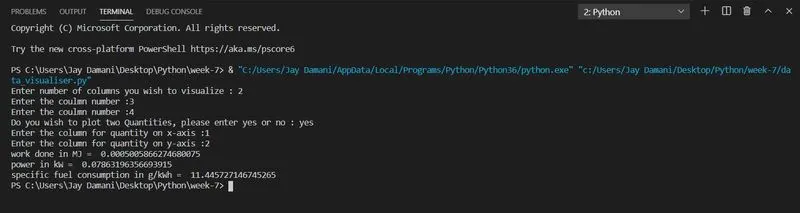
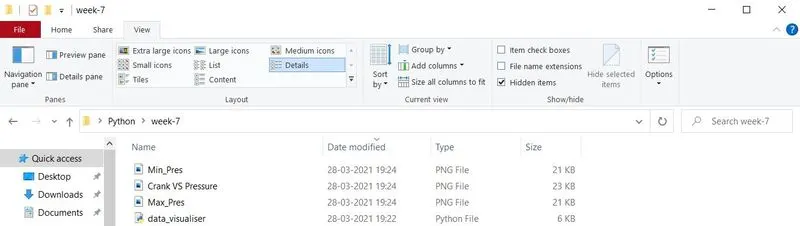
-> If the file is compatible, the program moves to user inputs for the number of properties to be plotted, the column number of each property to be plotted, also asks if the user wants to plot two properties against each other and if yes, what are the column numbers for the two properties. The input column numbers are used to extract property values, units, and names of the two properties in question. This is done using the open() function to read the file line-by-line and using the .split() function we split each line of the data file and extract the values as per the column number. These items are used to create the plots, assign axis labels, and give file names for the figure window that is saved. If no, the user gets a message saying they have elected not to plot two properties against each other.
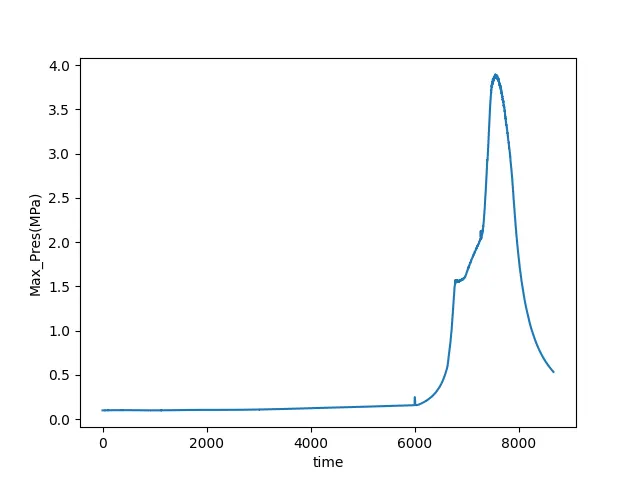
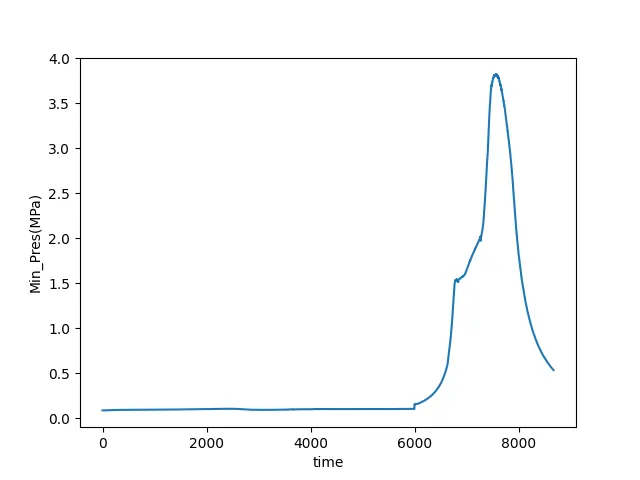
-> Once all inputs are received, these column numbers are used to extract values of the properties, their names, and their units from the data file. This is done using the open() function to read the file line-by-line as many times as the number of columns the user has asked to plot. And using the .split() function we split each line of the data file and extract the values as per the column number. These items are used to create the plots, assign axis labels, and give file names for the figure window that is saved.
-> For the performance parameters, the work done is computed using the trapz function from the numpy library that helps calculate the area under the curve for values of y with respect to the x-axis values. In this case y - pressure values and x - volume values. The power and specific fuel consumption are calculated using the given rpm and fuel consumption inputs with their respective formulae. The values computed are printed in the output.
Outputs -
User inputs, plotting properties, saving figure windows, output performance parameters -
Compatibility check -